


Gold Price Forecast: Iran Denies Trump Negotiation Plan, Gold Price May Fall to $3,500


TradingKey - As of today's (July 1st) Asian morning session, gold ( XAUUSD) prices maintained a weak intraday decline. After stabilizing above $4,000 at yesterday's close, the gold price broke below $4,000 again today, indicating that market sentiment leans toward the bearish side against the backdrop of instability in US-Iran relations.
Expectations for US-Iran Negotiations Fall Short, Gold Prices Face Significant Downward Pressure
From a fundamental perspective, the core reason for today's drop in gold prices lies in the dashed expectations of US-Iran peace talks. Previously, US President Trump stated that the US and Iran would hold talks in Qatar on Tuesday, which brought expectations to the market that the Middle East conflict would ease. However, the latest news shows that diplomatic progress between the US and Iran is not as optimistic as the market had previously anticipated.
Qatar stated that there are currently no direct or high-level negotiations scheduled between the United States and Iran. Meanwhile, Iran also sent a relatively hawkish signal, stating that there are no plans to hold talks with the US in the coming days. This means that the market's previous expectations of a rapid easing in US-Iran relations have been weakened, and the situation in the Middle East remains highly uncertain.
At the same time, the US dollar maintained its relative strength and US Treasury yields remained at high levels, which increased the holding cost of gold, a non-yielding asset, further intensifying the downward pressure on gold prices. In addition, US June non-farm payrolls data will be released on Thursday. Investors remained cautious ahead of the news on US-Iran negotiations and the release of the US non-farm data, and short-term capital was unwilling to aggressively chase longs below $4,000, thereby dragging down gold prices.
Gold Price Analysis: Bearish Outlook Maintained, Watch for Target at $2,500
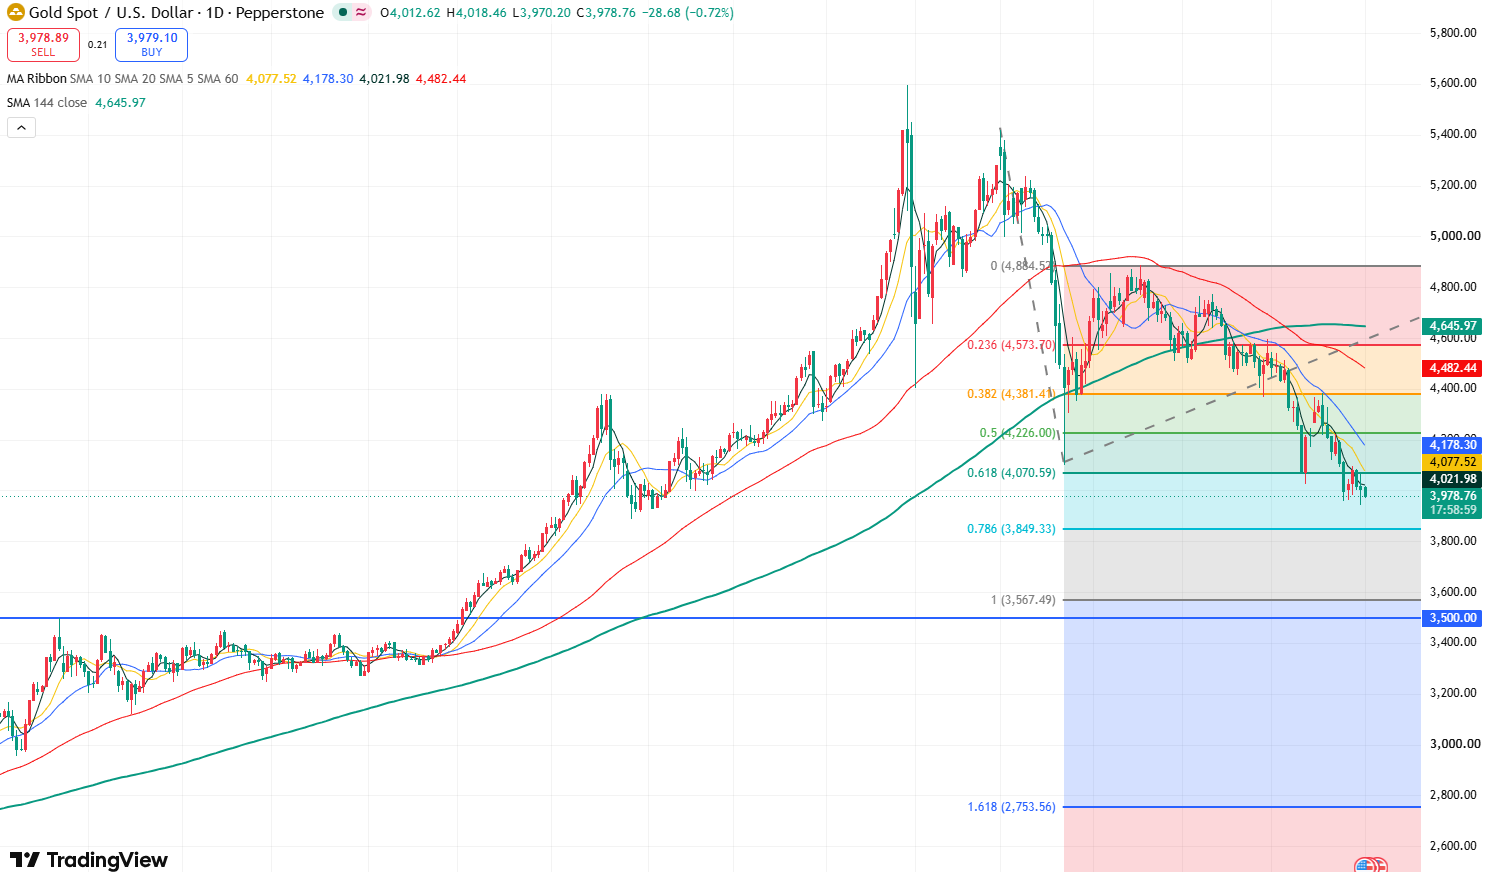
Gold price daily chart, Source: TradingView
Looking at the daily chart of gold, since surging to $5,419 in March this year, the gold price has formed a double top pattern with the historic high of $5,597 recorded at the beginning of this year, driving a continuous pullback in gold prices. The recent highs and lows of the candlestick chart also show a sustained downward trend, indicating that the overall trend of gold prices exhibits a clear decline.
From the moving average system perspective, the 5, 10, 20, and 60 SMA lines have all crossed below the 144 SMA, forming a death cross structure. Meanwhile, multiple moving averages maintain a bearish alignment, further reinforcing the market's bearish momentum and indicating that the downward trend of gold prices has strong continuity.
In the short term, the recent gold price movement is expected to continue its downward trend. The primary target will be to test the support level at $3,900. If this level is breached, the gold price will further pull back toward the 0.786 Fibonacci retracement level of $3,850. If the downward trend persists, the gold price may test the 1.0 Fibonacci retracement level of $3,560, and could even drop to $3,500.

Trade XAU/USD with Tight Spreads
The above content was completed with the assistance of AI and has been reviewed by an editor.


