


The Nonfarm Payroll (NFP) report is one of the most closely followed US economic releases. Its results can influence Federal Reserve interest-rate decisions and trigger strong movements across financial markets, particularly in the US dollar and major currency pairs, as well as gold, bonds, stocks, and cryptocurrencies.
🎯This article explains what NFP measures, how it is calculated, how it affects financial markets, and how traders can interpret different NFP outcomes to make better-informed trading decisions.
What Is Nonfarm Payroll (NFP)?
Nonfarm Payroll, commonly shortened to NFP, refers to the monthly change in the number of nonfarm wage and salary jobs in the United States. It is the headline employment estimate from the Establishment Survey, which forms part of the Employment Situation report published by the US Bureau of Labor Statistics (BLS).
NFP measures payroll jobs rather than individual workers. Therefore, a person employed by two qualifying establishments is counted once for each job. By contrast, sole proprietors and other unincorporated self-employed workers are not included.
The report covers most private-sector industries and civilian employees working for federal, state and local governments. However, it excludes:
Farm workers, except those employed in logging
Private household employees
Sole proprietors and unincorporated self-employed workers
Unpaid family and volunteer workers
Military personnel
People on unpaid leave for the entire reference pay period
Workers are generally counted when they receive pay for any part of the pay period containing the 12th day of the month. Logging is included even though other agricultural employment is excluded from the nonfarm series.
Why NFP Matters?
Nonfarm Payrolls (NFP) is a paramount benchmark for the US economy and a primary driver of global financial markets. Its significance is rooted in four key pillars:
✅Economic Fundamentals Indicator: NFP directly reflects business expansion and labor market tightness. Job growth underpins household income and consumer spending—the primary engine of US GDP.
✅Federal Reserve Policy Anchor: Bound by its dual mandate of maximum employment and price stability, the Fed relies heavily on NFP, alongside wage growth and inflation data, to dictate interest rate trajectories.
✅Market expectations: Traders usually compare the actual NFP result with the market forecast and previous readings. A positive figure can still disappoint markets when job growth is weaker than expected.
✅Cross-Asset Volatility Catalyst: Shifts in rate expectations sparked by NFP surprises instantly reprice major asset classes, driving sharp movements across the US dollar, equities, Treasuries, gold, and crypto.
An Illustrative Example of NFP Data: 2016–2026
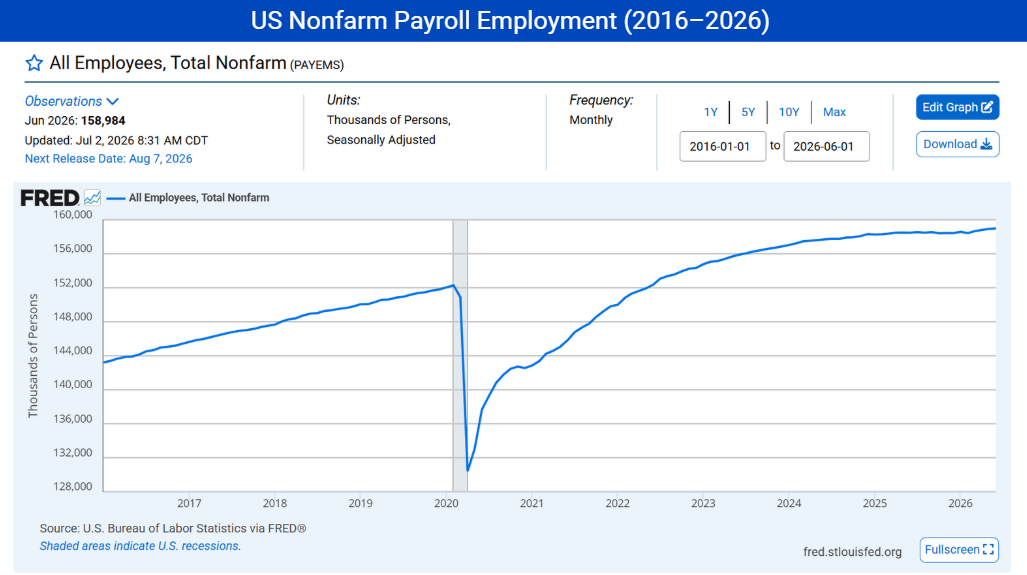
The chart below illustrates how total nonfarm payroll employment changed in the United States between 2016 and 2026:
Source: FRED, using BLS data
Over the 2016–2026 period, nonfarm payroll dynamics were the single greatest catalyst for global market sentiment, unfolding in three distinct phases:
2016–Early 2020 (The Goldilocks Era): Steady, moderate job gains supported steady GDP expansion with low inflation, allowing the Federal Reserve to conduct a predictable, gradual policy normalization with minimal market disruption.
2020: The unprecedented plunge COVID-19 shutdowns caused in payrolls forced emergency monetary and fiscal intervention, slashing interest rates to zero and pumping massive liquidity into global financial assets.
2020–2026 (The Inflationary Recovery & Volatility Era): As payrolls roared back, persistent tight labor markets fueled wage growth and inflation. NFP releases became high-stakes monthly events, where hot numbers sparked rate-hike scares and cooler figures fueled soft-landing hopes, directly dictating cross-asset valuations.
When Is the Next NFP Release? 2026 NFP Schedule
The next NFP release is scheduled for Friday, October 2, 2026, at 8:30 a.m. Eastern Time, corresponding to 4:30 p.m. Gulf Standard Time. It will cover US employment conditions in July 2026.
Nonfarm Payrolls (NFP) data is released by the U.S. Bureau of Labor Statistics (BLS), usually on the first Friday of every month at 8:30 a.m. Eastern Time (4:30 p.m. Gulf Standard Time). However, if the first Friday falls on a public holiday (such as Independence Day or New Year's Day), the release is typically postponed or rescheduled to another business day, such as a Thursday or the following week.
2026 US NFP Release Dates
Source: US Bureau of Labor Statistics Employment Situation schedule.
How Is NFP Calculated?
NFP is calculated by estimating the number of payroll jobs in covered US businesses and government agencies, then comparing the current month with the previous month.
The calculation involves several steps:
Step 1: Collect Employer Payroll Data
The BLS collects employment, earnings, and working-hours data from about 119,000 businesses and government agencies, representing approximately 622,000 worksites.
Employers report workers who received pay for any part of the pay period containing the 12th day of the month. Because NFP measures jobs, someone with two qualifying payroll positions may be counted twice.
Step 2: Estimate Employment Across Industries
The BLS matches employer responses from the current and previous months and weights the sample to estimate employment across the wider economy.
These estimates cover industries such as construction, manufacturing, healthcare, retail, financial services, and civilian government employment.
Step 3: Adjust for Business and Seasonal Changes
New businesses and permanent closures cannot always enter the sample immediately. The BLS therefore uses a statistical model to estimate the net employment created by business openings and lost through business closures.
The results are also seasonally adjusted to remove recurring effects associated with holidays, school calendars, and regular industry hiring cycles.
Step 4: Compare Monthly Payroll Employment
The headline NFP result represents the difference between the current and previous months’ seasonally adjusted nonfarm payroll employment.
The two previous months are routinely revised as more employer responses become available. The estimates are also benchmarked annually against more complete employment records.
Understanding the NFP Calculation
To determine the monthly Nonfarm Payrolls (NFP) figure, the BLS aggregates seasonally adjusted employment data across covered industries. The resulting headline change is represented in two equivalent ways:
Macro Headline Change:

Sectoral Breakdown:
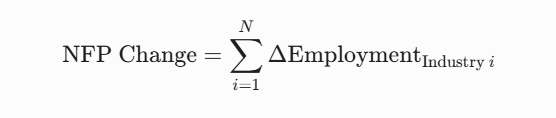
★ How They Connect: Rather than two separate processes, these formulas represent the same underlying data. The BLS aggregates industry-level estimates to produce total nonfarm employment—Formula 1 expresses the final monthly net change, while Formula 2 reveals how each industry contributed to that growth.
Simple Example of an NFP Calculation
After estimating seasonally adjusted employment for each sector, the BLS sums net job changes across all non-overlapping industries to produce the headline NFP figure. Each job gained or lost contributes directly (1:1) to the total.
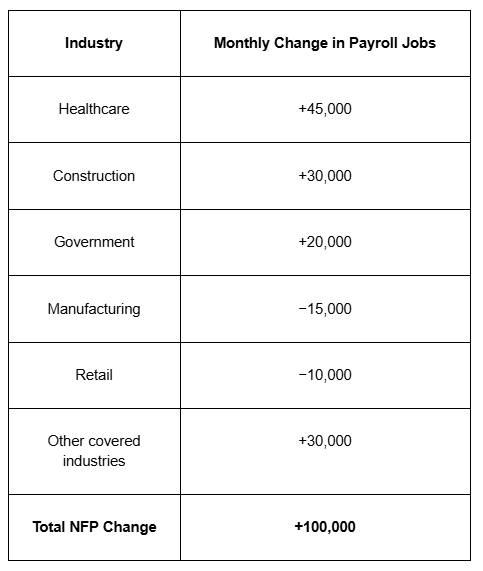
In this example, the economy added an estimated 100,000 nonfarm payroll jobs because gains in healthcare, construction, government, and other industries exceeded losses in manufacturing and retail.
The result indicates net job creation and continued labor demand, which can support household income, consumer spending, business activity, and economic growth. And positive job growth can influence expectations for the US economy and Federal Reserve interest-rate decisions, potentially increasing volatility across financial markets
What Factors Influence NFP?
1. Economic growth and consumer demand: When sales and production rise, businesses may hire to meet demand. Slower consumption or falling orders may encourage employers to freeze recruitment, reduce hours or cut positions.
2. Interest rates and credit conditions: Higher borrowing costs can slow housing, business investment and consumer spending. Lower rates may support hiring, although their effect usually appears with a delay.
3. Business confidence and investment: Companies are more likely to expand payrolls when they expect stable demand. Uncertainty about profits, policy or trade can make them postpone hiring even if current activity remains solid.
4. Seasonal and industry patterns: Holidays, school calendars, tourism and annual hiring cycles create large recurring changes. Seasonal adjustment removes expected patterns, but unusual timing can still affect the monthly estimate.
5. Temporary disruptions and public-sector changes: Severe weather, strikes and supply interruptions may temporarily reduce work. Government hiring or layoffs can also move total NFP because civilian government employees are included.
What Information Is Included in the US Jobs Report?
Although “NFP report” is widely used as a shortcut, NFP is only one part of the broader US Jobs Report. Its other indicators provide important context for interpreting the headline payroll result, assessing labor-market strength, and understanding its potential market impact.
Nonfarm Payroll Report Compared With Other US Labor Market Indicators
NFP measures monthly changes in nonfarm payroll jobs, the unemployment rate measures the share of the labor force that is unemployed, and the ADP Employment Report estimates private-sector employment changes. Comparing them provides different views of the US labor market.
ADP is often compared with NFP because both report monthly employment changes. However, ADP excludes government payrolls and is an independent measure rather than a forecast of the BLS result, so the two reports can produce different results in the same month.
How Does NFP Influence the Fed’s Decisions?
The Federal Reserve uses NFP to assess labor-market conditions under its dual mandate of maximum employment and stable prices. NFP influences interest-rate decisions by changing the Fed’s assessment of employment and inflation risks. Its impact depends on the complete jobs report and how it fits with other economic and financial data.
How Does NFP Affect Financial Markets?
NFP can trigger sharp price movements across financial markets because an unexpected result may cause investors to quickly reassess the outlook for the US economy and monetary policy.
These are possible reactions, not fixed rules. Unemployment, wages, revisions, market positioning and the broader economic environment can outweigh the NFP.
1. US Dollar and Forex
A stronger-than-expected NFP report can make the US dollar stronger if it reduces expectations for interest-rate cuts. Higher US yields may increase demand for dollar-denominated assets, placing downward pressure on pairs such as EUR/USD and GBP/USD.
But please note that the dollar can still fall after a strong headline if unemployment rises, wage growth slows or earlier payrolls are revised sharply lower. Traders should judge whether the full report changes the expected path of Fed policy.
2. Gold
Gold often reacts through Treasury yields and the US dollar. A strong NFP report combined with firm wages may push yields and the dollar higher, which can pressure non-yielding gold.
A weaker report may support gold if markets anticipate lower interest rates. However, gold can also fall during risk-off moves when investors seek dollar liquidity, so NFP’s effect on XAU/USD is not automatic.
3. Other Currencies and Commodities
NFP can affect global markets through US interest-rate expectations and the dollar. A stronger dollar after higher-than-expected NFP may pressure EUR/USD, GBP/USD, AUD/USD and NZD/USD, while USD/JPY may react to US–Japan yield expectations.
A rising dollar may pressure silver, copper and oil, but stronger employment can also support demand expectations. Therefore, supply conditions and market-specific factors may outweigh the dollar’s effect.
4. Bonds and Treasury Yields
Higher-than-expected employment and wages may lead markets to expect tighter monetary policy, pushing Treasury yields higher and bond prices lower. Weaker labor data can produce the opposite reaction.
5. US Stocks
Stock market reactions depend heavily on the underlying economic regime. In a high-inflation environment, stocks may view a strong jobs report as bad news, as it reinforces higher-for-longer interest rates and elevates borrowing costs. Rate-sensitive growth shares, including many Nasdaq 100 companies, can face pressure when yields rise.
Conversely, when recession fears dominate, stocks often welcome a strong report as good news, taking it as a sign of resilient income and sustained consumer spending.
6. Cryptocurrencies
Bitcoin and other cryptocurrencies can react to changes in liquidity expectations and risk appetite. A strong NFP and higher yields may pressure speculative assets, while a weak report can support them if markets expect easier policy.
Volatilities following NFP data releases can create opportunities across multiple markets. With a single Mitrade account, you can trade gold, stocks, currencies, and cryptocurrencies, capitalizing on two-way price movements through long or short positions—all while utilizing risk management tools during volatile periods.


How to Decode an NFP Report
A disciplined decoding process helps separate the underlying labor-market signal from the initial market reaction. Traders should therefore examine both the details inside the report and the wider market context.
The following steps provide a structured way to interpret the release.
Part 1: Inside the Report
1. Headline NFP vs. Revisions: Start with the headline payroll change, then check revisions to the previous two months. Large downward revisions can weaken an apparently strong result, while upward revisions can strengthen the recent employment trend.
2. The Household Survey Data: Review the unemployment rate and labor force participation rate. These figures come from the Household Survey, so they can move differently from payroll employment and provide another view of labor-market conditions.
3. Wage and Hours Metrics: Examine average hourly earnings and average weekly hours. Faster wage growth may reinforce inflation concerns, while falling weekly hours may signal softer labor demand before payroll growth weakens.
4. Breadth of Hiring: Check which industries added or lost jobs. Broad employment gains generally provide stronger evidence of widespread labor demand than gains concentrated in government or a single private-sector industry.
Part 2: Market Context
5. Compare Against Expectations: Compare the actual NFP result with the market forecast. A positive payroll number is not automatically strong if it misses expectations, while a smaller increase may still be interpreted positively if it exceeds the forecast.
6. Assess Fed Policy and Market Positioning: Consider whether the report changes expectations for Federal Reserve policy and whether traders were already positioned for a strong or weak result. Crowded positioning can contribute to sharp reversals when supporting data conflict with the headline.
For example, NFP may rise by 180,000 against a forecast of 150,000, but the US dollar could still fall if previous figures are revised lower, unemployment rises, and wage growth misses expectations. Traders should therefore examine the complete report and wait to see whether the initial market reaction is confirmed before making a trading decision.
How to Build Strategies Before and After an NFP Release
NFP is one of the most volatile economic events of the month, so having a plan before the data is released is often more important than reacting afterward. Here are some practical steps traders can follow.
Before the NFP Release
1. Know when the data will be released. Check the economic calendar several days in advance and note the release time, market consensus, and previous month's figures. Understanding what the market expects helps you judge whether the actual result is a positive or negative surprise.
2. Identify key price levels. Mark important support and resistance levels, recent highs and lows, and major moving averages before the announcement. These levels often become areas where price either breaks out or reverses after the data is released.
3. Prepare multiple scenarios. Instead of predicting one outcome, consider different possibilities.
For example:
If payroll growth is much stronger than expected and wage growth accelerates, the US dollar may strengthen while gold comes under pressure.
If payroll growth disappoints and unemployment rises, expectations for Federal Reserve rate cuts may increase, potentially weighing on the dollar and supporting gold and equities.
If the data is mixed, expect increased volatility and possible price whipsaws.
4. Planning these scenarios in advance can help reduce emotional decision-making.
5. Reduce risk before the announcement. Many traders lower their position size or avoid opening new positions immediately before the release because spreads may widen and price can move sharply within seconds.
After the NFP Release
1. Don't trade the headline number alone. Compare the headline payroll figure with unemployment, average hourly earnings, labor force participation, average weekly hours, and revisions to previous months. A strong payroll number accompanied by weaker wage growth or large downward revisions may not support a sustained market move.
2. Wait for the market's initial reaction. The first few minutes after the release are often driven by algorithms and short-term traders. Waiting for volatility to settle can help avoid false breakouts.
3. Look for confirmation. If price breaks above resistance or below support, confirm the move with strong trading volume, follow-through price action, or confirmation from technical indicators before entering a trade.
4. Review and learn. After the event, compare your pre-release scenarios with what actually happened. Keeping a trading journal can help identify patterns and improve future NFP trading decisions.
Conclusion
NFP can strongly influence the US dollar, gold, bonds, stocks and cryptocurrencies by changing expectations for the US economy and Federal Reserve policy. Traders should assess the headline result together with unemployment, wages, participation, hours, sector data and revisions before deciding whether the market move is likely to continue.
Because markets often become highly volatile around NFP releases, preparation is just as important as analysis. Checking Mitrade's Economic Calendar before key data releases can help you stay informed about upcoming events and market expectations, while practicing with a Demo Account gives you the opportunity to build confidence without risking real capital.
Risk-Free Demo Account
CMA-regulated | 24х5 | T+0 | low spreads. Enjoy limit and stop loss for every trade!
Is the Unemployment Rate Included in the NFP Calculation?
No. The headline NFP figure is calculated from the Establishment Survey, while the unemployment rate comes from the separate Household Survey. It provides useful context but is not part of the NFP calculation.
What Are the Core Indicators Included in the NFP Report?
The broader US Jobs Report includes nonfarm payrolls, unemployment, average hourly earnings, labor-force participation, weekly hours, industry employment and payroll revisions. Together, they provide a fuller view of labor-market conditions.
Why Can the Unemployment Rate Rise Even When NFP Increases?
NFP counts payroll jobs, while the unemployment rate measures unemployed people as a share of the labor force. The rate can rise when more people begin looking for work faster than employment increases.
* The content presented above, whether from a third party or not, is considered as general advice only. This article should not be construed as containing investment advice, investment recommendations, an offer of or solicitation for any transactions in financial instruments.


