


Ripple Price Forecast: XRP loses $1.50 as profit-taking outweighs ETF inflows
- XRP logs three consecutive days of declines, trimming last week's gains, and trades below $1.50.
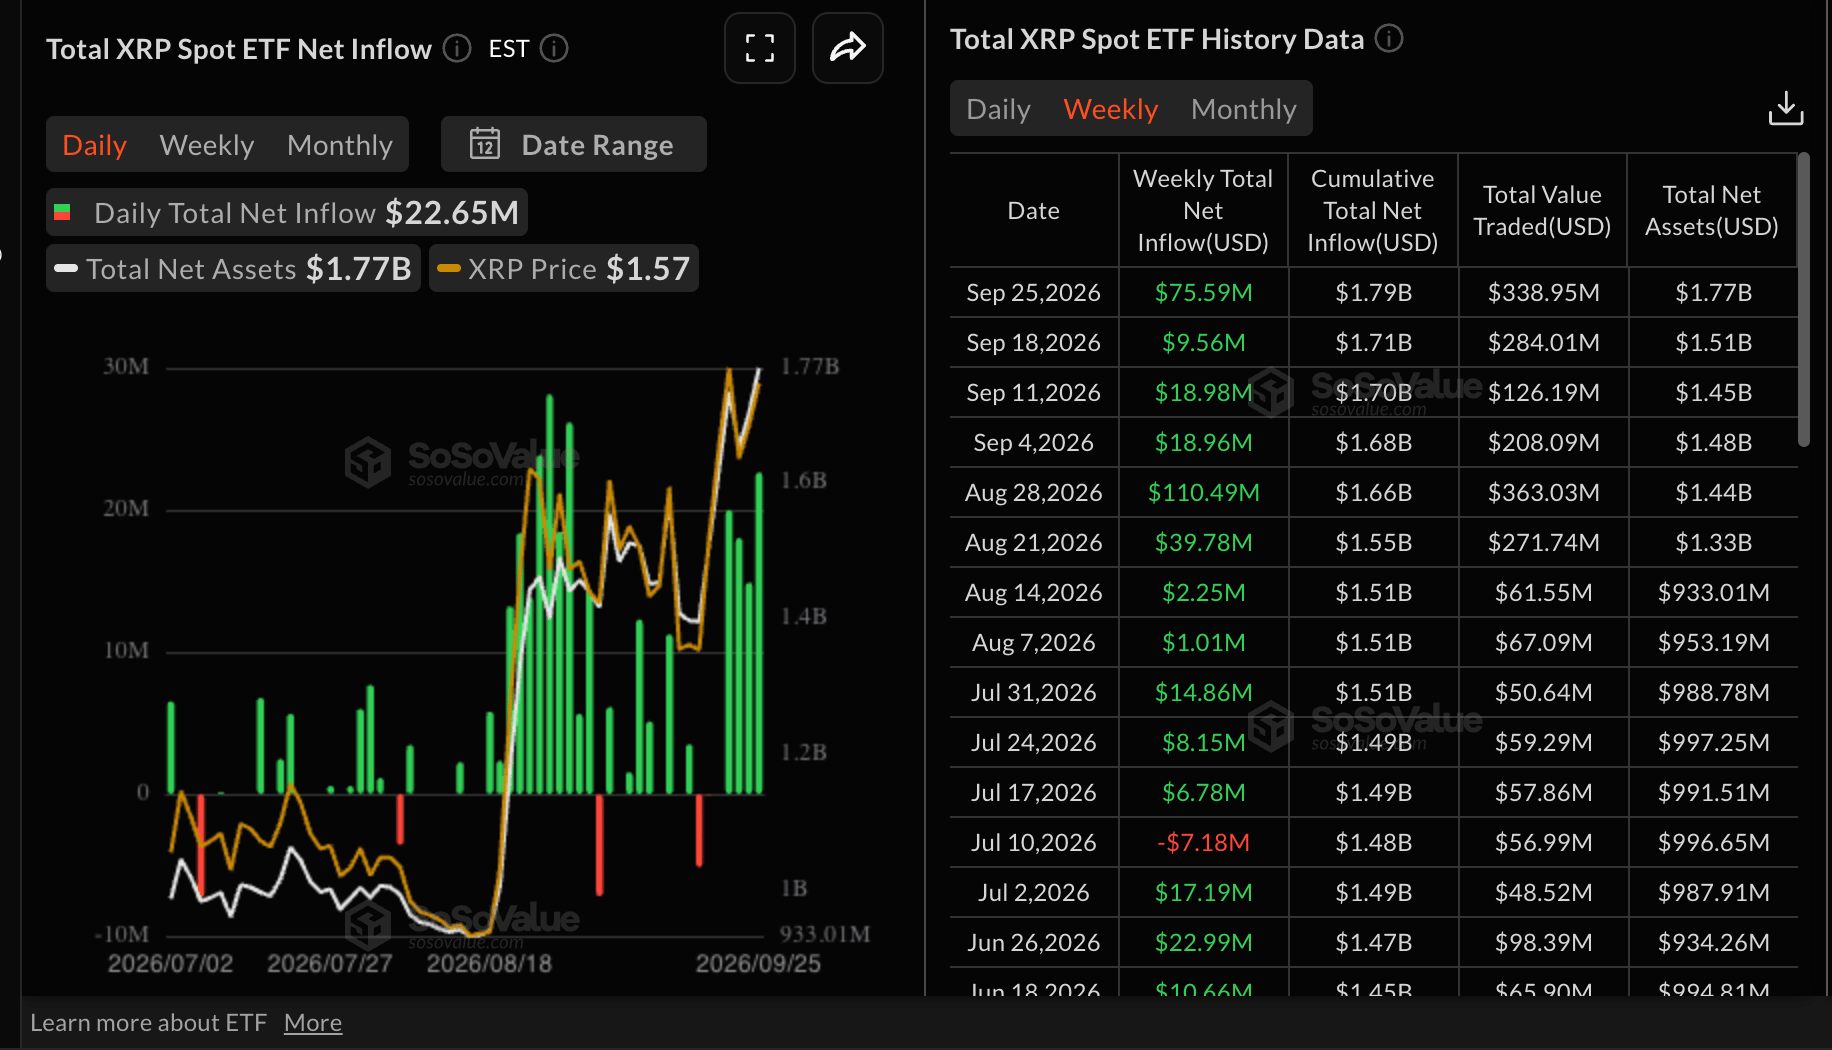
- US-listed spot XRP ETFs record rising inflows, amounting to $76 million last week, but fail to cushion profit-taking headwinds.
- Momentum indicators extend weakness, with the RSI sliding toward bearish territory and the MACD hinting at a sell signal.
Ripple’s (XRP) momentum continues to weaken below $1.50 on Monday as sellers return against the backdrop of last week’s sharp breakout to highs around $1.66. Despite the remittance token falling for three consecutive days, the broader scope shows a firm technical structure, underpinned by a moving-average support cluster.
The decline may be attributed to profit-taking in the broader crypto market, as majors Bitcoin (BTC) and Ethereum (ETH) slid below $83,000 and $2,650, respectively. Moreover, buyer exhaustion may have kicked in after XRP failed to extend the uptrend beyond $1.66. The area at $1.50 is worth watching in upcoming sessions as it may determine the direction XRP takes going forward.
XRP ETFs draw steady inflows
US-listed XRP spot Exchange-Traded Funds (ETFs) extended their inflow streak for the 11th consecutive week, drawing $76 million through Friday. More broadly, that's a notable improvement from the previous week’s $10 million.
Meanwhile, cumulative inflows stand at $1.8 billion, with net assets under management at the same $1.8 billion level, according to SoSoValue. Steady inflows into XRP ETFs help to cushion against headwinds while keeping the bullish outlook grounded.
Technical Analysis: XRP sellers push to take control of trend
XRP trades below $1.50, marking a 10% correction from last week's high of $1.66. Despite sellers tightening their grip, the pair is extending its advance above a dense layer of underlying moving-average support and maintaining a constructive short-term bullish bias.
Momentum remains supportive as the MACD indicator holds marginally above the zero line with a modest positive profile and the RSI prints near 56, hinting at sustained but not overstretched buying pressure.
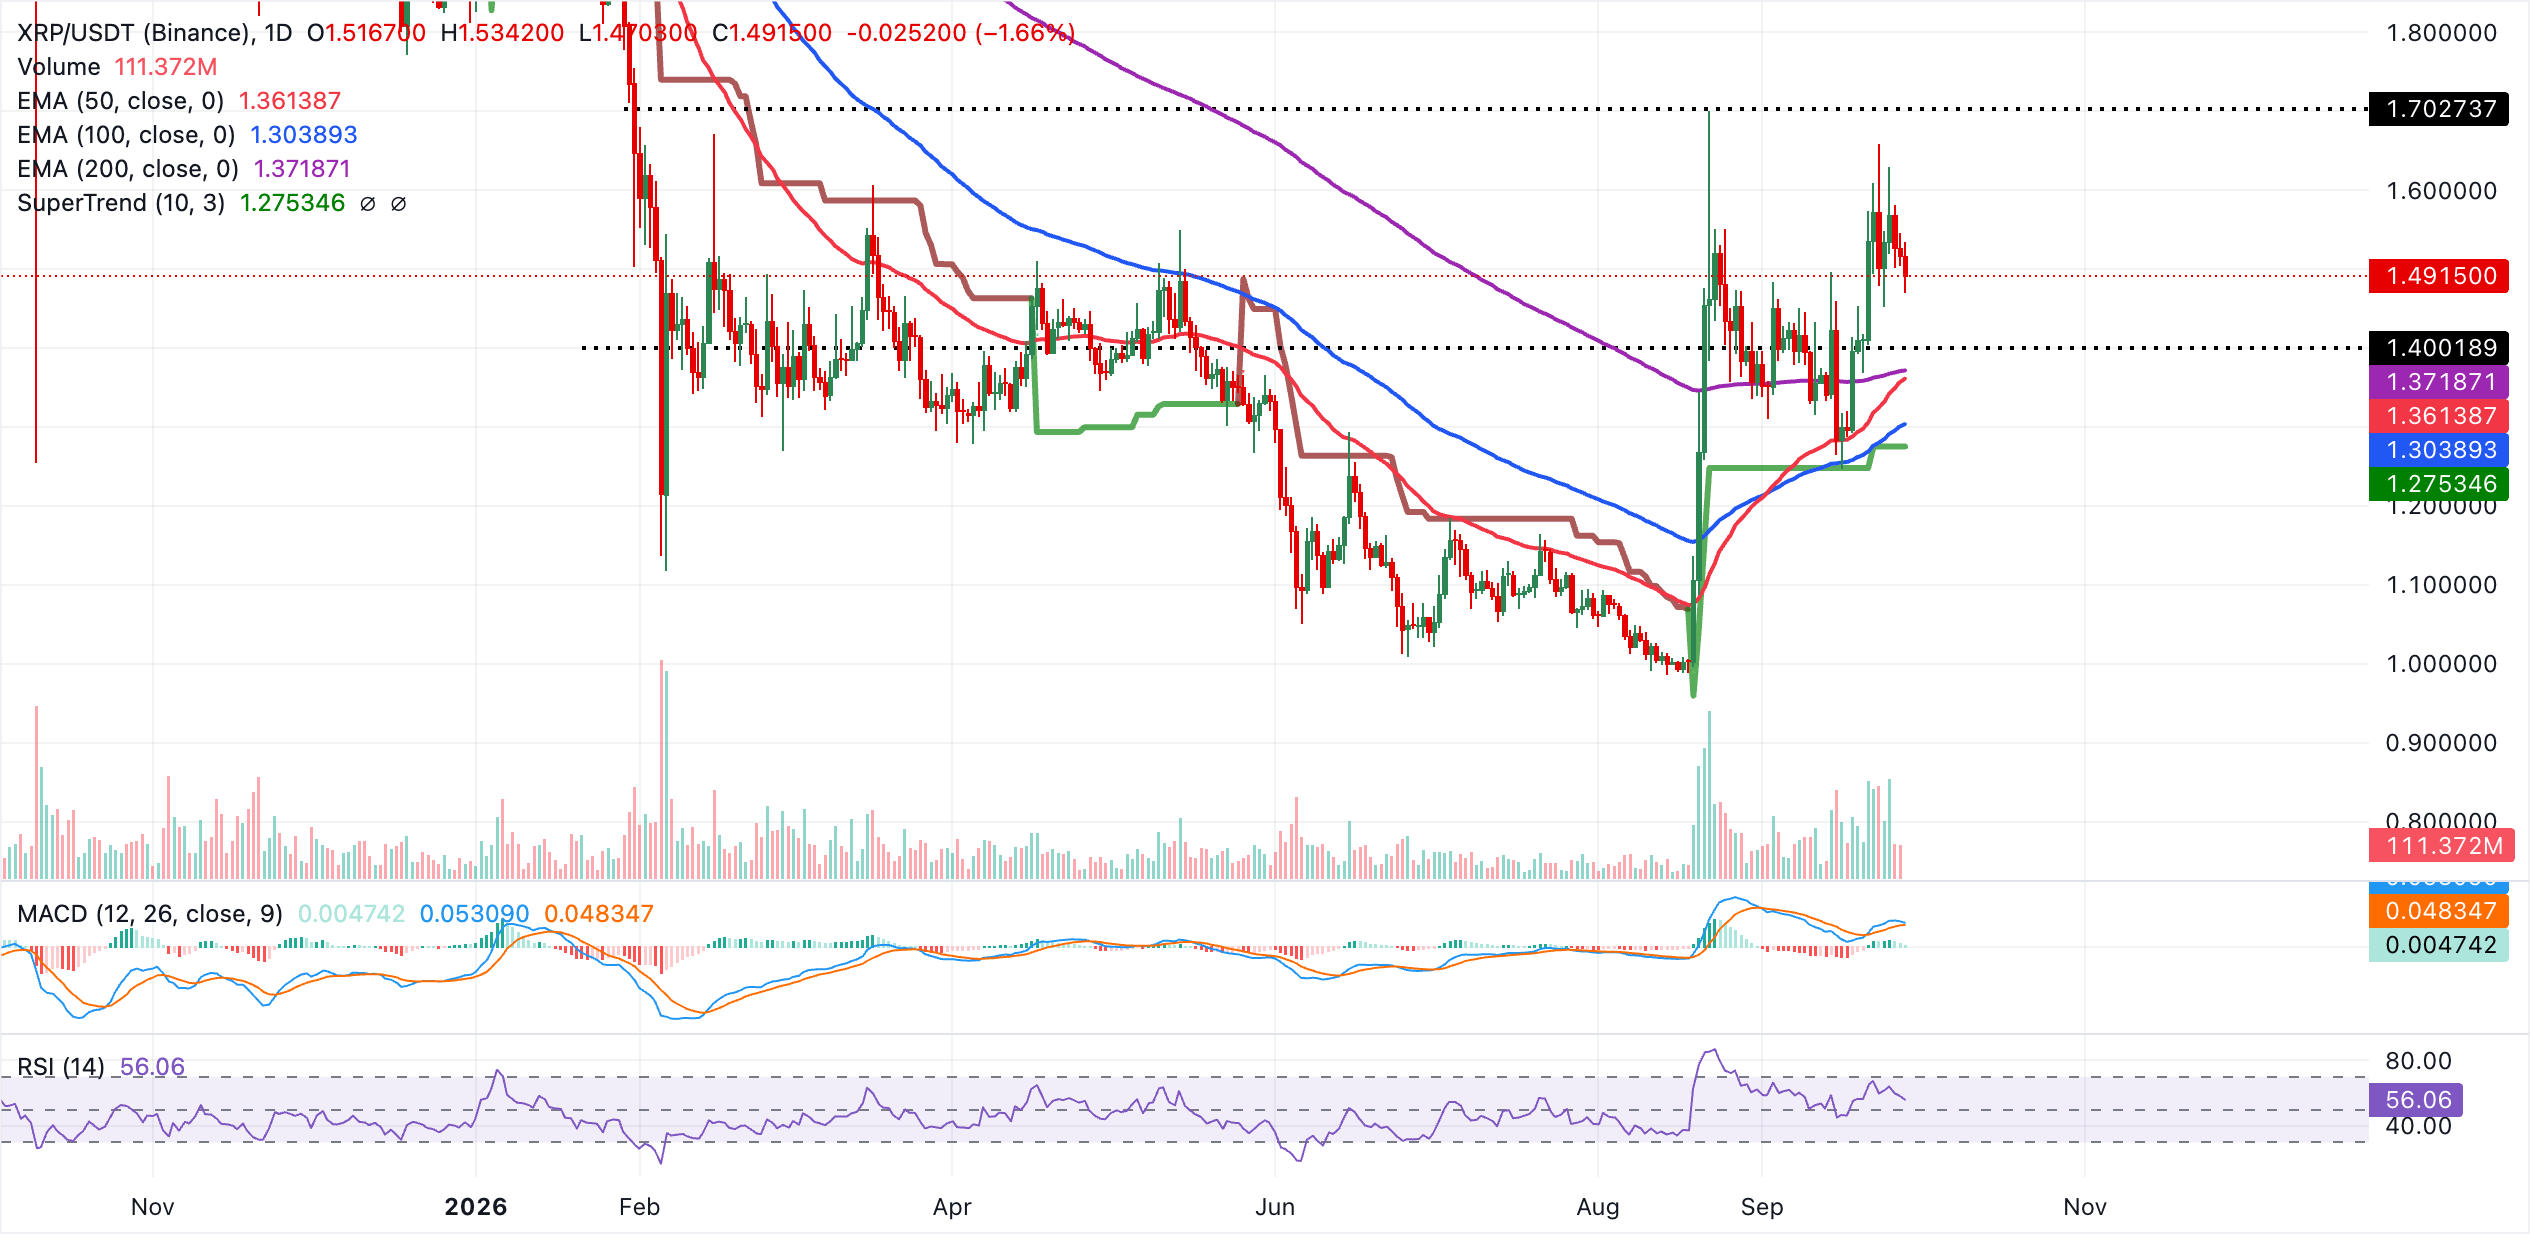
Initial support lies at the 200-day EMA near $1.37, closely followed by the 50-day EMA at $1.36, forming the primary corrective floor should the pair unwind part of its recent gains. Below these levels, the 100-day EMA at $1.30 and the SuperTrend line at $1.28 mark deeper support zones that should attract dip-buying interest while the broader bullish structure remains intact.
On the higher weekly timeframe, XRP is consolidating between its longer-term EMAs. Price holds above the 200-week EMA at $1.37, which suggests underlying trend support, but remains capped beneath the 50-week EMA at $1.52 and the 100-week EMA at $1.58, keeping the broader bias neutral for now.
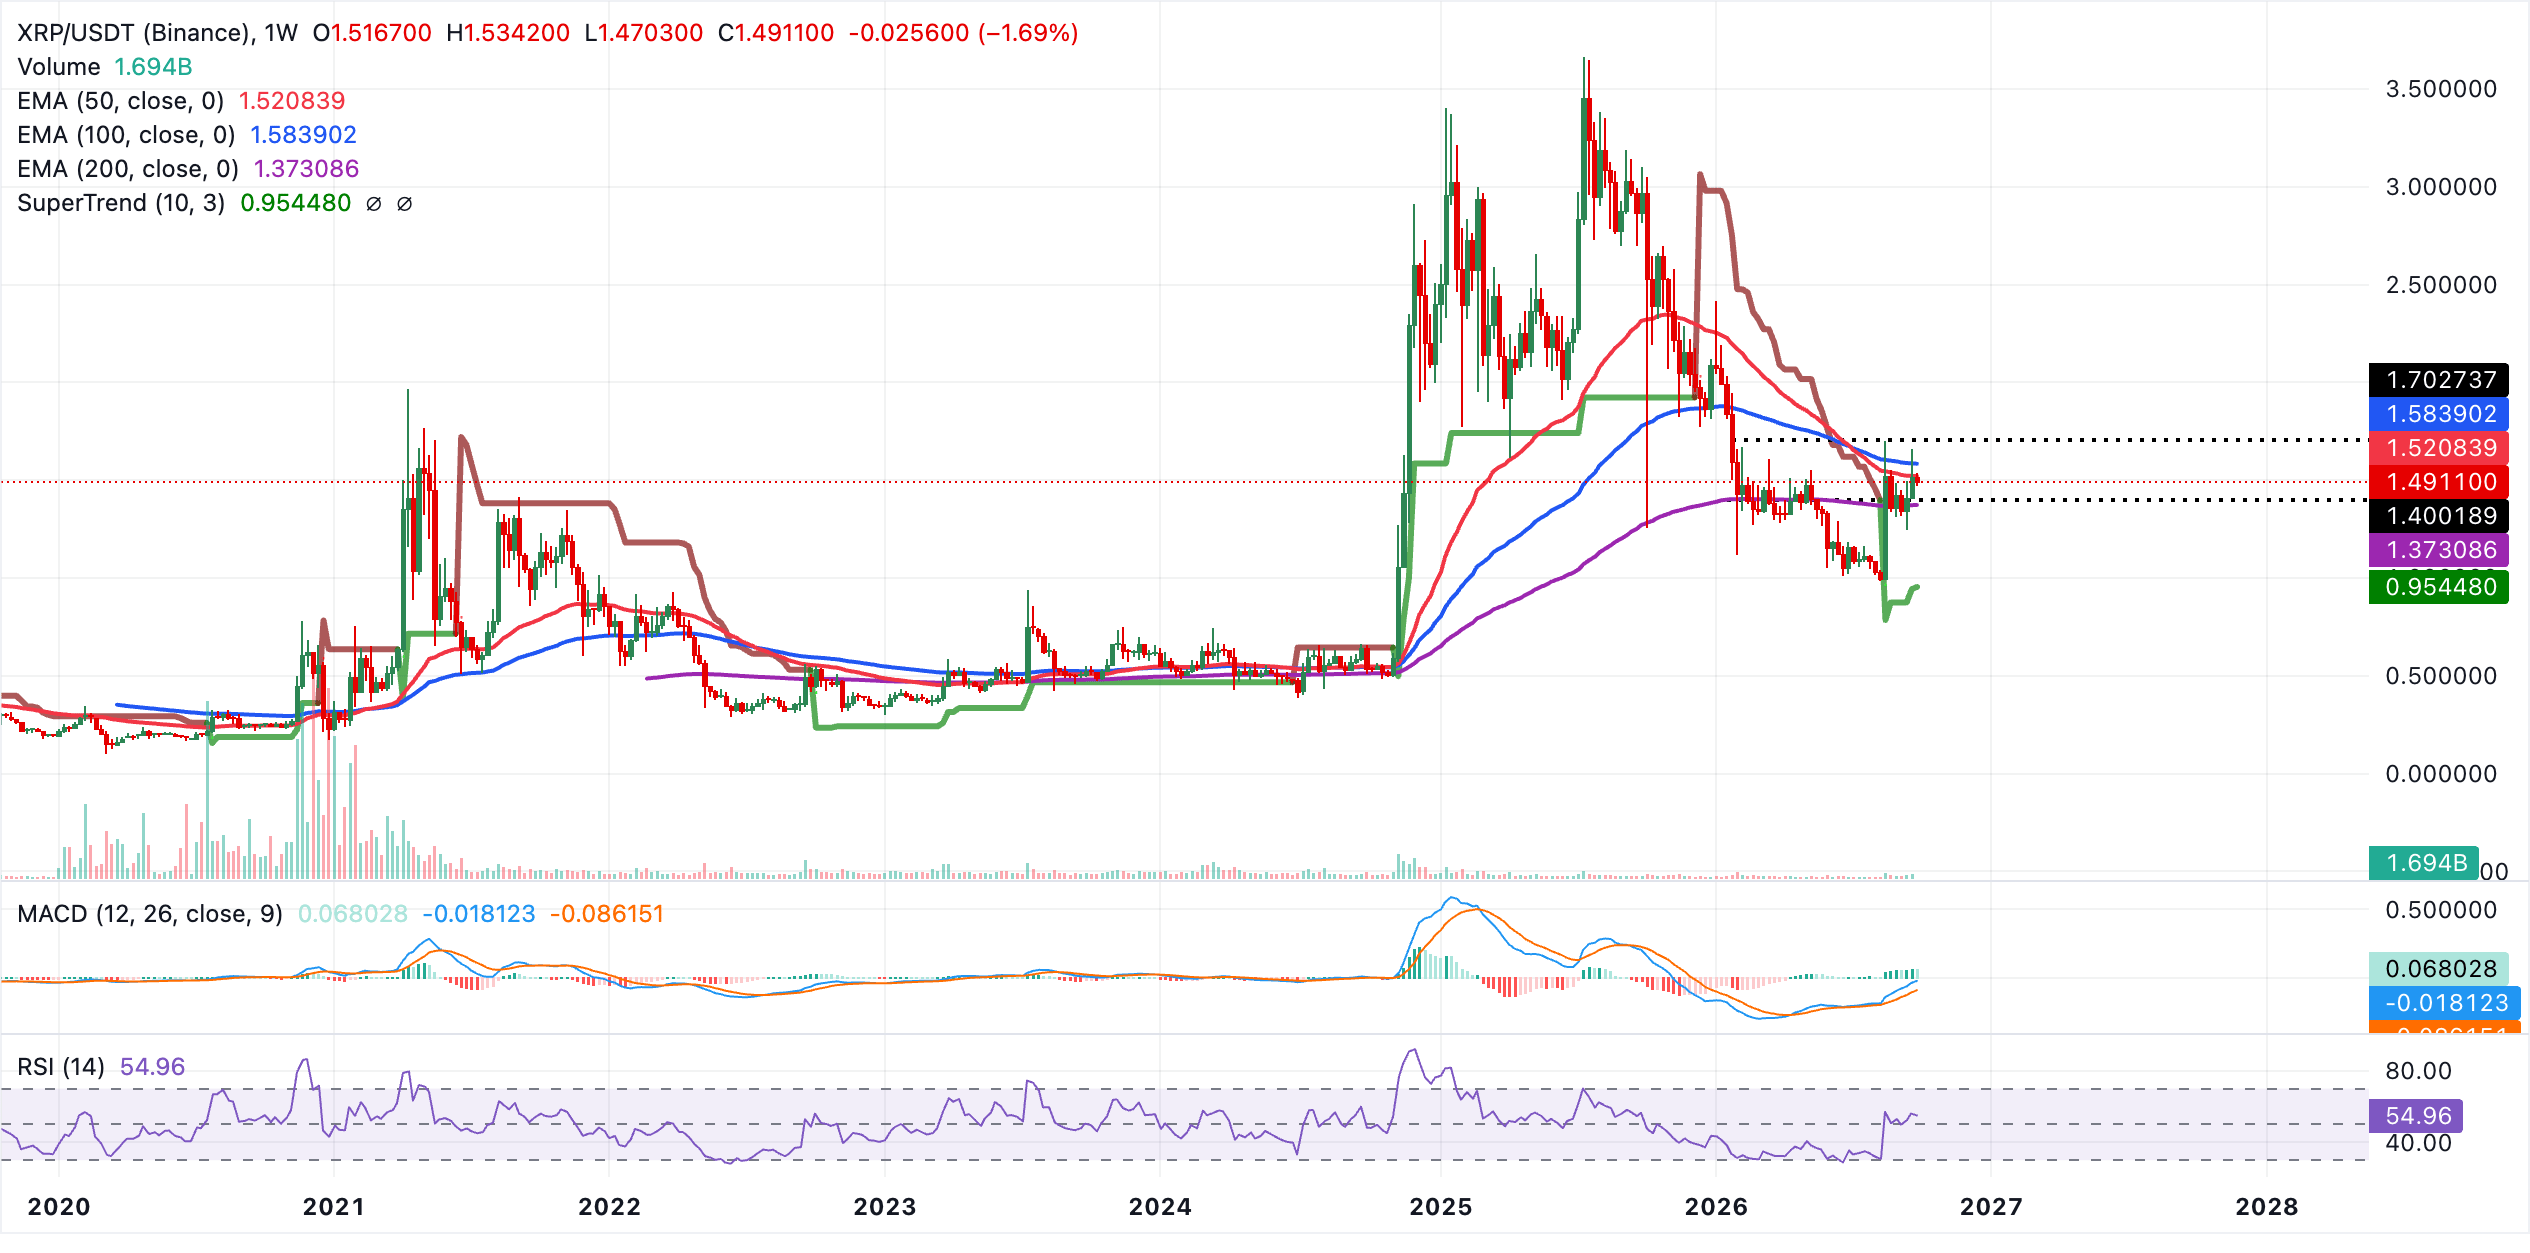
On the topside, initial resistance aligns with the 50-week EMA at $1.52, followed by the denser barrier at the 100-week EMA around $1.58. A sustained weekly close above these clustered moving averages would be needed to shift the outlook toward a more convincingly bullish stance.
(The technical analysis of this story was written with the help of an AI tool. Know more.)
Crypto ETF FAQs
An Exchange-Traded Fund (ETF) is an investment vehicle or an index that tracks the price of an underlying asset. ETFs can not only track a single asset, but a group of assets and sectors. For example, a Bitcoin ETF tracks Bitcoin’s price. ETF is a tool used by investors to gain exposure to a certain asset.
Yes. The first Bitcoin futures ETF in the US was approved by the US Securities & Exchange Commission in October 2021. A total of seven Bitcoin futures ETFs have been approved, with more than 20 still waiting for the regulator’s permission. The SEC says that the cryptocurrency industry is new and subject to manipulation, which is why it has been delaying crypto-related futures ETFs for the last few years.
Yes. The SEC approved in January 2024 the listing and trading of several Bitcoin spot Exchange-Traded Funds, opening the door to institutional capital and mainstream investors to trade the main crypto currency. The decision was hailed by the industry as a game changer.
The main advantage of crypto ETFs is the possibility of gaining exposure to a cryptocurrency without ownership, reducing the risk and cost of holding the asset. Other pros are a lower learning curve and higher security for investors since ETFs take charge of securing the underlying asset holdings. As for the main drawbacks, the main one is that as an investor you can’t have direct ownership of the asset, or, as they say in crypto, “not your keys, not your coins.” Other disadvantages are higher costs associated with holding crypto since ETFs charge fees for active management. Finally, even though investing in ETFs reduces the risk of holding an asset, price swings in the underlying cryptocurrency are likely to be reflected in the investment vehicle too.
Recommended Articles


