



Trading chart patterns help traders organize price action into recognizable formations. They can signal a possible reversal, continuation, or breakout and help plan entries and exits, but the visible shape alone is never enough to justify a trade.
Chart patterns can be useful, but how can traders use them effectively?
This guide explains the most important and useful trading chart patterns, how to identify and trade them, and the confirmation signals that help filter weak signals and reveal stronger setups.
What Are Trading Chart Patterns?
Trading chart patterns are formations created by price over several candles. Traders use them in technical analysis to identify changes in buying and selling pressure, and to identify trading opportunities.
Unlike candlestick patterns, which may use one or two candles, chart patterns develop through several price swings. Common examples include triangles, flags, wedges, and Head and Shoulders.
Most chart patterns are commonly grouped into two main categories:
Reversal patterns: Suggest that the current trend may be losing strength and preparing to change direction.
Continuation patterns: Show a temporary pause before price potentially continues in its previous direction.
Some patterns can act as either type depending on the previous trend and breakout direction. Confirmation requires a close beyond the neckline or boundary, with higher-timeframe signals usually carrying more weight.
What Charts Can Trading Chart Patterns Be Used On?
Trading chart patterns can be identified on candlestick, bar, and line charts. Candlestick charts are most commonly used because they show the open, high, low, and close, making candle closes, wicks, and breakouts easier to evaluate.
Candlestick charts: Provide the clearest breakout and candle-close confirmation.
Bar charts: Display the same price information as candlesticks but use a different design.
Line charts: Make the overall pattern shape easier to see but provide less detail because they usually connect closing prices.
Chart patterns can be used across forex, stocks, indices, and commodities on any timeframe. Higher-timeframe charts usually represent more trading activity and may produce clearer formations.
10 Trading Chart Patterns: Bullish and Bearish Versions, Shapes, Entries, Stop losses and Take-Profits
Many chart patterns appear across financial markets, but some provide more reliable trading opportunities than others. Below, we explain 10 of the most common and useful patterns, how to identify and trade them correctly, and when they act as continuation or reversal patterns.
1 Double Top and Double Bottom Patterns
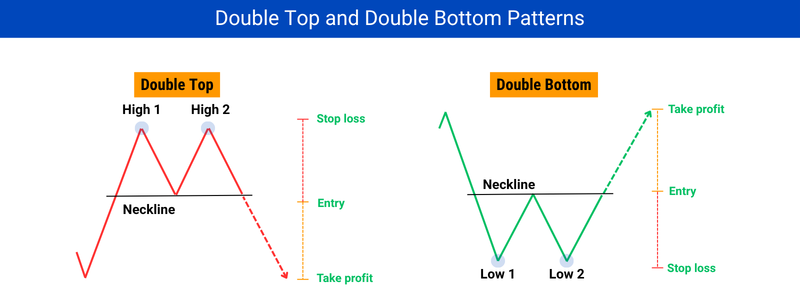
A Double Top forms after an upward move. Price creates a high, pulls back to form the neckline, and then rises to create a second equal or relative equal high. A close below the neckline indicates growing selling pressure and may offer a selling opportunity.
A Double Bottom is the bullish opposite. Price creates a low, rebounds to form the neckline, and then creates a second equal or relative equal low. A close above the neckline indicates growing buying pressure and may offer a buying opportunity.
🔹Entry: Enter after a candle closes beyond the neckline or after price retests the broken neckline.
🔹Stop loss: Place it above the highest top for a Double Top or below the lowest bottom for a Double Bottom.
🔹Take profit: Measure vertically from the neckline to the highest top or lowest bottom, then project that distance from the breakout entry.
Until a candle breaks and closes beyond the neckline, the pattern remains incomplete and may produce another test.
2 Triple Top and Triple Bottom Patterns
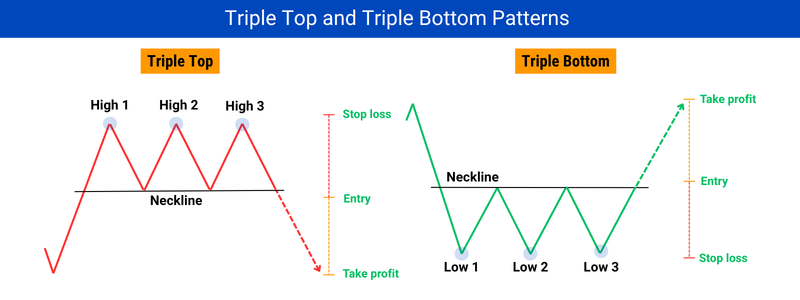
A Triple Top is similar to a Double Top, but price creates three equal or relative equal highs instead of two. The two pullback lows are connected to form the neckline; a close below it indicates selling pressure and may offer a selling opportunity.
A Triple Bottom follows the opposite structure, with three equal or relative equal lows. The two rebound highs form the neckline; a close above it indicates buying pressure and may offer a buying opportunity.
🔹Entry: Enter after a candle closes beyond the neckline or after price retests the broken neckline.
🔹Stop loss: Place it above the highest top for a Triple Top or below the lowest bottom for a Triple Bottom.
🔹Take profit: Measure vertically from the neckline to the highest top or lowest bottom, then project that distance from the breakout entry.
The three highs or lows do not need to form at exactly the same price, but they should remain equal or relatively equal.
3 Head and Shoulders Patterns
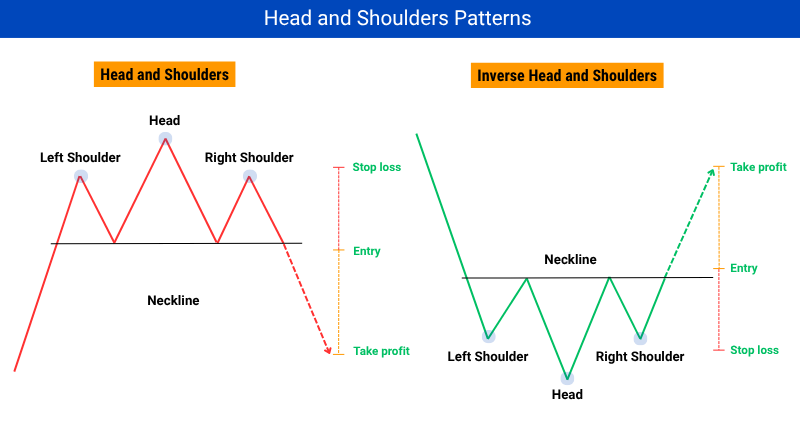
A Head and Shoulders pattern has three highs and a neckline. Price creates a left shoulder, a higher head, and a right shoulder that forms an equal or relative equal high to the left shoulder. The pullback lows form the neckline.
The inverse version follows the opposite structure: a left shoulder low, a lower head, and a right shoulder forming an equal or relative equal low to the left.
A close below the neckline indicates a possible selling opportunity, while a close above it for the inverse version indicates a possible buying opportunity.
🔹Entry: Enter after price closes beyond the neckline or retests it from the broken side.
🔹Stop loss: Place it beyond the right shoulder, which is the latest relevant swing within the pattern.
🔹Take profit: Measure vertically from the head to the neckline and project that distance from the breakout entry.
With a sloping neckline, measure from the head to the point directly above or below it on the neckline.
4 Ascending and Descending Triangle Patterns
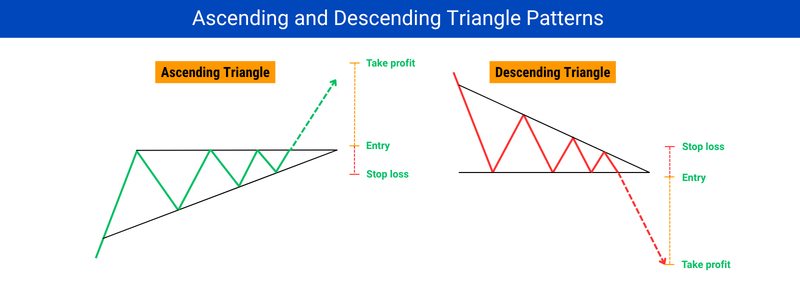
An Ascending Triangle has a horizontal upper boundary connecting the highs, while its lower boundary rises with the higher lows. A close above the upper boundary indicates stronger buying pressure and increases the probability of an upward continuation.
A Descending Triangle follows the opposite structure. Its upper boundary falls with the lower highs, while its lower boundary remains horizontal. A close below the lower boundary indicates stronger selling pressure and increases the probability of a downward continuation.
🔹Entry: For an Ascending Triangle, enter after a candle closes above the upper boundary. For a Descending Triangle, enter after a close below the lower boundary.
🔹Stop loss: Place it below the latest low for a buying setup or above the latest high for a selling setup.
🔹Take profit: Measure the widest vertical distance between both boundaries and project it from the breakout entry.
A wick beyond the boundary is not enough; wait for the candle to close before considering the breakout confirmed.
5 Symmetrical Triangle Patterns
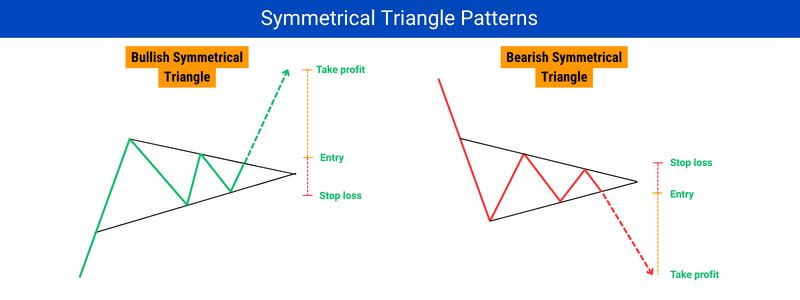
A Symmetrical Triangle forms when price moves between two converging boundaries. The upper boundary slopes downward, while the lower boundary slopes upward, gradually reducing the distance between them.
The pattern remains neutral until price breaks a boundary. A close above the upper boundary indicates buying pressure and may offer a buying opportunity, while a close below the lower boundary indicates selling pressure and may offer a selling opportunity.
🔹Entry: Enter after a candle closes above the upper boundary for a bullish setup or below the lower boundary for a bearish setup.
🔹Stop loss: Place it below the latest low for a buying setup or above the latest high for a selling setup.
🔹Take profit: Measure the triangle’s widest vertical distance and project it from the breakout entry.
When the triangle follows an upward or downward move and breaks in the same direction, it may act as a continuation pattern.
6 Rectangle Patterns
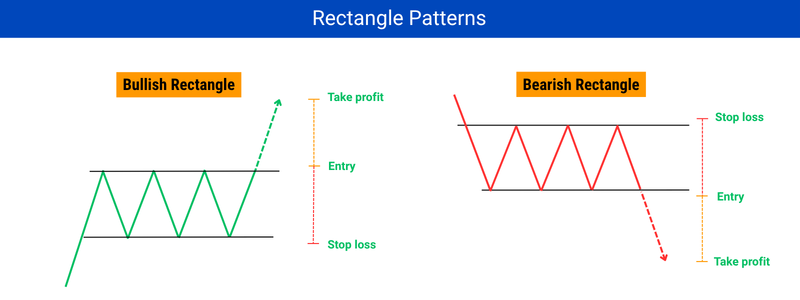
A Bullish Rectangle forms when price pauses after an upward move and moves between horizontal support and resistance. A close above resistance indicates renewed buying pressure and increases the probability of an upward continuation.
A Bearish Rectangle has the same shape, but it forms after a downward move. A close below support indicates renewed selling pressure and increases the probability of a downward continuation.
🔹Entry: Enter after a candle closes beyond the relevant horizontal boundary or after price retests it.
🔹Stop loss: Place it beyond the latest swing on the opposite side of the rectangle.
🔹Take profit: Measure the rectangle’s vertical height and project it from the breakout entry.
The rectangle remains incomplete while price is still moving between support and resistance.
7 Flag Patterns
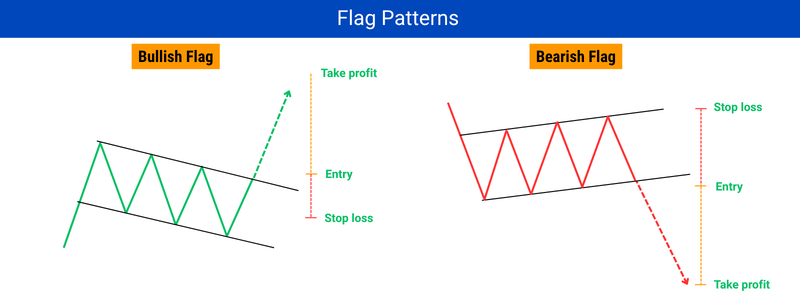
A Bull Flag is similar to a Bullish Rectangle, but its parallel boundaries slope downward instead of remaining horizontal. It forms after a strong upward flagpole, and a close above the upper boundary indicates that buying pressure may be returning.
A Bear Flag is the bearish opposite. It forms after a strong downward flagpole, followed by price rising between two parallel boundaries. A close below the lower boundary indicates that selling pressure may be returning.
🔹Entry: Enter after a candle closes beyond the flag boundary in the direction of the previous move or after a successful retest.
🔹Stop loss: Place it beyond the latest swing on the opposite side of the flag.
🔹Take profit: Use the largest internal price leg for TP1 and project the flagpole from the breakout entry for the final target.
The flag should remain smaller and move more slowly than the flagpole. If the pullback removes most of the first move, the continuation setup becomes weaker.
8 Rising and Falling Wedge Patterns (Continuation)
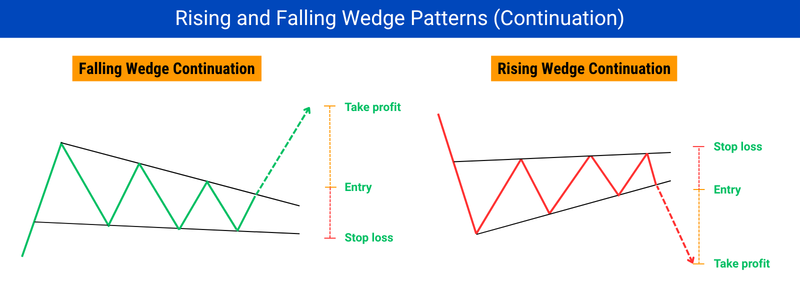
A Falling Wedge continuation forms during an upward move. Price pulls back between two descending boundaries that gradually converge, with the upper boundary falling faster. A close above the upper boundary indicates buying strength and suggests that the upward move may continue.
A Rising Wedge continuation forms during a downward move. Price rebounds between two ascending boundaries that gradually converge, with the lower boundary rising faster. A close below the lower boundary indicates selling strength and suggests that the downward move may continue.
🔹Entry: For a Falling Wedge, enter after a candle closes above the upper boundary. For a Rising Wedge, enter after a close below the lower boundary.
🔹Stop loss: Place it below the latest low for a Falling Wedge or above the latest high for a Rising Wedge.
🔹Take profit: Measure the widest vertical distance between both boundaries and project it from the breakout entry. The first price leg may provide an extended target.
Both boundaries must slope in the same direction and gradually converge. If they slope in opposite directions, the formation is a triangle.
9 Rising and Falling Wedge Patterns (Reversal)
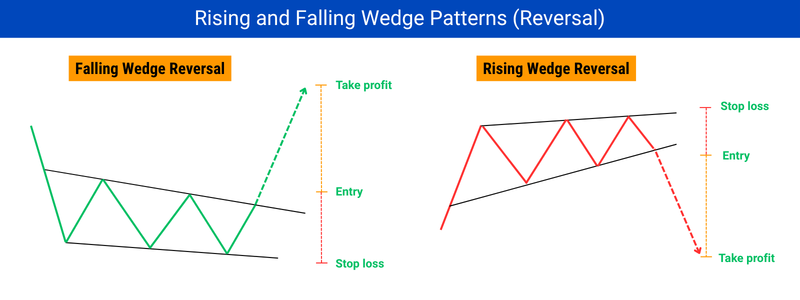
A Falling Wedge reversal forms after a downward move. Both boundaries continue sloping downward and converge, but a close above the upper boundary indicates that buyers are gaining strength and increases the probability of a bullish reversal.
A Rising Wedge reversal forms after an upward move. Both boundaries slope upward and converge, but a close below the lower boundary indicates growing selling pressure and increases the probability of a bearish reversal.
🔹Entry: For a Falling Wedge, enter after a candle closes above the upper boundary. For a Rising Wedge, enter after a close below the lower boundary.
🔹Stop loss: Place it below the latest low for a Falling Wedge or above the latest high for a Rising Wedge.
🔹Take profit: Use the nearest recent high or low for TP1. For the final target, measure the widest vertical distance between both boundaries and project it from the breakout entry.
The previous price direction determines whether the wedge acts as a continuation or reversal pattern. A higher-quality reversal wedge usually forms near a major level or important area, where it may provide a stronger reversal signal.
10 Cup and Handle Patterns
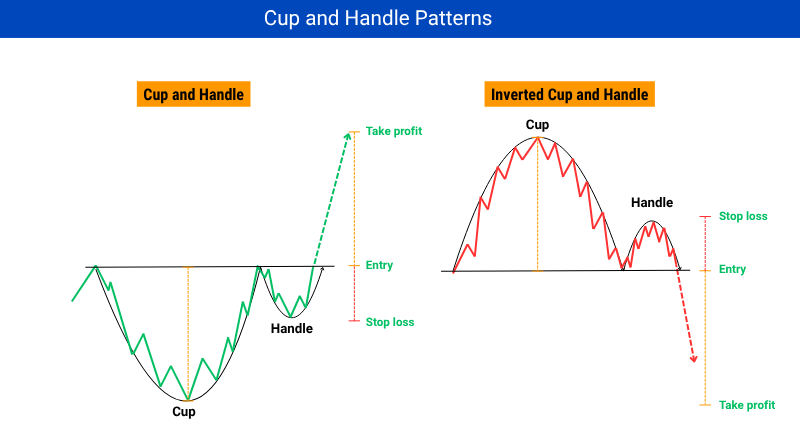
A Cup and Handle forms when price creates a rounded bottom, returns to its previous high, and then makes a smaller pullback called the handle. A close above the breakout line indicates buying strength and may offer a buying opportunity.
The Inverted Cup and Handle follows the opposite structure. Price creates a rounded top and then forms a smaller upward handle. A close below the breakout line indicates selling strength and may offer a selling opportunity.
🔹Entry: Enter after a candle closes above the breakout line for a Cup and Handle or below it for the inverted version.
🔹Stop loss: Place it below the handle low for a buying setup or above the handle high for a selling setup.
🔹Take profit: Measure vertically from the cup’s lowest or highest point to the breakout line, then project that distance from the entry.
The handle should remain smaller than the cup. If it moves too far back into the cup, the setup becomes weaker.
Examples of Trading Chart Patterns
Now, let’s look at real examples of trading chart patterns and some confirmations that can help identify stronger setups.
Example 1: A Breakout That Reached Its Planned Target
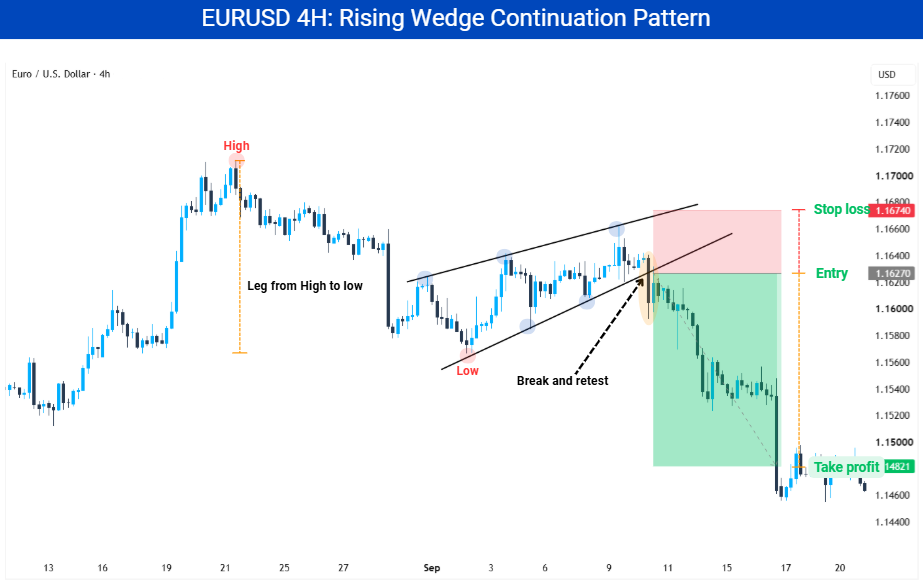
EURUSD was moving down before price started rising between two upward-sloping lines. These lines moved closer together, forming a Rising Wedge. Because it appeared after a downward move, it was a bearish continuation pattern.
🔸Confirmation: A large bearish candle closed below the lower boundary, confirming the wedge breakout and creating a selling opportunity.
🔸Entry: The short entry was placed after price retested and rejected the broken boundary.
🔸Stop loss: The Stop loss was placed above the latest wedge high, where the bearish setup would become invalid.
🔸Take profit: The target was calculated by measuring the previous bearish leg from high to low and projecting the same distance from the breakout entry. The trade delivered approximately 3R.
Example 2: A Confirmed Breakout That Failed
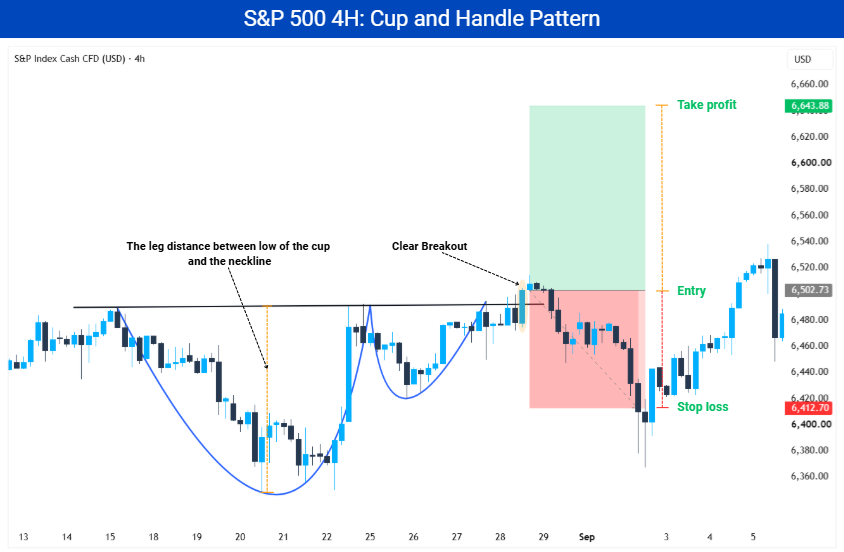
The S&P 500 formed a rounded cup as price declined and then recovered toward the previous high. A smaller pullback created the handle before price broke above the neckline.
🔸Confirmation: A large bullish candle closed above the neckline, confirming the breakout and indicating stronger buying pressure.
🔸Entry: The buying entry was placed after the bullish candle closed above the neckline.
🔸Stop loss: The Stop loss was placed below the handle’s lowest point.
🔸Take profit: The target was calculated by measuring vertically from the cup’s lowest point to the neckline and projecting the same distance upward from the entry.
There was nothing technically wrong with the setup. The pattern was clearly formed, and a large bullish candle confirmed the breakout. Even so, price failed to continue higher, dropped below the neckline, and reached the Stop loss.
This example reinforces the importance of risk management. Even a well-formed and confirmed trading setup can fail, so traders should always use a Stop loss and reduce their position size to keep losses under control.
Example 3: A Valid Pattern With an Unattractive Entry
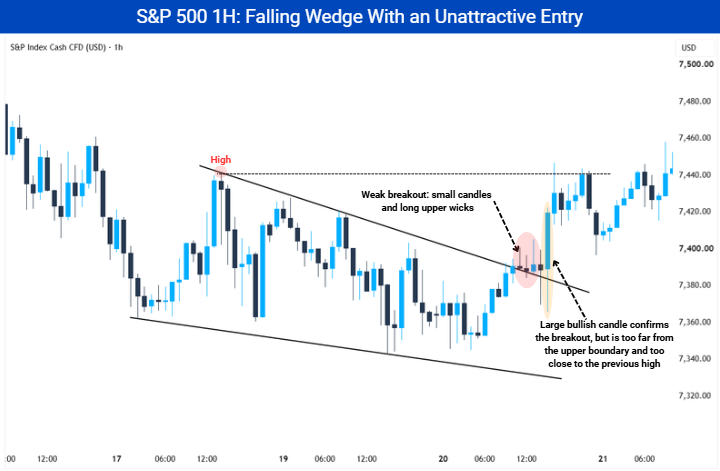
The S&P 500 formed a Falling Wedge between two descending boundaries that gradually moved closer together. Price moved above the upper boundary, but the first breakout candles showed weak buying pressure.
🔸Confirmation: The first breakout candles were small and had long upper wicks, showing that sellers were still pushing price back. A large bullish candle later provided stronger confirmation.
🔸Entry: No entry was taken because the large bullish candle closed too far from the upper boundary and too close to the previous high.
🔸Stop loss: A correctly placed Stop loss below the latest relevant low would have been too far from the potential entry.
🔸Take profit: The previous high limited the remaining profit potential, so the setup did not provide a positive risk-to-reward ratio.
The trade was avoided. This example shows why traders should remain patient, skip low-quality entries, and wait for setups with clearer confirmation and a positive risk-to-reward ratio.
How to Trade Chart Patterns Properly
Recognizing a chart pattern is only the first step. Traders also need confirmation, controlled risk, realistic targets, and clear rules before entering.
1. Wait Until the Pattern Is Fully Formed
Do not enter while the pattern is still developing. Wait until all required highs, lows, and boundaries have formed, followed by a candle close beyond the neckline or relevant boundary.
2. Confirm the Breakout
A breakout is confirmed when a candle breaks and closes beyond the required neckline or boundary. A wick outside the pattern is not valid confirmation because price may close back inside.
3. Place the Stop Beyond Invalidation
Place the Stop loss beyond the high, low, handle, or opposite boundary where the pattern becomes invalid. Keep it slightly wider to give price room to move, then reduce the position size if needed.
4. Apply a Strict Risk Management Plan
Risk no more than 1% to 2% of your capital on one trade because even a good setup can fail. A strict risk management plan protects the account during a series of losses.
5. Set Realistic Profit Targets
Use the measurement method explained for each pattern to calculate the final target. If an earlier high, low, support, or resistance comes first, use it as TP1.
6. Look for Setups With a Positive Risk-to-Reward Ratio
Risking $100 to potentially make $200 provides a 1:2 risk-to-reward ratio. If the Stop loss distance is greater than the take-profit distance, the reward is smaller than the risk, so skip the setup.
7. Use Additional Confirmations
RSI: Watch for oversold signals or bullish divergence before buying setups, and overbought signals or bearish divergence before selling setups.
Volume: Rising volume during the breakout shows stronger participation and can support the confirmation.
Candlestick patterns: Watch for large candles breaking and closing beyond the boundary, or rejection and engulfing patterns during a breakout retest.
Many indicators and confirmation methods are available. Backtest different combinations to identify which ones work best with your markets, timeframes, and trading rules.
8. Trade With the Overall Trend and Watch Market Conditions
Look for setups that follow the overall trend, as they may provide clearer opportunities. Avoid trading during high-impact news because sudden price moves can create false breakouts.
9. Backtest the Complete Rules
Backtest the exact pattern, confirmation, entry, Stop loss, and take-profit rules on a large sample. Track win rate, profitability, drawdown, risk-to-reward, and trading costs before risking real capital.
Final Thoughts
Trading chart patterns help traders understand price movements and make structured decisions. Wait for patterns to form, use clear confirmation, and follow the higher-timeframe direction. Beginners should backtest each pattern and build a strategy before trading live.
Before trading live, you can practice trading patterns with virtual funds through the Mitrade Demo Account. The Mitrade platform integrates TradingView charts, analysis tools, and multiple markets to watch and analyse.
From one platform, you can analyse markets, place trades, follow the latest news through the economic calendar, switch between demo and live accounts, and deposit funds.
Risk-Free Demo Account
CMA-regulated | 24х5 | T+0 | low spreads. Enjoy limit and stop loss for every trade!
What Is the Best Timeframe for Trading Chart Patterns?
No single timeframe is best for every trader. Four-hour and daily charts usually produce clearer patterns, while lower time frames provide more setups but may contain more noise and false breakouts.
Can Trading Chart Patterns Be Used in Different Markets?
Yes. Trading chart patterns can appear in forex, stocks, commodities, cryptocurrencies, and indices, but traders should test each pattern on the market and timeframe they plan to trade.
How Many Price Reactions Are Needed to Draw a Pattern?
At least two clear price reactions are needed to draw each boundary, while a third reaction can make it more reliable. Avoid forcing lines through unrelated highs or lows simply to create a pattern.
Which Chart Patterns Are Easiest for Beginners?
Rectangles, triangles, and Double Tops and Bottoms are generally easier to identify because they have clear boundaries and breakout points. Beginners can practice one or two patterns before studying more complex formations.
* The content presented above, whether from a third party or not, is considered as general advice only. This article should not be construed as containing investment advice, investment recommendations, an offer of or solicitation for any transactions in financial instruments.


