


The Hang Seng Index is a widely followed benchmark that tracks large and liquid companies listed in Hong Kong, including many major businesses closely linked to mainland China. Its movements can provide useful insight into Hong Kong market conditions and investor sentiment toward parts of the Chinese economy.
🎯This guide explains what the HSI tracks, how it is calculated, what affects its performance, and its main strengths and risks.
What Is the Hang Seng Index?
The Hang Seng Index, abbreviated as HSI, is a benchmark that tracks large and liquid companies listed on the Main Board of the Hong Kong Stock Exchange. It is widely used to measure the overall performance and sentiment of the Hong Kong stock market.
The HSI was launched in 1969 with 33 constituents and a base value of 100, backdated to July 31, 1964. It later adopted free-float-adjusted market-cap weighting, while reforms introduced in 2021 aimed to expand the index to 100 companies. By June 2026, it contained 93 constituents.
The HSI is sometimes called “Hong Kong’s Dow Jones” because both serve as widely followed flagship stock-market benchmarks. Investors also use it to assess sentiment toward Hong Kong and businesses closely connected to mainland China.
Why Do Investors Follow the Hang Seng Index?
Investors follow the Hang Seng Index because it is a leading benchmark for the Hong Kong stock market, one of Asia’s major financial centres. By tracking large and liquid Hong Kong-listed companies, it provides a quick view of broader market performance and investor sentiment.
✅Track the Hong Kong stock market: The HSI helps investors determine whether major Hong Kong-listed companies are generally rising, falling, or moving without a clear direction.
✅Follow influential companies and industries: The index includes major banks, technology platforms, insurers, consumer businesses, property companies, and telecommunications groups that play an important role in the regional market.
✅Gauge sentiment toward China-linked businesses: Many constituents have substantial exposure to mainland Chinese consumers, economic activity, property conditions, and government policy. The HSI can therefore reflect confidence toward parts of corporate China, although it does not measure China’s entire economy.
✅Compare market and portfolio performance: Investors and fund managers use the HSI as a benchmark when evaluating Hong Kong-focused portfolios, funds, and individual stocks.
✅Gain broad market exposure: Because the HSI includes many large companies across different industries, it offers a broader view of the Hong Kong market than following a single stock. However, it remains regionally and sector concentrated.
✅Understand reactions to major developments: Movements in the index can show how the market is responding to economic data, interest-rate decisions, Chinese policy announcements, company earnings, and geopolitical developments.
Hang Seng Index Historical Performance & Major Milestones
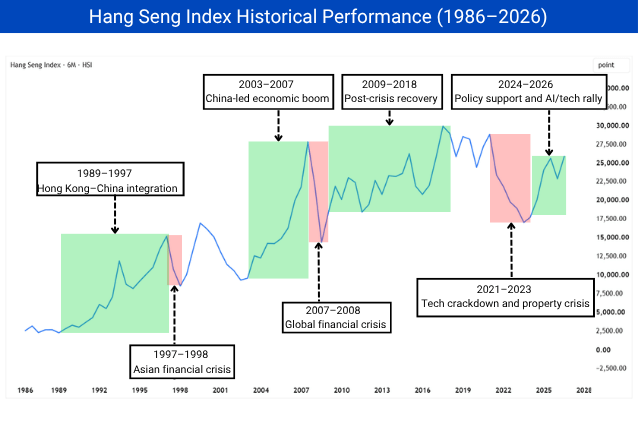
The HSI’s historical performance shows how the index moved through major crises, recoveries, and long-term market cycles. The chart below highlights its key milestones from 1986 to 2026.
Hang Seng Index historical performance from 1986 to 2026. Source: TradingView.
1997–1998 — Asian Financial Crisis: Regional currency turmoil, capital outflows, and pressure on the Hong Kong dollar caused severe volatility. The HSI fell to 6,660 points on August 13, 1998.
2003–2007 — Post-SARS recovery and China-led boom: Hong Kong recovered after SARS, while CEPA strengthened economic links with mainland China. Strong Chinese growth and rising demand for mainland-linked shares supported a major HSI rally.
2007–2008 — Global Financial Crisis: Banking failures, tighter credit conditions, and collapsing investor confidence drove the HSI sharply lower. It ended 2008 at approximately 14,387 points, nearly 48% below its 2007 close.
2018 — Historical high: Expanded cross-border access through Shanghai and Shenzhen Stock Connect supported the long recovery. The HSI reached its all-time intraday high of 33,484.08 points on January 29, 2018.
2021–2023 — Technology regulation and property downturn: China tightened antitrust, data-security, and personal-information rules affecting major technology platforms. At the same time, Evergrande’s debt crisis, wider developer defaults, weaker home sales, and slower economic growth damaged investor confidence and weighed heavily on the HSI.
2024–2026 — Policy-driven recovery: China cut reserve requirements and policy rates, lowered mortgage costs, and introduced stock-market liquidity and share-buyback facilities. These measures supported confidence, with the HSI at 22,881.02 points on June 30, 2026.
The Top 10 Constituent Stocks
Companies with larger index weights have a greater influence on the Hang Seng Index’s movements. The table below lists the 10 largest HSI constituents by weight as of June 30, 2026.
HSBC, Tencent, and Alibaba have a major influence on the HSI because the index is weighted by free-float-adjusted market capitalisation rather than equally. Together, they represented 23.74% of the index as of June 30, 2026. As a result, a large move in any of these three shares can affect the HSI much more than the same move in a smaller constituent.
Their influence is spread across three major sectors:
HSBC: 9.15% — Financials
Tencent: 8.13% — Information Technology
Alibaba: 6.46% — Consumer Discretionary
The HSI applies an 8% single-stock cap during quarterly reviews to limit concentration. However, weights can rise above this level between reviews as share prices change, which explains HSBC’s 9.15% weight.
What Sectors Does the Hang Seng Index Cover?
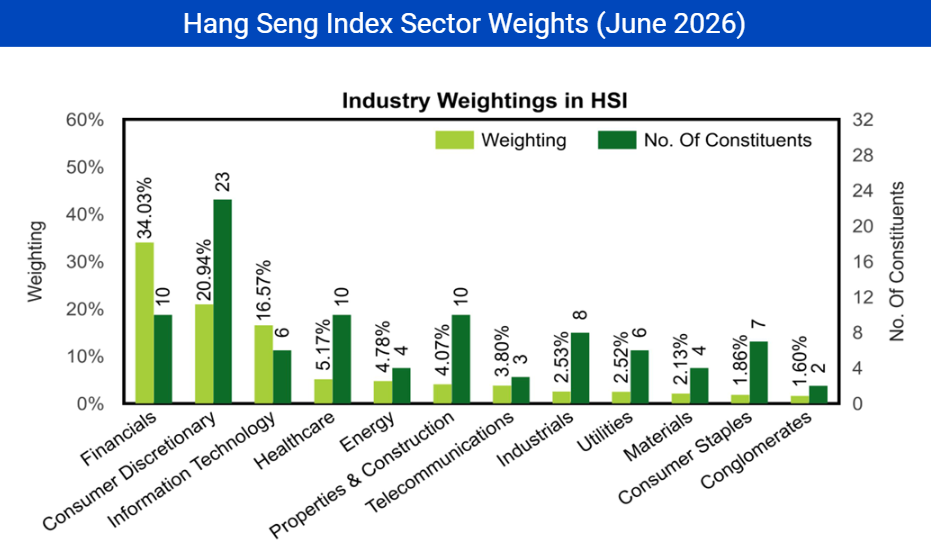
The HSI covers 12 industries, with each sector carrying a different weight in the index. The table below shows each sector’s weight as of June 30, 2026.
Financials represented more than one-third of the index on June 30, 2026. Consequently, interest rates, credit conditions, property stress, and banking profitability can strongly influence it.
The chart compares each sector’s weight with its number of constituents, highlighting which industries have the greatest influence on the HSI.
Hang Seng Index sector weights and number of constituents as of June 30, 2026, Source: Hang Seng Indexes Company Limited.
How to Calculate the Hang Seng Index?
The HSI methodology uses free-float-adjusted market capitalisation. A company’s influence depends on its share price, issued shares available for public trading, and the capping and adjustment factors applied by the index provider.
A simplified representation is:
Current HSI = Current adjusted market value ÷ Previous adjusted market value × Previous closing HSI
Free-float adjustment excludes strategic holdings that are not readily available for public trading. The capping factor limits excessive concentration, while the adjustment factor maintains index continuity when corporate actions change a company’s shares or market value.
Example ▼
Assume the previous adjusted market value is normalised to 100 units, the previous closing HSI is 22,881.02, and all other constituents remain unchanged. Tencent and HSBC carried weights of 8.13% and 9.15% as of June 30, 2026.
🔹Tencent rises 5%: 8.13 × 5% = +0.4065 units
🔹HSBC falls 1%: 9.15 × 1% = −0.0915 units
Current adjusted market value: 100 + 0.4065 − 0.0915 = 100.315 units
Applying the displayed formula:
🔹Current HSI = 100.315 ÷ 100 × 22,881.02
🔹Current HSI ≈ 22,953.10
The HSI would therefore rise by approximately 72.08 points, or 0.315%, because Tencent’s positive contribution would outweigh HSBC’s negative contribution.
What Factors Affect the Hang Seng Index?
1. Mainland China’s economy: Many HSI companies depend on mainland growth, consumer spending, exports, industrial activity, and property conditions.
2. Chinese government policy: Fiscal stimulus, technology regulation, property measures, and support for private companies can quickly alter market expectations.
3. Hong Kong and US interest rates: Because the Hong Kong dollar is linked to the US dollar, US monetary policy strongly influences Hong Kong’s interest-rate environment. Local rates can still diverge temporarily because of liquidity and capital flows. Higher rates may pressure property and growth stocks, while lower rates can support valuations.
4. Heavyweight company results: Earnings or regulatory news involving HSBC, Tencent, Alibaba, CCB, AIA, and other large members can move the index substantially.
5. Sector trends: Financials carry the largest weight, while consumer discretionary and technology are also important. Weakness in one may outweigh gains in smaller sectors.
6. Geopolitical developments: US–China relations, tariffs, export restrictions, and supply-chain changes can affect companies and overall risk appetite.
7. Currencies and capital flows: The HSI is denominated in Hong Kong dollars, while many members earn revenue in renminbi or other currencies. Exchange-rate expectations and international flows can influence valuations.
Investors should combine economic data, policy signals, company earnings, sector performance, and reactions around support and resistance levels rather than trading one headline alone. They should also check whether a move is broad across sectors or driven mainly by one heavyweight constituent.
Hang Seng Index vs Other Major Indices
Comparing the HSI with other major indexes helps investors understand how leading companies provide insight into different economies and investor sentiment. The table below compares the HSI with major global indexes.
Among these benchmarks, the Hang Seng TECH Index is the closest direct comparison to the HSI because both track Hong Kong-listed companies. However, the HSI covers 93 companies across sectors such as financials, consumer discretionary, technology, healthcare, and energy, while the Hang Seng TECH Index includes 30 technology companies.
As a result, the HSI provides broader market exposure, whereas the Hang Seng TECH Index is more concentrated and more sensitive to technology-sector developments.
Is the Hang Seng Index a Good Indicator of China's Economy?
Yes. The HSI is a useful indicator of sentiment toward major China-linked companies because it tracks large Hong Kong-listed firms such as Alibaba, Tencent, CCB, and ICBC. Its 93 constituents covered 64.08% of the eligible Main Board’s market value and 52.25% of trading turnover in 2026.
However, it does not represent China’s entire economy because smaller, private, and mainland-only companies are excluded. Investors should compare it with GDP, retail sales, industrial production, property, credit data, and mainland indexes.
Pros and Cons of Tracking the Hang Seng Index
Tracking the HSI offers several advantages for investors analysing Hong Kong and mainland China-linked companies.
Pros of Tracking the Hang Seng Index
✅Exposure to China’s economy: Many constituents depend on mainland consumption, finance, technology, property conditions, and government policy.
✅High liquidity: The HSI is widely followed and supported by active ETF, futures, options, and CFD markets, helping provide efficient price discovery.
✅Dividend-paying capacity: Many constituents, particularly banks, insurers, and telecom companies, pay dividends that may support returns from HSI-tracking funds.
Cons of Tracking the Hang Seng Index
❌High policy sensitivity: Chinese regulatory decisions, stimulus measures, property policies, and technology rules can quickly influence index performance.
❌Financial-sector concentration: Financials represent around one-third of the HSI, giving interest rates, credit conditions, and bank earnings considerable influence.
❌Geopolitical volatility: US–China tensions, tariffs, export restrictions, and changing international capital flows can create sharp market movements.
The HSI can therefore provide useful exposure to major China-linked businesses, but investors should understand that it remains concentrated by region and sector.
Conclusion
The Hang Seng Index offers global investors diversified exposure to Hong Kong’s dominant market leaders across 12 key industries. Depending on their strategy, market participants can access the index through tracking funds, individual constituent stocks, futures, options, or CFDs.
For active traders seeking efficient execution, Mitrade provides seamless exposure to the HK50 index alongside a broad suite of global markets—all with ultra-tight spreads and zero commissions. By combining intuitive charting tools, real-time news feeds, flexible leverage, and instant account switching into a single, unified interface, Mitrade makes analyzing, executing, and managing HK50 trades effortless.


* The content presented above, whether from a third party or not, is considered as general advice only. This article should not be construed as containing investment advice, investment recommendations, an offer of or solicitation for any transactions in financial instruments.


