


Qualcomm Inc Stock (QCOM) Moved Down by 6.30% on Sep 28: What Signal Does It Send?
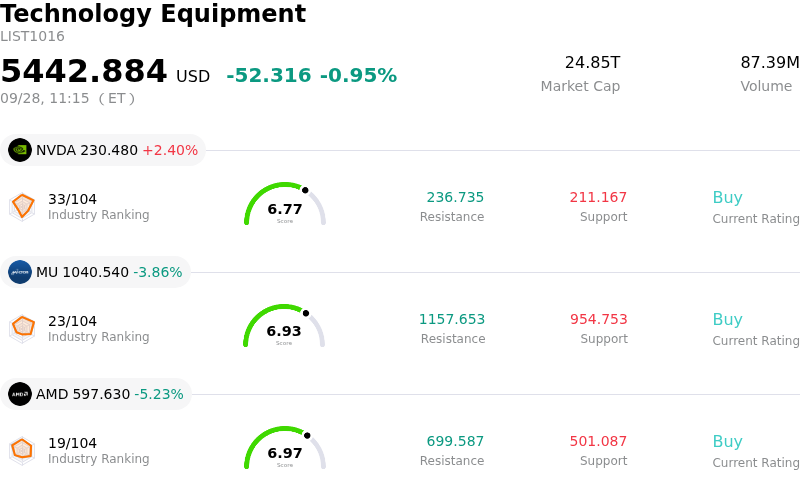
Qualcomm Inc (QCOM) moved down by 6.30%. The Technology Equipment sector is down by 0.95%. The company underperformed the industry. Top 3 stocks by turnover in the sector: NVIDIA Corp (NVDA) up 2.39%; Micron Technology Inc (MU) down 3.77%; Advanced Micro Devices Inc (AMD) down 5.12%.
What is driving Qualcomm Inc (QCOM)’s stock price down today?
Qualcomm experienced a notable retreat as short-term traders and institutional investors engaged in profit-taking following a powerful multi-week rally. The stock had previously surged on a series of major fundamental announcements, including a multi-year patent licensing extension with Apple, a strategic custom silicon collaboration with Amazon Web Services targeting artificial intelligence data center inference, and next-generation product reveals. With these high-profile catalysts now fully digested by the market and share prices hitting consensus analyst fair value benchmarks, momentum paused, triggering a classic sell-the-news reaction in the absence of fresh upside drivers.
Adding to the downside pressure were emerging supply chain uncertainties regarding next-generation foundry nodes. Company executives confirmed an ongoing evaluation of advanced two-nanometer process technology for future processor lineups, but reports of pricing friction with key manufacturing partners raised concerns over potential production timeline pushbacks. Semiconductor investors, particularly sensitive to leading-edge manufacturing access and gross margin impact, reacted cautiously to potential delays in securing advanced node capacity.
Market sentiment was further tempered by corporate insider transactions, including a pre-arranged stock sale by the chief executive officer. Although executed under standard pre-established trading plans, the transaction added a layer of caution among short-term traders. From a valuation perspective, recent gains had pushed the stock near the top end of Wall Street targets, leaving limited room for immediate multiple expansion without upcoming earnings beats. Combined with broader market weakness, these factors catalyzed intraday selling pressure.
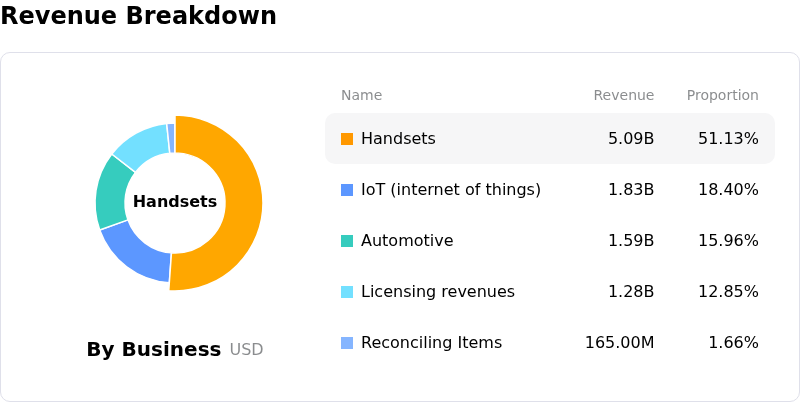
Despite the single-day pullback, Qualcomm’s fundamental multi-year diversification strategy remains intact. Accelerating momentum in automotive silicon, Internet of Things solutions, and data center artificial intelligence infrastructure continues to reduce the company's historical reliance on handset chips. Institutional focus will likely pivot to operational execution and upcoming quarterly earnings results to assess whether longer-term financial guidance can sustain future valuation rerating.
Technical Analysis of Qualcomm Inc (QCOM)
Technically, Qualcomm Inc (QCOM) shows a MACD (12,26,9) value of 2.435, indicating a buy signal. The RSI at 55.812 suggests neutral condition and the Williams %R at 47.288 suggests neutral condition. Please monitor closely.
Media Coverage of Qualcomm Inc (QCOM)
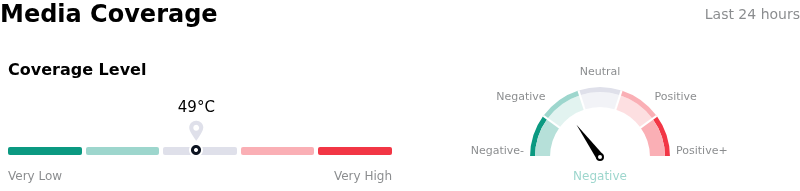
In terms of media coverage, Qualcomm Inc (QCOM) shows a coverage score of 49, indicating a moderate level of media attention. The overall market sentiment index is currently in bearish zone.
Fundamental Analysis of Qualcomm Inc (QCOM)
Qualcomm Inc (QCOM) is in the Technology Equipment industry. Its latest annual revenue is $44.28B, ranking 6 in the industry. The net profit is $5.54B, ranking 9 in the industry. Company Profile
Over the past month, multiple analysts have rated the company as Hold, with an average price target of $194.11, a high of $400.00, and a low of $100.00.
More details about Qualcomm Inc (QCOM)
Company Specific Risks:
- Accelerated Revenue Decline from Apple Modem Share Loss: Despite extending its patent licensing agreement with Apple through 2027, management expects Qualcomm's modem share in upcoming iPhones to fall significantly below prior 20% estimates, projecting an approximate 50% drop in Apple-related revenue between September and December as Apple transitions to custom silicon.
- Smartphone Sector Contraction and Margin Compression: QCT handset chip revenue dropped 20% year-over-year, while memory-driven component cost inflation and initial data center rollout costs are pressuring operating margins below Qualcomm's historical 48% to 50% target range.
- Executive Insider Share Liquidations: Recent SEC Form 4 filings revealed executive selling, including CEO Cristiano Amon liquidating 10,000 shares worth $1.95 million alongside disposals by Chief Financial Officer Akash Palkhiwala, triggering institutional caution regarding management's near-term outlook.
- Negative Earnings Revisions and Tariff Uncertainty: Wall Street consensus estimates face headwinds from over 20 downward earnings revisions for upcoming quarters, alongside macro vulnerability to proposed U.S. semiconductor tariffs that threaten cost structures across Qualcomm's non-handset AI PC and data center hardware initiatives.
Recommended Articles


