


XAUUSD Gold Analysis: Gold Holds Above $4,350 Ahead of US Inflation Data Is $4,500 Next?


Gold Price Today and XAUUSD Chart
You might be interested in the following articles >>> XAUUSD Price Prediction 2026: Where Will It Land After the Historic Correction? How to Invest in XAUUSD in the UAE: All You Need to Know The Best 6 Gold Trading Platforms in the UAE for Year 2026: A Comprehensive Comparison of Gold Costs |
On August 11, the Gold traded between $4,356.88 and $4,435.25, its highest level since June 5. Gold later eased from the session high, while US gold futures traded near $4,441.10 ahead of the July inflation data.
Gold remained supported after July nonfarm payrolls fell by 23,000 instead of rising by the expected 80,000, while May and June were revised down by 103,000 combined. The weaker labor picture reduced near-term rate-hike expectations and helped lower Treasury yields and weaken the dollar, both supportive for gold.
UBS expects gold to approach $5,000 in the first half of 2027, supported by potentially lower real rates, a softer dollar and continued central-bank buying. Near-term volatility may remain high ahead of the US inflation data.
Gold Price Today in The UAE
Gold Price Today in Saudi Arabia
Gold Chart Analysis Today — August 11, 2026
As of August 11, 2026, Gold is trading near $4,370 on the 1-hour chart, with the short-term trend still bullish. Price continues to form higher highs and higher lows, while two bullish breaks of structure (BOS) above previous swing highs confirm that buyers have maintained control.
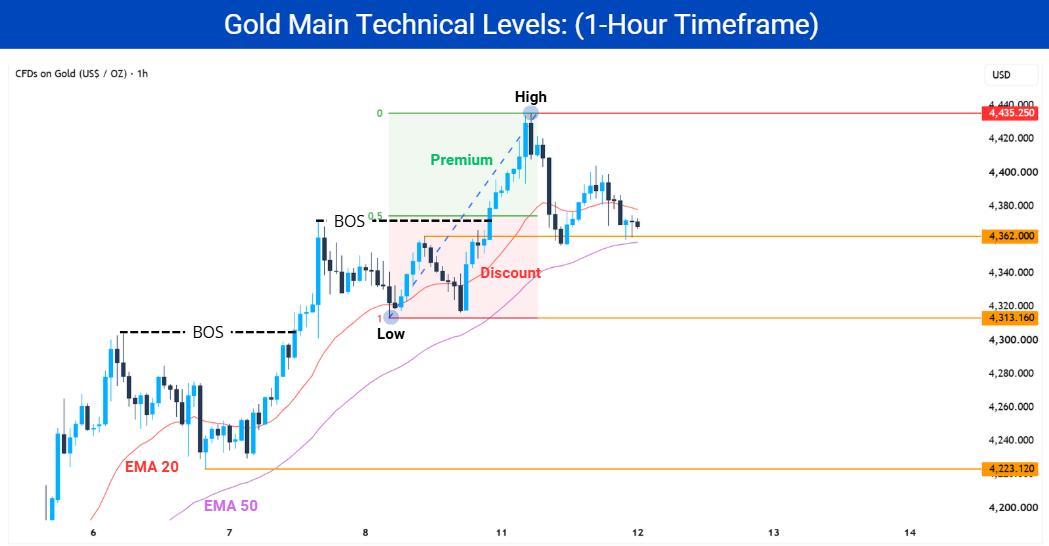
The latest bullish move extended from $4,313.16 to $4,435.25, with the 50% midpoint near $4,374.21. Gold is now trading slightly below this level, inside the discount area, where buyers may look for better entry opportunities if bullish confirmation appears.
The 20-period EMA remains above the rising 50-period EMA, supporting the broader hourly uptrend. Price has moved below the 20 EMA but remains around the 50 EMA, showing weaker short-term momentum without confirming a bearish reversal.
If gold recovers above $4,374.21 and the 20 EMA, buyers could attempt another move toward $4,435.25. A break below the 50 EMA and nearby support would increase the risk of a deeper correction.
Resistance level to watch
$4,435.25: The latest high and main resistance on the chart. A confirmed hourly break and close above it would support further bullish continuation.
Support levels to watch
$4,362.00: The nearest support inside the current discount area. Holding above it would favor another attempt toward $4,435.25.
$4,313.16: The low of the latest bullish move. If the correction deepens, gold could revisit this level before buyers attempt another recovery.
$4,223.12: The main lower support on the chart. A break below $4,313.16 could expose this area and signal a much deeper correction.
Should You Buy Gold Today?
Gold’s hourly structure remains bullish, but the rejection from $4,435.25 and the upcoming US inflation data argue against chasing the latest move. The $4,356–$4,362 zone now provides the clearest short-term area for judging whether buyers are ready to regain control.
✅ Short-term traders: Holding $4,356–$4,362 and recovering above $4,400 could return price toward $4,435.25. An hourly close below $4,356 would instead favor a deeper correction toward $4,313.16.
✅ Swing traders: Higher highs, higher lows and the two bullish breaks of structure continue to favor buyers while $4,313.16 holds. A confirmed break and close above $4,435.25 would provide clearer continuation toward $4,500 than chasing the first candle through resistance.
✅ Hedgers: Gradual purchases can reduce timing risk before the inflation release. Pullbacks toward established support may offer better prices than committing the full position after a sharp rally, especially while the medium-term institutional outlook remains positive.


Gold price outlook for the coming days: Could gold test $4,500?
The short-term outlook remains cautiously bullish while gold holds above the $4,356–$4,362 support area and the rising 50 EMA. Buyers have defended the latest pullback, but stronger momentum still requires a recovery above $4,400.
In the bullish scenario, holding support and closing above $4,400 could bring gold back toward $4,435.25. A confirmed break above that high could open the way toward $4,500, especially if inflation is lower than expected and Treasury yields and the dollar fall.
The corrective scenario strengthens if gold closes below $4,356 and the 50 EMA. Price could then revisit $4,313.16, while a break below that level would expose $4,223.12 and signal a deeper correction.
Over the medium term, UBS expects gold to approach $5,000 in the first half of 2027, supported by potentially lower real rates, a weaker dollar and continued central-bank buying. High oil prices and more hawkish Fed expectations remain the main risks to this outlook.

Trade XAU/USD with Tight Spreads
* The content presented above, whether from a third party or not, is considered as general advice only. This article should not be construed as containing investment advice, investment recommendations, an offer of or solicitation for any transactions in financial instruments.


