


Tesla Inc Stock (TSLA) Moved Down by 3.10% on Sep 28: What Signal Does It Send?
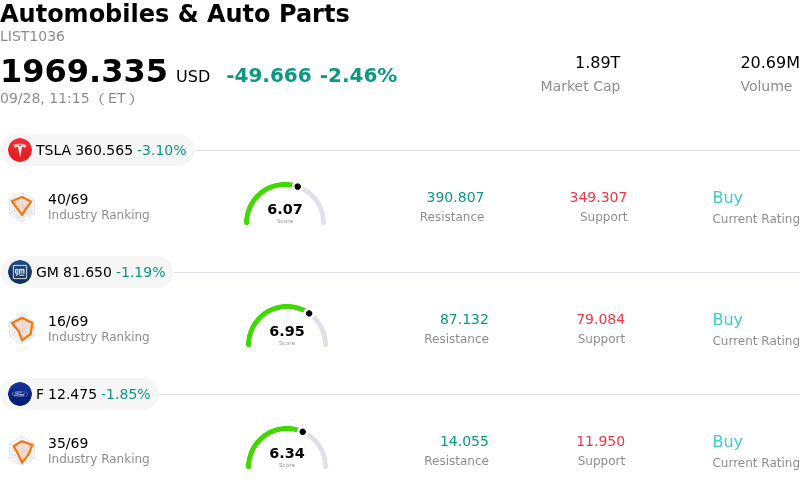
Tesla Inc (TSLA) moved down by 3.10%. The Automobiles & Auto Parts sector is down by 2.46%. The company underperformed the industry. Top 3 stocks by turnover in the sector: Tesla Inc (TSLA) down 3.10%; General Motors Co (GM) down 1.19%; Ford Motor Co (F) down 1.85%.
What is driving Tesla Inc (TSLA)’s stock price down today?
Tesla experienced downward pressure as investors grew cautious ahead of the company's upcoming third-quarter vehicle delivery and production report. Market sentiment has been weighed down by recent delivery estimate reductions from major Wall Street institutions, which cited softer sales figures across key automotive markets including the United States, China, and Europe. Concerns over slowing consumer adoption of electric vehicles, intense competitive pricing pressures from rival automakers, and persistent margin erosion continue to cast a shadow over near-term fundamental growth expectations.
Adding to the session's pullback, the stock faced notable technical resistance near key long-term moving averages following a recent multi-week rebound. Analysts from prominent investment firms reiterated cautious ratings, pointing to elevated valuation multiples relative to historical automotive standards and reduced consensus earnings estimates. Furthermore, heavy capital expenditures required to fund Tesla's aggressive expansion in artificial intelligence, autonomous driving infrastructure, and robotics have led to heightened investor scrutiny regarding capital allocation efficiency.
The significant intraday volatility underscores a persistent division among market participants. While retail and long-term institutional investors remain focused on prospective growth drivers, such as upcoming vehicle reveals, expanding energy storage deployments, and advancements in autonomous technology, short-term traders are increasingly risk-averse ahead of the official delivery disclosures. Until clarity is provided on delivery volume and underlying profitability metrics in the upcoming quarterly updates, Tesla's stock is likely to remain sensitive to macroeconomic sentiment and technical trading patterns.
Technical Analysis of Tesla Inc (TSLA)
Technically, Tesla Inc (TSLA) shows a MACD (12,26,9) value of -0.181, indicating a neutral signal. The RSI at 48.734 suggests neutral condition and the Williams %R at 79.347 suggests sell condition. Please monitor closely.
Media Coverage of Tesla Inc (TSLA)
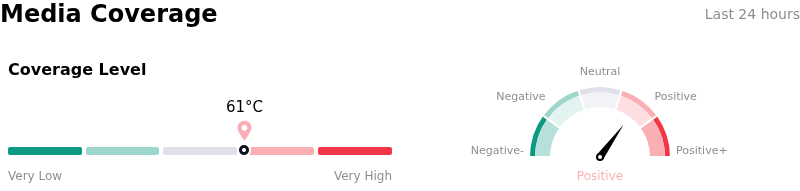
In terms of media coverage, Tesla Inc (TSLA) shows a coverage score of 61, indicating a high level of media attention. The overall market sentiment index is currently in bullish zone.
Fundamental Analysis of Tesla Inc (TSLA)
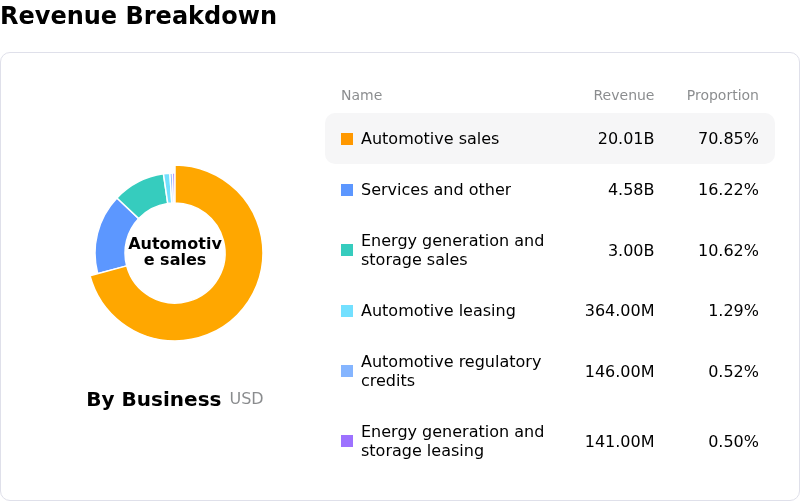
Tesla Inc (TSLA) is in the Automobiles & Auto Parts industry. Its latest annual revenue is $94.83B, ranking 6 in the industry. The net profit is $3.79B, ranking 2 in the industry. Company Profile
Over the past month, multiple analysts have rated the company as Buy, with an average price target of $381.13, a high of $600.00, and a low of $24.86.
More details about Tesla Inc (TSLA)
Company Specific Risks:
- Delivery Estimate Downgrades and Margin Pressure: Institutional analysts, including JPMorgan, slashed Q3 delivery forecasts to 482,000 units and cut price targets, pointing to declining August registrations in China and the U.S., alongside gross margin compression driven by elevated raw-material costs.
- NHTSA Regulatory Probe into Cybercab Compliance: The National Highway Traffic Safety Administration issued an Audit Query and Special Order requiring Tesla to justify its self-certification process for the control-free Cybercab under Federal Motor Vehicle Safety Standards, creating enforcement and deployment risks.
- EU Full Self-Driving Approval Postponement: Regulatory authorities in the European Union officially delayed their vote on approving Tesla's Full Self-Driving technology until at least December, creating strategic setbacks for commercial expansion across European markets.
- CapEx Expansion and Cash Flow Strain: Tesla is executing a $25 billion annual capital spending plan for AI compute and robotics that drove quarterly free cash flow to negative $1.1 billion, exposing vulnerability given its elevated valuation exceeding 340 times earnings.
Recommended Articles


