


The oil commodity represents the primary source of energy worldwide, which makes the oil market highly liquid and active. Nevertheless, to become a profitable trader of the oil commodity, one should know everything about the oil market structure, benchmarks, and risk management.
This guide covers Brent and WTI, key price drivers, trading hours, costs, and common strategies.
Whether you’re exploring futures, CFDs, or oil stocks, you’ll learn what to consider before placing your first trade.
What is Oil Trading?
Oil trading means buying and selling physical petroleum or financial instruments linked to oil prices. Producers and consumers trade to manage price exposure; investors and speculators seek returns from price changes.
Physical transactions involve delivery, storage, and transportation. Financial trading typically uses futures, options, contracts for difference (CFDs), or oil-related investments.
The Core Benchmarks:
While there is an assumption that crude oil exists as one commodity, it is made up of various types of oil that vary in terms of quality, source, and methods of valuation. Brent Crude and WTI are the two major global benchmarks for energy:
Brent Crude (ICE): International benchmark crude oil made up of oils extracted from oil fields in the North Sea, namely, Brent, Forties, Oseberg, and Ekofisk. As a result, due to its nature of being light and sweet, it can be a great choice for refining useful products such as gasoline and diesel fuel. It functions as the main indicator of the global price of oil and is used to set prices on around two-thirds of crude oil globally. Its pricing and market value are heavily influenced by several key factors, including OPEC production decisions, geopolitical tensions in major shipping routes, and shifts in global economic demand .
West Texas Intermediate / WTI (NYMEX): A high-quality crude oil found in America and considered light and sweet due to its low sulfur content. Mostly produced in the USA, WTI can be easily refined, making it an excellent choice for energy production. As the major benchmark for determining the price of crude oil in the American market, the price of WTI depends on domestic issues like local stock levels, pipelines, and storage facilities in the USA.
Other Emerging Benchmarks: Beyond Brent and WTI, other key regional benchmarks include Dubai/Oman crude, which prices Middle Eastern exports bound for Asia, and Urals crude, Russia's primary export blend.
What Moves Oil Prices?
Oil prices are driven by the balance between physical market supply, global consumption trends, inventory levels, and financial market sentiment.
1. Supply: Production and Disruptions
Market availability is influenced greatly by the production policies and buffers that exist in addition to geopolitical developments.
OPEC+ and non-OPEC output: Policies for production quotas set by OPEC+ and the growth of non-OPEC production (such as the US Permian region) determine the availability of global crude oil supplies.
Spare capacity: Spare production capacity is additional output that producers can bring online quickly and sustain—not oil already held in storage. The EIA defines it as production that can be brought online within 30 days and sustained for at least 90 days. When spare capacity is limited, the market has less flexibility to absorb supply disruptions, which can increase price volatility.
Supply disruptions: Sanctions, regional conflicts, maritime bottlenecks, and severe weather create immediate risk premiums by suddenly removing physical supply or restricting trade access. In August 2021, Hurricane Ida forced the shutdown of over 90% of US Gulf Coast crude oil production, temporarily halting nearly 1.7 million barrels per day and driving WTI prices up by over 10% within two weeks.
2. Demand: Economic Activity and Seasonality
Global demand dynamics are affected by general macroeconomic conditions, fuel demand across sectors, and fundamental policy changes.
Consumption: Road transportation, air transport, and industrial sectors drive core oil consumption.
Seasonal and structural changes: Seasonal factors (such as summer travel surges or winter heating needs) impact short-term demand, while long-term structural shifts (such as rapid electric vehicle adoption) dampen long-term growth.
3. Inventories, Storage, and Refining
Physical movement and production capacities have considerable influence on short-term prices of crude oil:
Crude balances: Alterations in patterns of imports and exports between the regions affect the inventory levels and prices within the region.
Refinery activity and products: High refinery runs mean increased physical demand for crude, while high product inventories such as gasolines and diesel will decrease crude purchases.
4. Currency, Positioning, and Expectations
Market sentiment and macroeconomic factors shape price action alongside physical fundamentals:
US dollar: The inverse relationship between crude oil and the US dollar is situational and could be voided in case of global supply disruptions and economic strength.
Positioning: The CFTC’s Commitments of Traders (COT) reports show how different market participants are positioned in oil futures. Extreme speculative net-long or net-short positions may indicate crowded trades and greater sensitivity to position unwinding.
Futures Curves: Futures curves show the strength of the physical market; backwardation shows tight physical supply while contango shows oversupply.
When Does the Oil Market Open?
The international oil market trades almost nonstop, switching between different centers of the world's financial industry to allow for constant trading activity.
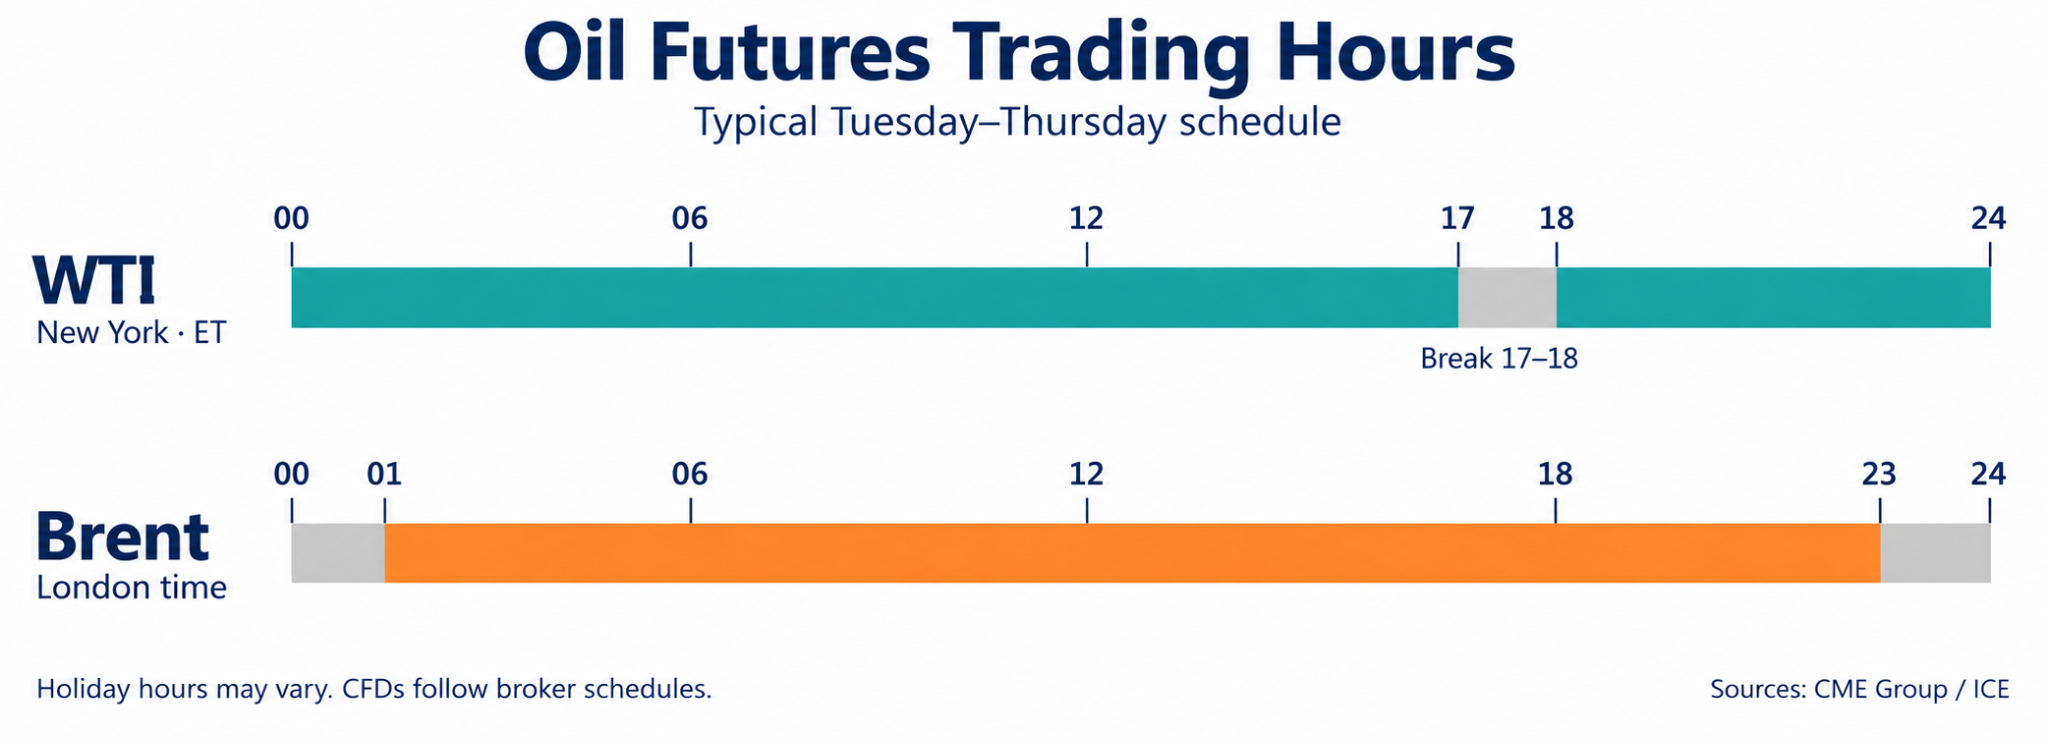
- Trading Hours: Major crude oil futures trade for extended hours, but schedules differ by exchange and contract:
WTI futures on CME Globex: Normally trade from Sunday through Friday, from 6:00 p.m. to 5:00 p.m. ET the following day, with a daily maintenance break from 5:00 p.m. to 6:00 p.m. ET between sessions.
Brent futures on ICE Futures Europe: Regular trading hours are generally 1:00 a.m. to 11:00 p.m. London local time, with a Sunday opening at 11:00 p.m. for Monday’s session.
- Active Trading Hours: Oil markets are often more active when European and US trading hours overlap. Liquidity and volatility vary by contract and market conditions, while major economic releases, inventory reports, and geopolitical developments can trigger sharp price moves throughout the trading day.
- Holiday schedules and daylight-saving transitions may affect trading hours. Oil CFDs follow the broker’s product schedule, which may differ from the underlying futures market.
How to Research the Oil Market Before Trading
Oil markets generate constant headlines, but not every update deserves equal attention. Focus on four research categories to understand what is changing, why it matters, and how it could affect prices.
1. Supply, Demand, and Inventory Data
Start with the EIA’s Weekly Petroleum Status Report and the American Petroleum Institute’s weekly inventory estimates. These provide insight into US crude stocks, refinery activity, and trade flows. The EIA is a government agency; API is an industry association.
🔸Why it matters: Inventory changes offer clues about the balance between supply and demand.
🔸How to interpret it: A larger-than-expected inventory draw can support prices, while an unexpected build can pressure them. Check refinery activity, imports, exports, and seasonal patterns before drawing conclusions.
🔸When to check: EIA data is normally released on Wednesdays at 10:30 a.m. ET; API estimates typically arrive on Tuesdays around 4:30 p.m. ET. Holiday schedules may differ.
2. Market Outlooks and Forecasts
Follow the IEA’s Oil Market Report, OPEC’s Monthly Oil Market Report, and the EIA’s Short-Term Energy Outlook to track expectations for future supply and demand.
🔸Why it matters: These reports help you assess whether the market is expected to tighten or move toward a surplus.
🔸How to interpret it: Higher demand forecasts or lower supply projections can support a bullish outlook. Weaker demand or faster supply growth can support a bearish one. Focus on revisions from previous reports and differences from market expectations.
🔸When to check: Monthly, according to each publisher’s release calendar.
3. Trader Positioning
Use the CFTC’s Commitments of Traders (COT) reports to examine how producers, merchants, money managers, and other participants are positioned in oil futures.
🔸Why it matters: Positioning helps reveal shifts in sentiment and potentially crowded trades.
🔸How to interpret it: Rising speculative net-long positions may indicate growing optimism, but extreme long positioning can increase vulnerability to a sell-off. Heavy short positioning can create short-covering risk. Neither extreme guarantees a reversal.
🔸When to check: Normally Fridays at 3:30 p.m. ET, reflecting positions from the preceding Tuesday. This reporting lag matters when markets move quickly.
4. News and Market Commentary
Monitor financial news, brokerage research, and market analysis for developments involving OPEC+, geopolitics, production disruptions, and economic conditions.
🔸Why it matters: Timely reporting can explain sudden price moves and highlight emerging risks.
🔸How to interpret it: Separate confirmed developments from opinions. Assess whether an event changes supply or demand, how long its effects might last, and whether the market has already priced it in. Commentary provides context, not a standalone trading signal.
🔸When to check: Throughout the trading day, especially around scheduled announcements and major events.
Pros and Cons of Trading Oil
Crude oil trading comes with its own set of strategic benefits for market participants, although there are certain market risks involved as well.
Ways to Trade Oil
1 Oil CFDs (Contracts for Difference)
Derivative financial contracts where a trader agrees to exchange the price difference of crude oil between the opening and closing of a position with a broker, enabling speculative trading on both rising and falling prices without actual ownership of physical oil.
🔴Pros and Cons: Offers high flexibility for long/short trading and a low barrier to entry, but carries magnified loss potential through leverage along with overnight swap fees and spreads.
🎯Best for: Short-to-medium-term retail traders.
2 Oil Futures Contracts
Standardized, legally binding exchange-traded agreements to buy or sell a specific quantity of crude oil at a predetermined price on a specified future delivery date, forming the primary benchmark mechanism for global oil pricing.
🔴Pros and Cons: Provides direct, professional exposure to underlying benchmark prices, but involves complex contract structures requiring advanced expertise, commissions, and margin requirements.
🎯Best for: Professional traders and institutional investors.
3 Oil ETFs
Exchange-traded investment funds that track crude oil market benchmarks, spot prices, or energy indexes by holding underlying oil futures contracts or related basket assets, traded directly on traditional stock exchanges like equity shares.
🔴Pros and Cons: Easy to understand with simple portfolio exposure, but management fees apply and they may not fully track spot price changes with 100% precision.
🎯Best for: Investors seeking simplicity and medium-to-long-term exposure.
4 Energy Stocks
Publicly traded equity shares of individual corporations involved in crude oil exploration, extraction, refining, or distribution, offering indirect corporate exposure to the broader energy sector.
🔴Pros and Cons: Delivers sector exposure with potential dividend payouts, but stock prices can be heavily influenced by individual company factors rather than oil prices alone.
🎯Best for: Investors seeking indirect oil exposure.
Why Use Mitrade to Trade Oil?
From tracking oil prices to placing your next trade, Mitrade brings research, execution, and risk management together in one accessible platform.
✅Zero Commissions, Competitive Spreads: Trade oil CFDs with no execution commissions and competitive variable spreads to help keep trading costs down.
✅Trade on Your Terms: Access the platform on web or mobile, with real-time market information and customizable charts to help you assess opportunities wherever you are.
✅Build Risk Controls Into Your Trades: Use stop-loss and trailing-stop tools to manage positions as markets move. Negative balance protection is available subject to the terms of your account and jurisdiction.
✅Practice Before Committing Capital: Explore the platform and test oil trading strategies with a demo account offering $50,000 in virtual funds, with currency depending on your region.
✅Support When Markets Are Moving: Access multilingual customer support 24 hours a day, five days a week.
Start with the demo account to explore the tools and develop your trading routine before moving to live oil CFDs.
Risk-Free Demo Account
CMA-regulated | 24х5 | T+0 | low spreads. Enjoy limit and stop loss for every trade!
How to Start Oil Trading Step by Step
Starting your oil trading journey requires a structured approach, from selecting an authorized trading platform to risk management during your first trade. The following is a guide that will show how you can go about it using Mitrade as an example:
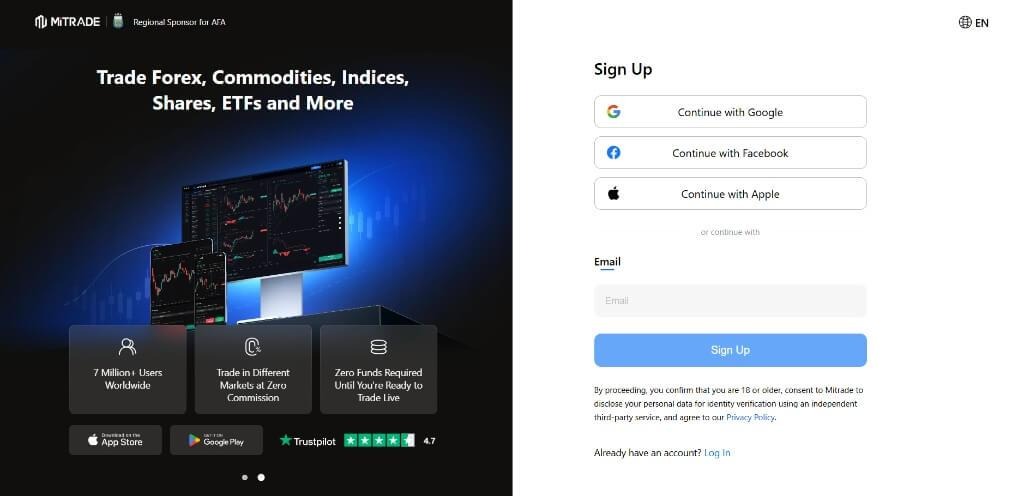
Step 1. Register & Verify: Sign up on the Mitrade web platform or mobile app and complete the quick identity verification (KYC).
Step 2. Practice & Account Setup: First, try out your trading methods through our free demo trading account with demo money (like $50,000) in WTI or Brent oil, after which you can proceed to deposit into your account and trade $0 commission oil.
Step 3. Choose Your Benchmark: Search for WTI or Brent crude oil in the platform’s market list.
Step 4. Position Definition & Risk: Choose the size of your order, determine the direction of the trend, and establish obligatory Stop Loss and Take Profit levels.
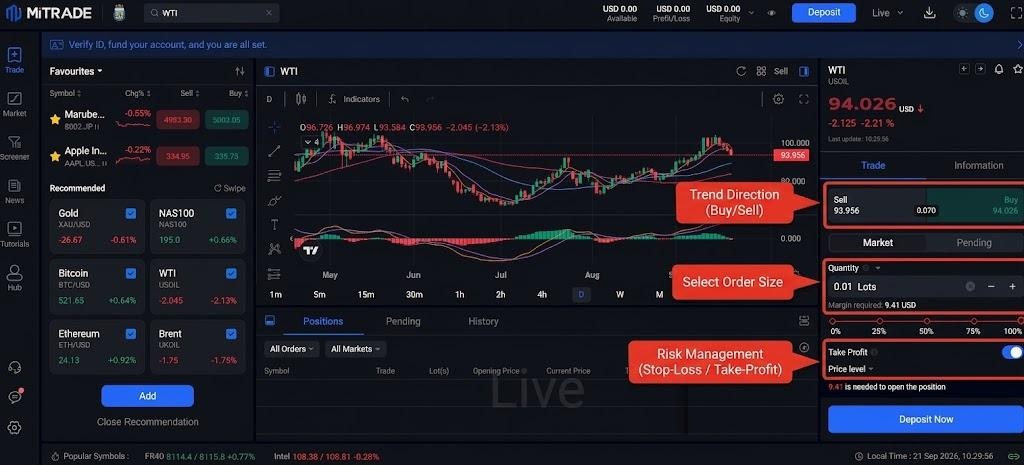
Step 5. Execution & Control: Make a Long (Buy) or Short (Sell) deal, observe its performance, and get out on reaching your goal.
Common Strategies of Oil Trading
Understanding how to maneuver the crude oil market involves using the right approach based on prevailing price movements, volatility, and market forces. Here are some of the best strategies in use among oil traders:
1. Range and Mean-Reversion Approaches
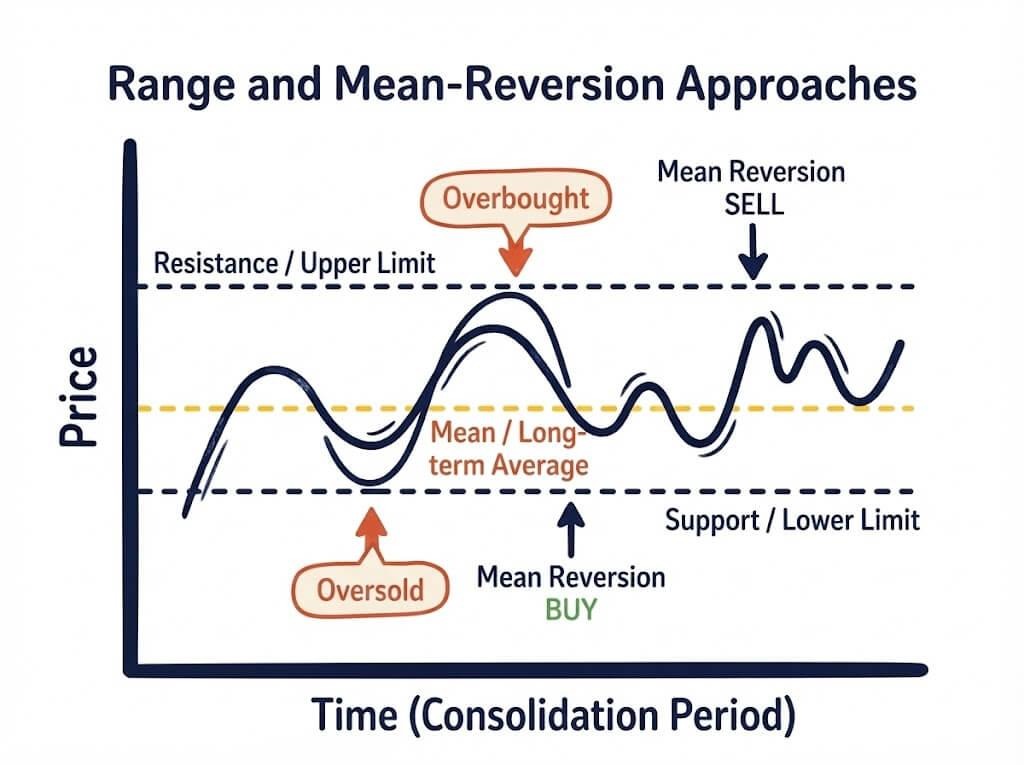
Investment strategies based on the idea that prices return to their long-run average, utilizing key horizontal support/resistance levels, Bollinger Bands, and RSI overbought/oversold conditions.
Best for: Technical traders who trade in a range-bound market characterized by a bouncing oil price within defined limits.
2. Trend-following and swing approaches
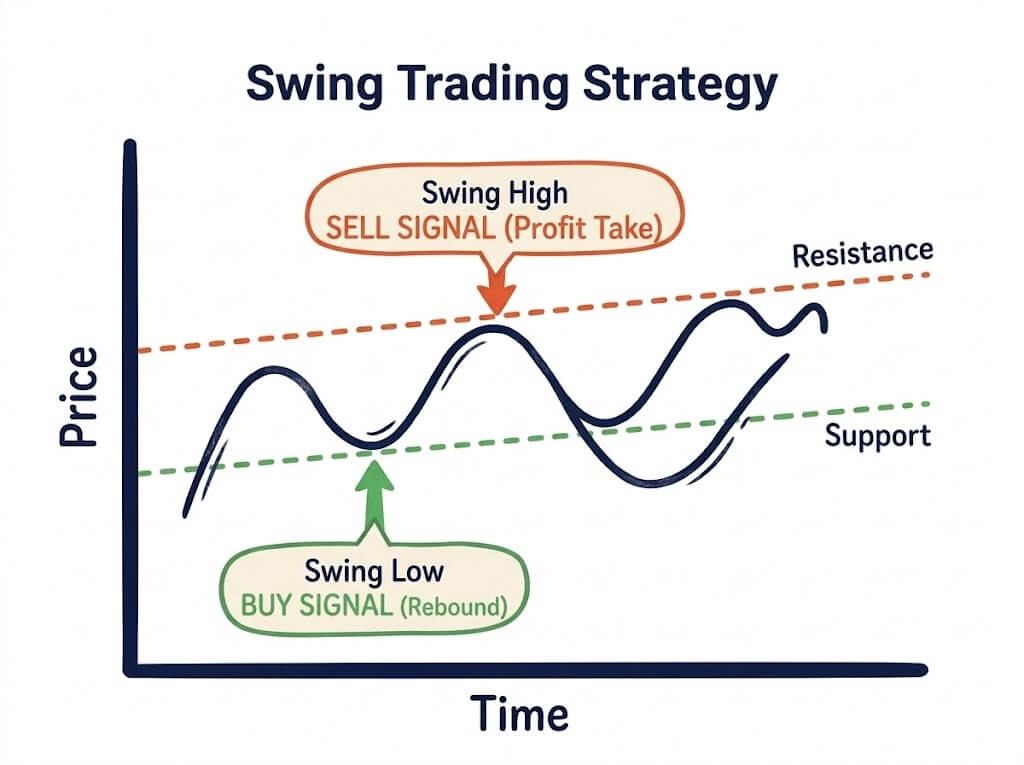
Strategies that take advantage of market momentum through existing trends, utilizing moving averages (looking for trend crossovers) and technical retracement levels.
Best For: Medium-term traders seeking to benefit from long-lasting trends, larger price movements, and macro-economic developments as opposed to micro-movements.
3. Breakout and Event-Driven Approaches
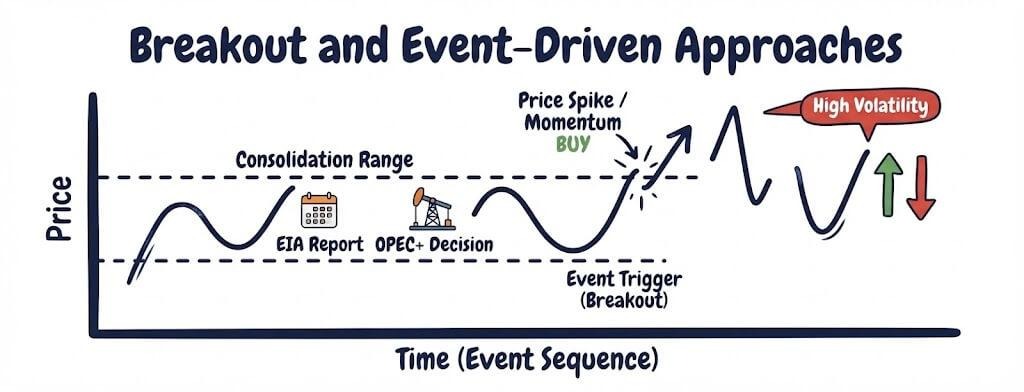
These strategies focus on price moves beyond established support or resistance levels, or reactions to events such as scheduled EIA inventory releases and OPEC+ production announcements. Traders assess how new information compares with market expectations and whether price action supports the initial move.
Best for: Experienced traders who can monitor markets closely and manage rapid price swings, false breakouts, and execution slippage around major announcements.
4. Intraday Versus Longer-Term Positioning
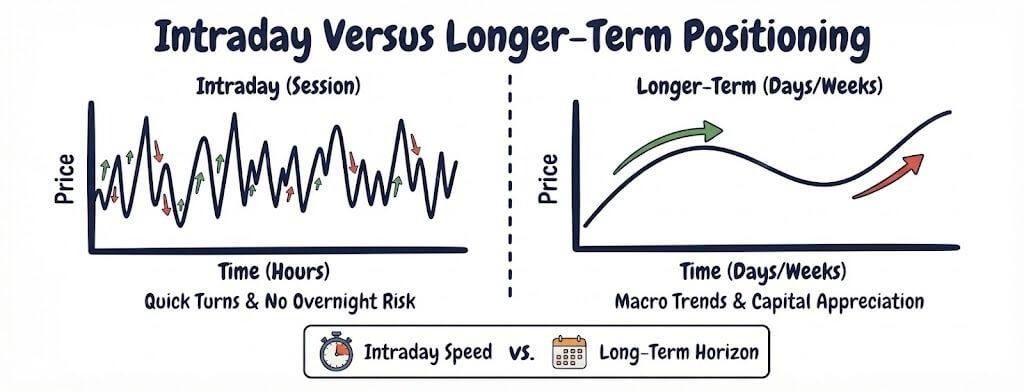
Comparative execution styles using market highs and lows, volatility indicators, and multi-timeframe moving average alignments to compare ultra-speed sessions with multi-day positioning.
Best For: Traders choosing between dedicated screen time (closing all positions before the bell) and macro-based swing positioning style.
Conclusion
In summary, oil trade brings opportunities through the use of key benchmarks such as Brent and WTI, and all this is possible through market understanding, risk management and the right trading strategies. Mitrade helps the traders by providing a platform which is easy to use, provision of flexibility in leverage, zero-commission trades, market analysis tools, demo trading and risk management tools such as stop loss and take profit.


How much capital is needed, and how does that differ from minimum margin?
Capital refers to the total funds a trader allocates for their overall trading activities and risk management, whereas margin is the small collateral deposit required by a broker to open and maintain a leveraged position. While your overall capital depends on your personal risk strategy and goals, practical entry points vary by provider; for instance, the minimum deposit at Mitrade is $50 USD, allowing you to fund an account and start trading from a low baseline.
Can oil be traded without leverage?
Yes. You can buy oil stocks or non-leveraged oil ETFs outright through a cash account, although their returns may differ from crude prices. Some CFD products offer 1:1 leverage, but availability depends on the instrument and region;
What distinguishes Brent, WTI, futures, and CFDs?
Brent and WTI are crude oil benchmarks. Futures and CFDs are instruments used to trade price exposure. Futures are standardized exchange-traded contracts with defined expiry and settlement rules. CFDs are agreements with a broker to exchange price differences, without owning physical oil. Both can involve leverage, but their costs and contract terms differ.
* The content presented above, whether from a third party or not, is considered as general advice only. This article should not be construed as containing investment advice, investment recommendations, an offer of or solicitation for any transactions in financial instruments.


