


Gold Price Analysis Today: Gold Drops 1.32% Despite Lower Fed Rate-Hike Bets, Can $4,313 Support Hold?


Gold Rate Today and Gold Live Chart
You might be interested in the following articles >>> XAUUSD Price Prediction 2026: Where Will It Land After the Historic Correction? How to Invest in XAUUSD in the UAE: All You Need to Know The Best 6 Gold Trading Platforms in the UAE for Year 2026: A Comprehensive Comparison of Gold Costs |
Gold opened Thursday’s session near $4,408 per ounce and initially climbed to an intraday high of $4,449.73. It later reversed lower, reaching a session low of $4,343.896 before closing near $4,349.918, around 1.32% below its opening price.
The August 13 session was bearish, with gold also closing below the $4,356.46 support. In early August 14 trading, price extended the decline toward the key $4,313.160 support before beginning to show an initial bullish reaction.
Gold received fundamental support after July US producer prices were unchanged from the previous month, below the expected 0.2% increase. Annual PPI also slowed to 4.7% from 5.5% in June, adding to signs that inflation pressures are easing.
The softer inflation data further reduced expectations of another Fed rate hike in September, with markets pricing a 67.6% probability that rates will remain unchanged. Lower rate expectations also pushed Treasury yields lower, reducing the opportunity cost of holding non yielding gold.
However, these supportive factors did not prevent gold from falling 1.32% on August 13. The decline shows that short term selling pressure remains present, while continued tensions between the United States and Iran still provide some support through safe haven demand.
On August 14, investors will focus on July US retail sales. Stronger consumer spending could revive rate hike expectations and push Treasury yields higher, which may weigh on gold, while weaker sales could reinforce expectations that the Fed will keep rates unchanged and support a recovery.
Gold Rate Today in the UAE
The gold rate in the UAE moved lower in morning trading compared with the previous session.
Gold Rate Today in India
Gold Technical Analysis
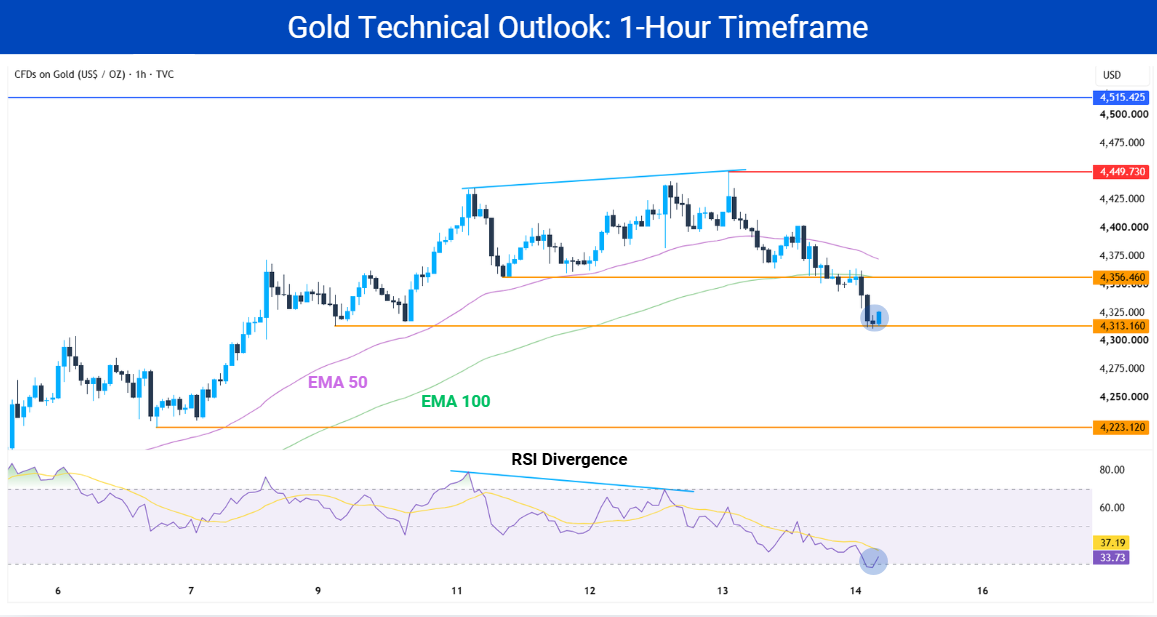
Gold closed bearish on August 13 after breaking below the 50 period EMA, the 100 period EMA and $4,356.460 support. Before the decline, price formed a higher high near $4,449.730 while RSI formed a lower high, creating a bearish RSI divergence and signaling weakening bullish momentum.
In early August 14 trading, gold extended lower toward the key $4,313.160 support and began showing a bullish reaction. RSI fell to around 30, reaching oversold territory, before reversing higher to 33.73. This shows that selling momentum is starting to ease and, together with the reaction from $4,313.160, may signal an early buying opportunity.
RSI remains below its 37.19 moving average, so the recovery is still at an early stage. A continued rise in RSI alongside price holding above $4,313.160 would provide stronger evidence that buyers are beginning to regain control.
Price also remains below the 100 period EMA and 50 period EMA, meaning the broader recovery has not yet been confirmed. A move back above the 100 period EMA, followed by a reclaim of $4,356.460 and later the 50 period EMA, would strengthen the bullish case.
If gold instead breaks and closes below $4,313.160, the current bullish reaction would fail. This would increase the risk of further downside toward the psychological $4,300 level and potentially $4,223.120.
Resistance Levels to Watch
$4,356.460
$4,449.730
$4,515.425
Support Levels to Watch
$4,313.160
$4,300
$4,223.120
Should I Buy Gold Now?
Gold is beginning to show a bullish reaction from $4,313.160, but traders should still wait for confirmation before buying. RSI has started recovering from oversold territory, while price remains below the main moving averages.
✅ Pullback traders: If $4,313.160 continues to hold, traders can watch for a stronger bullish candle and RSI continuing to recover from its current 33.73 reading. Higher volume accompanying the reaction would provide additional confirmation.
If bullish confirmation appears, traders could consider an entry after the reaction, with a stop loss below $4,313.160. The first take profit level would be $4,356.460, which now acts as the nearest resistance.
✅ Conservative traders: Traders looking for stronger confirmation can wait for price to recover above the 100 period EMA, reclaim $4,356.460 and later move above the 50 period EMA. These signals would provide stronger evidence that buyers are regaining control.
✅ Breakout traders: A confirmed break below $4,313.160 followed by a failed retest could provide a selling opportunity toward $4,300 and potentially $4,223.120. In the opposite direction, a confirmed break above $4,356.460 followed by a successful retest could provide a buying opportunity toward $4,449.730.


Is It a Good Time to Buy Gold? Gold Prediction Today
The short term gold price prediction is cautiously positive while $4,313.160 continues to hold. Softer US inflation and lower expectations of another Fed rate hike remain supportive, while the August 14 reaction from this support suggests buyers are attempting to stabilize price.
The bullish scenario would strengthen if gold recovers above $4,356.460. This could allow price to move back toward $4,449.730, while a confirmed break above that resistance could open the way toward $4,515.425.
US retail sales will be an important driver for this scenario. Weaker than expected spending could reinforce expectations that the Fed will keep rates unchanged, put downward pressure on Treasury yields and provide additional support for a gold recovery.
The bearish scenario would become stronger if retail sales come in above expectations and revive rate hike concerns. A break below $4,313.160 would add to this pressure and could extend the correction toward $4,300 and then $4,223.120.
For the gold prediction next week, Fed rate expectations, Treasury yields and the US dollar remain important drivers. Continued safe haven demand linked to geopolitical tensions could support gold, while stronger US data and renewed upward pressure on yields could limit the recovery.
Trade XAU/USD with Tight Spreads
* The content presented above, whether from a third party or not, is considered as general advice only. This article should not be construed as containing investment advice, investment recommendations, an offer of or solicitation for any transactions in financial instruments.


