

US Dollar faces pressure with technical warning signs ahead
- The US Dollar is back in the red after eking out gains earlier in the week.
- The technical picture raises a worrying sign for the coming weeks.
- The US Dollar index closed above a key level on Thursday.
The US Dollar (USD) starts on the back foot again on Friday, as it almost did nearly every trading day this week. As such, there is no issue, seeing that the US Dollar Index has been able to print three consecutive days of gains. The effect of the lower-than-expected Initial Jobless Claims print from Thursday is quickly fading, and with an empty calendar ahead, it could be a day of more outflow for the US Dollar ahead of the weekend.
On the economic data front, there is an empty calendar ahead with no data points that will move markets or the US Dollar. This means that either headlines or geopolitical events will drive markets to close the week. The weekly close for the US Dollar will be vital ahead of next week when the US Consumer Price Index (CPI) and the US Retail Sales data for July are on the docket.
Daily digest market movers: Volatility to pick up again
- A slew of US Federal Reserve (Fed) members left a few comments overnight in terms of where they see the Fed policy at the moment:
- President of the Federal Reserve Bank of Chicago Austan Goolsbee said that the Fed is watching markets, though that does not influence the Fed’s policy. Goolsbee also expressed his unease that the Fed would cut so close to US elections.
- Kansas City Fed President Jeffrey Schmid said that it is appropriate to cut when inflation continues to come in low. Schmid also noted that the job market is still in very good shape.
- China’s data this week remained very disappointing after imports surpassed exports, making the Chinese main exporter suddenly an importer for the month of July. More concerns are now at hand, with Consumer Prices rising 0.5% against July last year. The People’s Bank of China (PBoC) might be forced to raise rates in order to tame inflation, while it wants to keep rates low or even lower in order to boost exports.
- Equity markets look a bit two-faced on Friday, with Asian stocks set to close in positive territory, while European indices and US futures are mildly negative.
- The CME Fedwatch Tool shows a 54.5% chance of a 50 basis points (bps) interest rate cut by the Federal Reserve (Fed) in September against a 45.5% chance for only 25 bps. Another 25 bps cut (if September is a 50 bps cut) is expected in November by 51.9%, while a 15.8% chance for a 50 bps cut and 32.3% for no cut are being pencilled in for that meeting.
- The US 10-year benchmark rate trades at 3.97% after popping above 4.00% briefly on Thursday.
US Dollar Index Technical Analysis: Fools rush in
The US Dollar Index (DXY) faces pressure near the pivotal level of 103.18 after closing above it for the first time this week on Thursday. Thus, Friday’s close will be even more important as there could be more downside in the cards towards next week.
Still the first level to recover, which gains importance every day, is 103.18, a level held on Friday last week though snapped on Monday this week in the Asian hours.. Once the DXY closes above that level, next up is 104.00, which was the support from June. If the DXY can make its way back above that level, the 200-day Simple Moving Average (SMA) at 104.17 is the next resistance level to look out for.
On the downside, the oversold condition in the Relative Strength Index (RSI) indicator has eased in the daily chart and holds room again for a small leg lower. Support nearby is the March 8 low at 102.35. Once through there, pressure will start to build on 102.00 as a big psychological figure before testing 101.90, which was a pivotal level in December 2023 and January 2024.
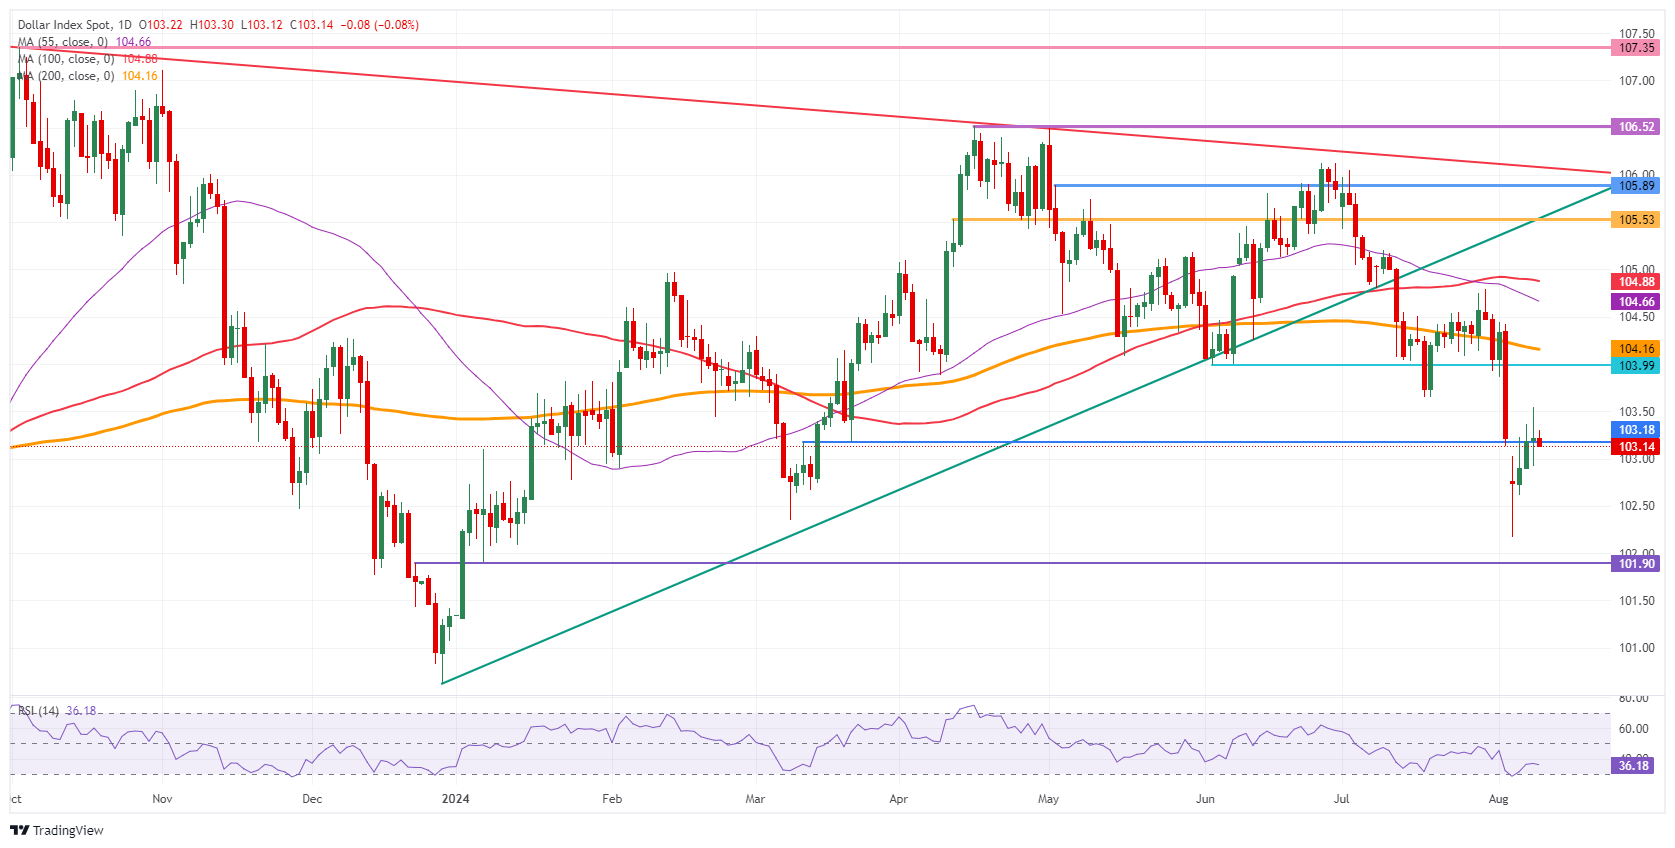
US Dollar Index: Daily Chart
US Dollar FAQs
The US Dollar (USD) is the official currency of the United States of America, and the ‘de facto’ currency of a significant number of other countries where it is found in circulation alongside local notes. It is the most heavily traded currency in the world, accounting for over 88% of all global foreign exchange turnover, or an average of $6.6 trillion in transactions per day, according to data from 2022. Following the second world war, the USD took over from the British Pound as the world’s reserve currency. For most of its history, the US Dollar was backed by Gold, until the Bretton Woods Agreement in 1971 when the Gold Standard went away.
The most important single factor impacting on the value of the US Dollar is monetary policy, which is shaped by the Federal Reserve (Fed). The Fed has two mandates: to achieve price stability (control inflation) and foster full employment. Its primary tool to achieve these two goals is by adjusting interest rates. When prices are rising too quickly and inflation is above the Fed’s 2% target, the Fed will raise rates, which helps the USD value. When inflation falls below 2% or the Unemployment Rate is too high, the Fed may lower interest rates, which weighs on the Greenback.
In extreme situations, the Federal Reserve can also print more Dollars and enact quantitative easing (QE). QE is the process by which the Fed substantially increases the flow of credit in a stuck financial system. It is a non-standard policy measure used when credit has dried up because banks will not lend to each other (out of the fear of counterparty default). It is a last resort when simply lowering interest rates is unlikely to achieve the necessary result. It was the Fed’s weapon of choice to combat the credit crunch that occurred during the Great Financial Crisis in 2008. It involves the Fed printing more Dollars and using them to buy US government bonds predominantly from financial institutions. QE usually leads to a weaker US Dollar.
Quantitative tightening (QT) is the reverse process whereby the Federal Reserve stops buying bonds from financial institutions and does not reinvest the principal from the bonds it holds maturing in new purchases. It is usually positive for the US Dollar.
Empfohlene Artikel


