Dow Jones Industrial Average soars on rate cut hopes, sets new all-time high

Quelle Fxstreet
  • Dow Jones climbed 450 points to set a fresh all-time peak above 40,200.00.
  • Markets are broadly shrugging off an acceleration of US PPI wholesale inflation.
  • US consumer sentiment surveys worsened, but 5-year inflation expectations eased.

The Dow Jones Industrial Average (DJIA) soared over 450 points on Friday as markets pile back into renewed hopes for rate cuts from the Federal Reserve (Fed) in September even as US Producer Price Index (PPI) wholesale inflation accelerated faster than expected in June. Markets have entirely buried the needle on rate cut forecasts, pricing in three rate cuts in 2024 and a 95% chance of a rate trim on September 18. 

June’s US core PPI wholesale inflation accelerated to 3.0% YoY, entirely eclipsing the forecast 2.5%, and the previous period’s print also saw an upside revision to 2.6% from the initial 2.3%. Despite the sharp uptick in producer-level inflation, markets are instead refocusing on a decline in Consumer Price Inflation (CPI) inflation earlier in the week in order to lean firmly into rate cut hopes.

According to the CME’s FedWatch tool, rate market bets of at least a quarter-point rate trim at the Federal Open Market Committee’s (FOMC) September 18 rate call. Rate traders are also now pricing in at least three rate cuts in total for 2024, a step above the Fed’s own projected one or two rate cuts by December.

Elsewhere in US data on Friday, the University of Michigan’s Consumer Sentiment Index survey stumbled to a seven-month low of 66.0 from the previous 68.2, undercutting the forecast uptick to 68.5 as US consumers turn increasingly discouraged about the economic outlook. UoM 5-year Consumer Inflation Expectations eased slightly in July, ticking down to 2.9% from the previous 3.0%, but markets are putting significant effort into ignoring how much higher long-run consumer inflation expectations are compared to the Fed’s target annual inflation rate of 2.0%.

Dow Jones news

Dow Jones soared on Friday, rising a scorching 450 points and is set to chalk in one of the index’s best three-day performances for the year. All but four of the Dow Jones’ constituent securities are in the green on Friday, with losses led by JPMorgan Chase & Co. (JPM), which declined -0.94% to $205.50 per share. Despite posting better-than-expected second-quarter earnings, the stock is still sliding after trading into all-time highs ahead of Q2 earnings. JPM notched in QoQ profits of 18.1 billion, bringing EPS to $6.12, handily beating the forecast estimates of $5.88.

On the high side, Intel Corp. (INTC) rose nearly 5%, climbing over $35.00 per share as the AI market rush continues. Intel Chief Technology Officer Greg Lavender noted recently that he anticipates Intel to reach $1 billion in annual subscription revenue from AI-related cloud computing subscriptions by fiscal year end of 2027. While the growth projection in AI services revenue is nothing short of stellar, and is helping to bolster Intel stock even higher, the figure is still dwarfed by Intel’s main semiconductor business, which routinely pulls in revenue in excess of $50 billion annually.

Dow Jones technical outlook

Dow Jones tapped into a fresh all-time high of 40,260.24 on Friday, climbing over 400 points as broader markets surge higher. DJIA climbed over a full percent through the last session of the trading week, and the Dow Jones is now up over 6% from the last notable swing low into the 38,000.00 handle in late May.

The Dow Jones index, posting fresh record peak bids, is now up 6.82% in 2024, and has climbed an impressive 24.59% from the index’s swing low into 32,300.00 in late 2023. Daily candles are trading well above the 200-day Exponential Moving Average (EMA) at 37,733.00, and bidders will be looking to put distance between bids and the nearest technical floor priced in at the 50-day EMA near 39,095.00.

Dow Jones five minute chart

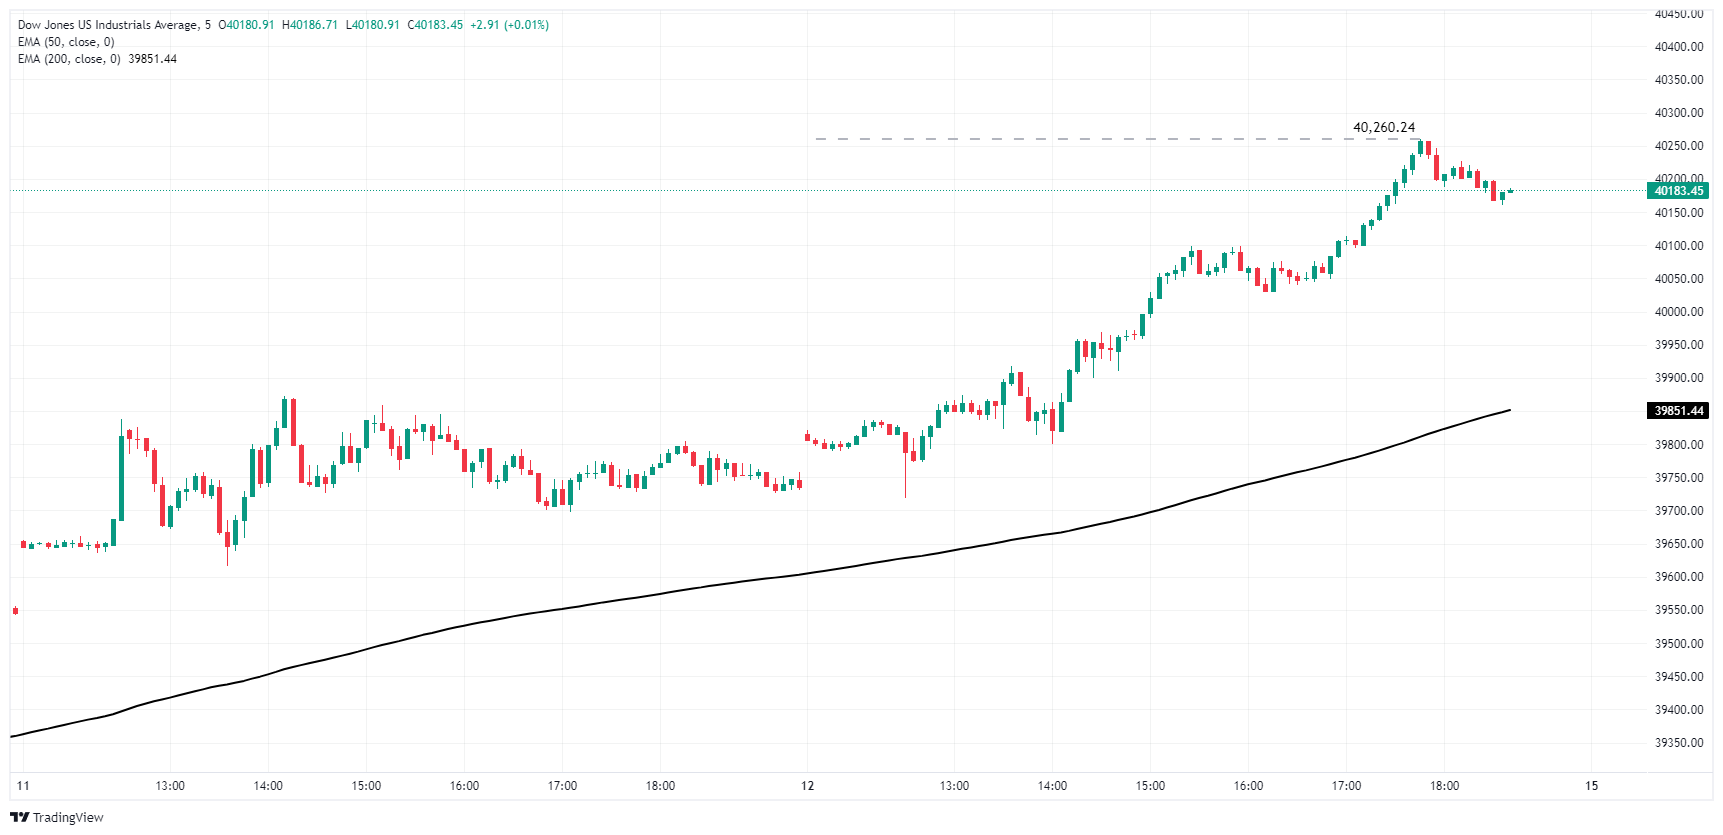
Dow Jones daily chart
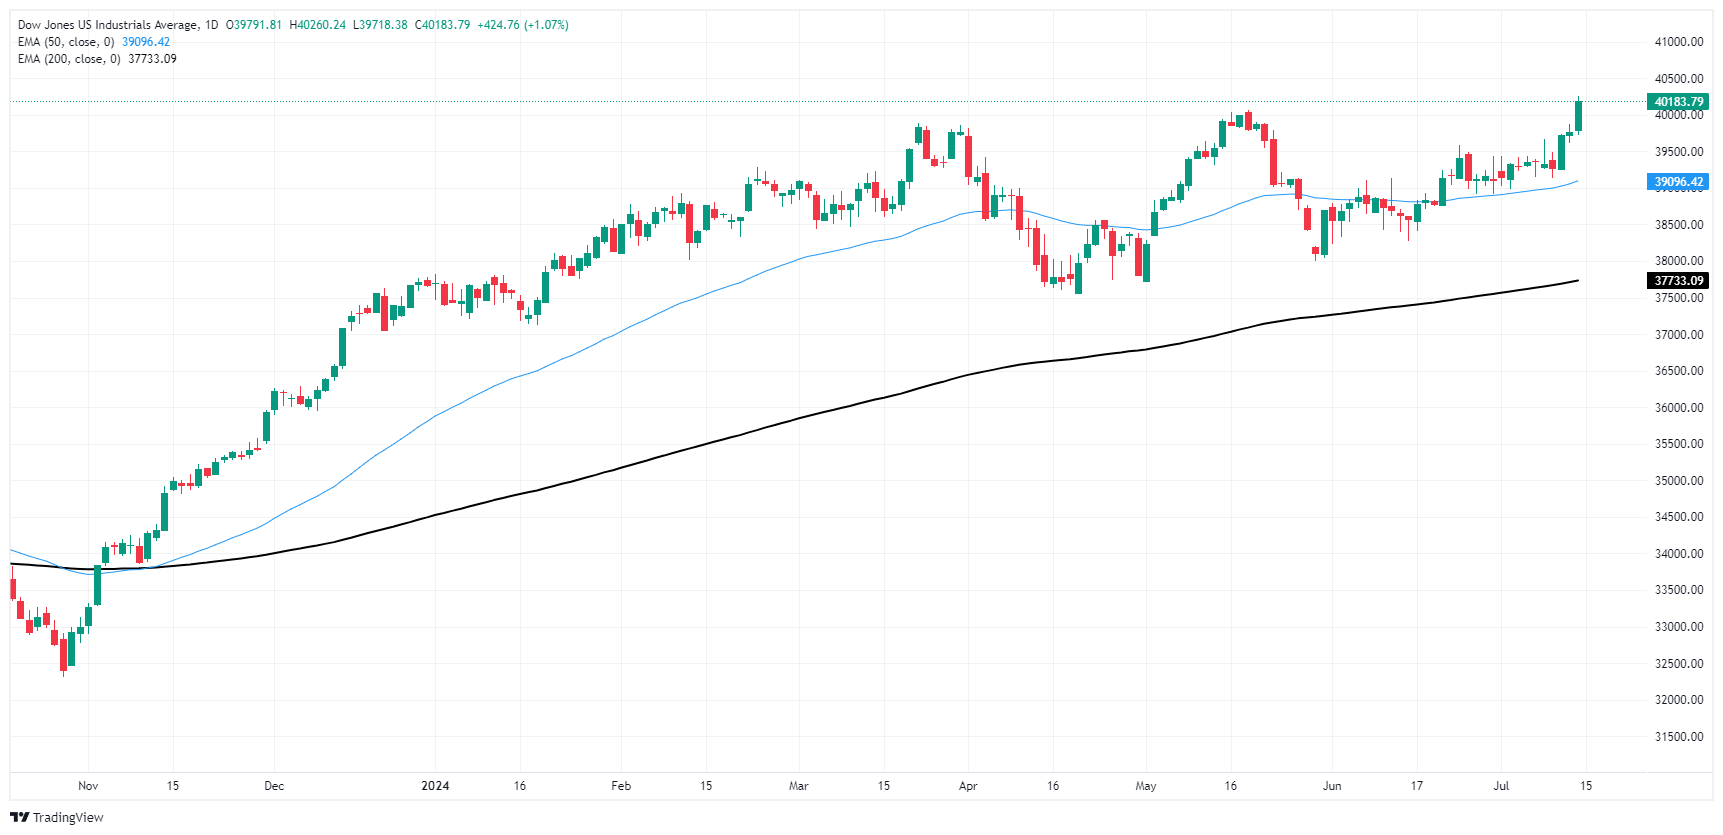
Dow Jones FAQs

The Dow Jones Industrial Average, one of the oldest stock market indices in the world, is compiled of the 30 most traded stocks in the US. The index is price-weighted rather than weighted by capitalization. It is calculated by summing the prices of the constituent stocks and dividing them by a factor, currently 0.152. The index was founded by Charles Dow, who also founded the Wall Street Journal. In later years it has been criticized for not being broadly representative enough because it only tracks 30 conglomerates, unlike broader indices such as the S&P 500.

Many different factors drive the Dow Jones Industrial Average (DJIA). The aggregate performance of the component companies revealed in quarterly company earnings reports is the main one. US and global macroeconomic data also contributes as it impacts on investor sentiment. The level of interest rates, set by the Federal Reserve (Fed), also influences the DJIA as it affects the cost of credit, on which many corporations are heavily reliant. Therefore, inflation can be a major driver as well as other metrics which impact the Fed decisions.

Dow Theory is a method for identifying the primary trend of the stock market developed by Charles Dow. A key step is to compare the direction of the Dow Jones Industrial Average (DJIA) and the Dow Jones Transportation Average (DJTA) and only follow trends where both are moving in the same direction. Volume is a confirmatory criteria. The theory uses elements of peak and trough analysis. Dow’s theory posits three trend phases: accumulation, when smart money starts buying or selling; public participation, when the wider public joins in; and distribution, when the smart money exits.

There are a number of ways to trade the DJIA. One is to use ETFs which allow investors to trade the DJIA as a single security, rather than having to buy shares in all 30 constituent companies. A leading example is the SPDR Dow Jones Industrial Average ETF (DIA). DJIA futures contracts enable traders to speculate on the future value of the index and Options provide the right, but not the obligation, to buy or sell the index at a predetermined price in the future. Mutual funds enable investors to buy a share of a diversified portfolio of DJIA stocks thus providing exposure to the overall index.


Haftungsausschluss: Nur zu Informationszwecken. Die bisherige Performance ist kein verlässlicher Indikator für zukünftige Ergebnisse.
placeholder
Top 10 Krypto-Prognosen für 2026: Institutionelle Nachfrage und Großbanken könnten Bitcoin Rückenwind gebenFür 2026 rücken institutionelle Nachfrage, ETF-Flows (über $700 million Abflüsse im Dezember), BTC-Reserve-Asset-Thesen (3.74 million BTC bei 251 Entities) und zehn Marktprognosen in den Fokus – inklusive eines möglichen Bitcoin-Ziels von $140,259 bei bullischem Ausbruch.
Autor  Mitrade Team
22.Dez. 2025
Für 2026 rücken institutionelle Nachfrage, ETF-Flows (über $700 million Abflüsse im Dezember), BTC-Reserve-Asset-Thesen (3.74 million BTC bei 251 Entities) und zehn Marktprognosen in den Fokus – inklusive eines möglichen Bitcoin-Ziels von $140,259 bei bullischem Ausbruch.
placeholder
XRP wackelt erneut: Drei Signale, die den nächsten Rücksetzer auslösen könntenXRP stabilisiert sich am Montag nahe 1,90 US-Dollar nach dem Dip auf 1,81, doch sinkende XRPL-Aktivität (45.000), ein Einbruch profitabler Bestände (50,4%) und fallendes Open Interest (3,26 Mrd. USD) halten das Risiko einer Korrektur bis 1,61 US-Dollar hoch, während Widerstände bei 2,03/2,16/2,29 US-Dollar liegen.
Autor  Mitrade Team
Di. 27.Jan
XRP stabilisiert sich am Montag nahe 1,90 US-Dollar nach dem Dip auf 1,81, doch sinkende XRPL-Aktivität (45.000), ein Einbruch profitabler Bestände (50,4%) und fallendes Open Interest (3,26 Mrd. USD) halten das Risiko einer Korrektur bis 1,61 US-Dollar hoch, während Widerstände bei 2,03/2,16/2,29 US-Dollar liegen.
placeholder
Krypto-Ausblick: Bitcoin stabilisiert sich über 87.787 US-Dollar – Ether vor der nächsten Hürde, XRP bleibt fragil• Bitcoin pendelt am Mittwoch um 89.000 US-Dollar und hat sich nach der Vorwochenkorrektur bislang um knapp 3% erholt – entscheidend bleibt die Zone um 87.787 US-Dollar. • Ethereum arbeitet sich an die Widerstandszone heran: Erst ein Tagesschluss über 3.017 US-Dollar und der 50-Tage-EMA bei 3.101 US-Dollar würde den Weg nach oben freimachen. • XRP prallt von 1,83 US-Dollar ab und steht wieder bei 1,90 US-Dollar – doch RSI und MACD sprechen weiter für Vorsicht. Nach der kräftigen Korrektur der vergangenen Woche setzt sich im Kryptomarkt eine vorsichtige Stabilisierung durch. Bitcoin, Ether und XRP bauen ihre Erholung aus, stoßen nun aber auf charttechnisch wichtige Marken, an denen sich entscheidet, ob aus der Gegenbewegung mehr wird – oder ob der nächste Rücksetzer folgt. Bitcoin: 87.787 US-Dollar bleibt der Dreh- und Angelpunkt Bitcoin hat am Montag nach der 7,48%-Korrektur der Vorwoche wieder oberhalb der Mittellinie eines horizontalen Parallelkanals bei 87.787 US-Dollar geschlossen. Am Dienstag verteidigte der Kurs diese Zone erneut, am Mittwoch notiert BTC bei rund 89.300 US-Dollar. Hält 87.787 US-Dollar als Support, rückt die obere Begrenzung des Musters bei 90.000 US-Dollar in den Fokus. Der RSI (Tag) liegt bei 45 und steigt in Richtung der neutralen 50 – ein Hinweis auf nachlassenden Verkaufsdruck. Auch der MACD entspannt sich: Die Linien nähern sich an, die roten Histogrammbalken unterhalb der Nulllinie werden schwächer. Bricht Bitcoin dagegen per Tagesschluss wieder unter 87.787 US-Dollar, bleibt die Unterseite anfällig – dann würde die nächste Auffangzone bei 85.569 US-Dollar (zugleich 78,6% Fibonacci-Retracement) wieder relevant. Ethereum: Erst über 3.017 und 3.101 US-Dollar wird es konstruktiver Ethereum startete positiv in die Woche und legte bis Dienstag um 7,62% zu – nach der 14,22%-Korrektur in der Woche davor. Am Mittwoch nähert sich ETH dem zentralen Widerstand bei 3.017 US-Dollar. Für ein klareres Erholungssignal braucht es mehr als nur Intraday-Stärke: Ein Ausbruch über 3.017 US-Dollar und ein Tagesschluss über dem 50-Tage-EMA bei 3.101 US-Dollar könnten den Blick in Richtung des Hochs vom 14. Januar bei 3.402 US-Dollar lenken. Die Momentum-Indikatoren (RSI und MACD) deuten zwar auf nachlassenden Abwärtsdruck hin, aber das Setup bleibt empfindlich. Kommt es stattdessen zu einer erneuten Abweisung an der Widerstandszone, rückt auf der Unterseite das 61,8% Fibonacci-Retracement bei 2.749 US-Dollar wieder ins Blickfeld. XRP: Rebound ja – Trendwende noch nicht XRP hat am Sonntag die tägliche Unterstützung bei 1,83 US-Dollar getestet und anschließend binnen zwei Tagen um 4,51% zugelegt. Am Mittwoch handelt der Kurs bei 1,90 US-Dollar. Solange 1,83 US-Dollar hält, kann sich die Erholung in Richtung des nächsten Widerstands bei 1,96 US-Dollar fortsetzen. Allerdings ist der Unterton noch nicht gedreht: Der RSI liegt bei 42 und damit weiter unter der neutralen 50. Zudem bleibt das Bild im MACD belastet – das bärische Crossover der Vorwoche ist weiterhin aktiv, was das Rückschlagrisiko erhöht. Fällt XRP per Tagesschluss erneut unter 1,83 US-Dollar, wäre ein weiterer Abwärtsimpuls bis zum Tief vom 19. Dezember bei 1,77 US-Dollar wieder ein realistisches Szenario.
Autor  Mitrade Team
Mi. 28.Jan
• Bitcoin pendelt am Mittwoch um 89.000 US-Dollar und hat sich nach der Vorwochenkorrektur bislang um knapp 3% erholt – entscheidend bleibt die Zone um 87.787 US-Dollar. • Ethereum arbeitet sich an die Widerstandszone heran: Erst ein Tagesschluss über 3.017 US-Dollar und der 50-Tage-EMA bei 3.101 US-Dollar würde den Weg nach oben freimachen. • XRP prallt von 1,83 US-Dollar ab und steht wieder bei 1,90 US-Dollar – doch RSI und MACD sprechen weiter für Vorsicht. Nach der kräftigen Korrektur der vergangenen Woche setzt sich im Kryptomarkt eine vorsichtige Stabilisierung durch. Bitcoin, Ether und XRP bauen ihre Erholung aus, stoßen nun aber auf charttechnisch wichtige Marken, an denen sich entscheidet, ob aus der Gegenbewegung mehr wird – oder ob der nächste Rücksetzer folgt. Bitcoin: 87.787 US-Dollar bleibt der Dreh- und Angelpunkt Bitcoin hat am Montag nach der 7,48%-Korrektur der Vorwoche wieder oberhalb der Mittellinie eines horizontalen Parallelkanals bei 87.787 US-Dollar geschlossen. Am Dienstag verteidigte der Kurs diese Zone erneut, am Mittwoch notiert BTC bei rund 89.300 US-Dollar. Hält 87.787 US-Dollar als Support, rückt die obere Begrenzung des Musters bei 90.000 US-Dollar in den Fokus. Der RSI (Tag) liegt bei 45 und steigt in Richtung der neutralen 50 – ein Hinweis auf nachlassenden Verkaufsdruck. Auch der MACD entspannt sich: Die Linien nähern sich an, die roten Histogrammbalken unterhalb der Nulllinie werden schwächer. Bricht Bitcoin dagegen per Tagesschluss wieder unter 87.787 US-Dollar, bleibt die Unterseite anfällig – dann würde die nächste Auffangzone bei 85.569 US-Dollar (zugleich 78,6% Fibonacci-Retracement) wieder relevant. Ethereum: Erst über 3.017 und 3.101 US-Dollar wird es konstruktiver Ethereum startete positiv in die Woche und legte bis Dienstag um 7,62% zu – nach der 14,22%-Korrektur in der Woche davor. Am Mittwoch nähert sich ETH dem zentralen Widerstand bei 3.017 US-Dollar. Für ein klareres Erholungssignal braucht es mehr als nur Intraday-Stärke: Ein Ausbruch über 3.017 US-Dollar und ein Tagesschluss über dem 50-Tage-EMA bei 3.101 US-Dollar könnten den Blick in Richtung des Hochs vom 14. Januar bei 3.402 US-Dollar lenken. Die Momentum-Indikatoren (RSI und MACD) deuten zwar auf nachlassenden Abwärtsdruck hin, aber das Setup bleibt empfindlich. Kommt es stattdessen zu einer erneuten Abweisung an der Widerstandszone, rückt auf der Unterseite das 61,8% Fibonacci-Retracement bei 2.749 US-Dollar wieder ins Blickfeld. XRP: Rebound ja – Trendwende noch nicht XRP hat am Sonntag die tägliche Unterstützung bei 1,83 US-Dollar getestet und anschließend binnen zwei Tagen um 4,51% zugelegt. Am Mittwoch handelt der Kurs bei 1,90 US-Dollar. Solange 1,83 US-Dollar hält, kann sich die Erholung in Richtung des nächsten Widerstands bei 1,96 US-Dollar fortsetzen. Allerdings ist der Unterton noch nicht gedreht: Der RSI liegt bei 42 und damit weiter unter der neutralen 50. Zudem bleibt das Bild im MACD belastet – das bärische Crossover der Vorwoche ist weiterhin aktiv, was das Rückschlagrisiko erhöht. Fällt XRP per Tagesschluss erneut unter 1,83 US-Dollar, wäre ein weiterer Abwärtsimpuls bis zum Tief vom 19. Dezember bei 1,77 US-Dollar wieder ein realistisches Szenario.
placeholder
Solana unter Druck: SOL rutscht weiter ab und steuert auf Schlüsselstütze bei $116 zuSolana (SOL) fällt am Donnerstag rund 2% und nähert sich der Schlüsselstütze bei $116; sinkendes Open Interest ($7,42 Mrd.), negative Funding Rate (-0,0042%) und Long-Liquidationen erhöhen das Risiko eines Rutsches Richtung $100 und $95.
Autor  Mitrade Team
Do. 29.Jan
Solana (SOL) fällt am Donnerstag rund 2% und nähert sich der Schlüsselstütze bei $116; sinkendes Open Interest ($7,42 Mrd.), negative Funding Rate (-0,0042%) und Long-Liquidationen erhöhen das Risiko eines Rutsches Richtung $100 und $95.
placeholder
Cardano rutscht unter $0,36: Geopolitische Spannungen belasten RisikoassetsCardano (ADA) fällt am Donnerstag unter $0,36 und handelt bei $0,35; US-Iran-Spannungen und ein Long-to-Short-Ratio von 0,71 erhöhen das Risiko eines Tests von $0,32 (31. Dezember) und darunter $0,27 (10. Oktober).
Autor  Mitrade Team
Do. 29.Jan
Cardano (ADA) fällt am Donnerstag unter $0,36 und handelt bei $0,35; US-Iran-Spannungen und ein Long-to-Short-Ratio von 0,71 erhöhen das Risiko eines Tests von $0,32 (31. Dezember) und darunter $0,27 (10. Oktober).
verbundene Finanzinstrumente
goTop
quote