

Gold cycles up towards all-time-highs
- Gold trades close to its $2,531 all-time-high amid expectations of the Fed cutting interest rates and a weak US Dollar.
- The size of the Fed’s cut at its September meeting will impact Gold.
- US CPI data on Wednesday could influence the Fed’s decision.
Gold (XAU/USD) cycles back up towards the top of its three-week range, trading just shy of $2,530 on Wednesday. The precious metal keeps oscillating as investors debate the size of the cut the Federal Reserve (Fed) will make to interest rates at its September 17-18 meeting. Whilst a standard 25 basis points (bps) – or 0.25% – cut is now to be expected, some believe the Fed could opt for a larger 50 bps cut. The latter would boost the attractiveness of Gold in comparison with other assets because it is a non-interest-paying asset.
Friday’s mixed US NonFarm Payrolls release failed to settle the interest-rate-cut-size question. On Wednesday, US Consumer Price Index (CPI) data for August would normally be expected to heavily influence Fed expectations. However, analysts vary in the extent to which they expect the data to have an impact this time – some say inflation has fallen so low now that it is irrelevant.
“The (CPI) figure is no longer as overwhelmingly important as it was a few months ago,” says Ulricht Leutchmann, FX Analyst at Commerzbank. “The fight against inflation has seemingly been won. In the last three months, core consumer price inflation was a meager 1.6% (annualized) – well below levels that would be compatible with the Fed's target,” he adds.
On the other hand, Elias Haddad, Senior Markets Strategist at Brown Brothers Harriman (BBH), says: “Higher than expected US inflation in August can reduce the probability of a jumbo Fed funds rate cut in September and underpin a firmer USD.”
Deutsche Bank’s Jim Reid, meanwhile, makes the point that an important deflationary factor is the steep fall in crude Oil prices over recent days, with WTI crude Oil now trading in the mid $60s per barrel. “From the Fed’s perspective, one trend that’s helping to remove inflationary pressures has been the sharp decline in Oil prices over recent weeks,” he says in his “Early Morning Reid.”
Gold helped higher by weaker US Dollar
Gold is gaining further uplift from a weaker US Dollar (USD), to which it is negatively correlated (the yellow metal is mostly priced and traded in USD).
The Greenback is being dragged down by the outcome of the Trump-Harris presidential election debate. According to most analysts, Vice President Kamala Harris came out on top, so the market is discounting former President Donald Trump’s policies to maintain the US Dollar as the world’s reserve currency by penalizing countries who refuse to use it with tariffs.
That said, the effect is likely to be counterbalanced given the former president is also known to advocate for a weaker Dollar because it helps US exports.
On the geopolitical risk front, Israel continues bombing civilian areas in Gaza, and protests by the populace calling for a ceasefire so hostages can be released appear to be falling on deaf ears. The attack on the Al-Mawasi camp, which killed dozens at the start of the week, has drawn condemnation from the international community and snuffed out US efforts at brokering a ceasefire deal.
In the other hotspot, the news of a Ukrainian drone attack on Moscow has probably only ratcheted up tensions, which, if anything, might be increasing safe-haven demand for Gold.
Technical Analysis: Gold targets top-of-range and all-time-highs
Gold (XAU/USD) rises towards the top of its sideways range. It is now closing in on the all-time high of $2,531. A break above would extend the precious metal’s uptrend.
XAU/USD 4-hour Chart
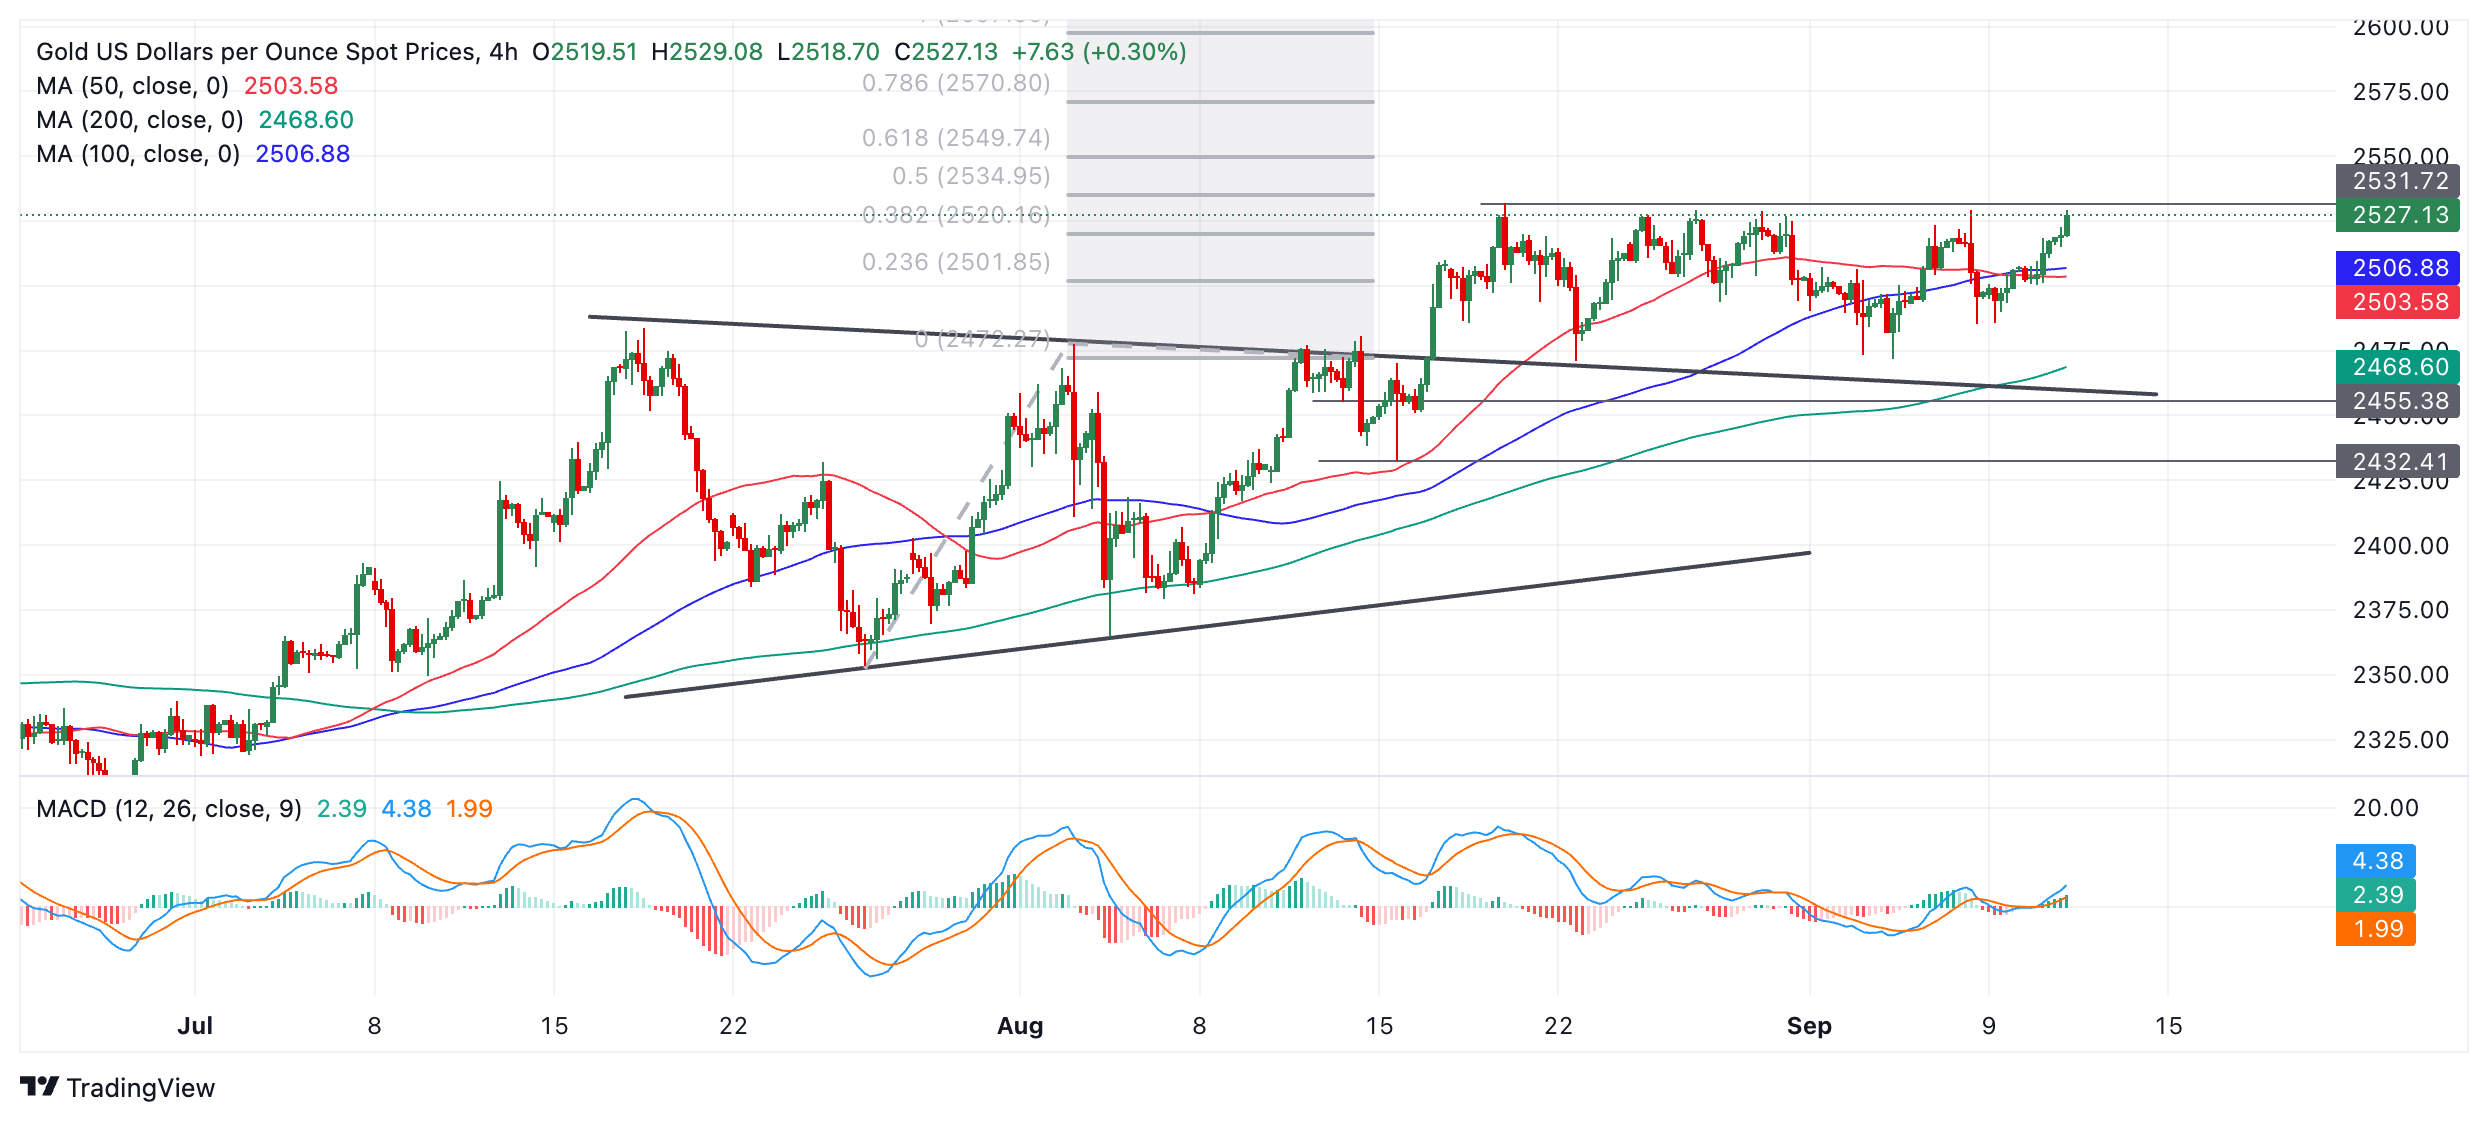
Alternatively, it is quite possible the yellow metal will continue trading up and down within its multi-week range between the $2,480s and the $2,531 record high.
The longer-term trend for Gold is bullish, however, and since “the trend is your friend,” this increases the odds of an eventual breakout higher materializing.
The precious metal has an as-yet unreached bullish target at $2,550, generated after the original breakout from the July-August range on August 14. It will probably finally reach its goal in the end, assuming the uptrend survives.
A break above the August 20 all-time high of $2,531 would provide more confirmation of a continuation higher toward the $2,550 target.
If Gold closes below $2,460, however, it would change the picture and bring the bullish bias into question.
Economic Indicator
Consumer Price Index (YoY)
Inflationary or deflationary tendencies are measured by periodically summing the prices of a basket of representative goods and services and presenting the data as The Consumer Price Index (CPI). CPI data is compiled on a monthly basis and released by the US Department of Labor Statistics. The YoY reading compares the prices of goods in the reference month to the same month a year earlier.The CPI is a key indicator to measure inflation and changes in purchasing trends. Generally speaking, a high reading is seen as bullish for the US Dollar (USD), while a low reading is seen as bearish.
Read more.Next release: Wed Sep 11, 2024 12:30
Frequency: Monthly
Consensus: 2.6%
Previous: 2.9%
Source: US Bureau of Labor Statistics
The US Federal Reserve has a dual mandate of maintaining price stability and maximum employment. According to such mandate, inflation should be at around 2% YoY and has become the weakest pillar of the central bank’s directive ever since the world suffered a pandemic, which extends to these days. Price pressures keep rising amid supply-chain issues and bottlenecks, with the Consumer Price Index (CPI) hanging at multi-decade highs. The Fed has already taken measures to tame inflation and is expected to maintain an aggressive stance in the foreseeable future.
Empfohlene Artikel


