Gold trades volatile but range bound after US Nonfarm Payrolls

Quelle Fxstreet
  • Gold trades up and down within a range under its record highs. 
  • US labor market data caused some volatile moves, but the sideways trend holds. 
  • US inflation data this week could impact Gold as the next Federal Reserve meeting nears. 

Gold (XAU/USD) pulls back down to just below $2,500 per troy ounce on Monday after retesting its all-time highs on Friday, amid market volatility following the release of a mixed US Nonfarm Payrolls (NFP) employment report. 

Gold rises then falls after US Nonfarm Payrolls

Gold rose immediately after the NFP release on Friday, as the headline figure showed the US economy added fewer jobs than expected in August, and July and June’s figures were revised down. The data indicated that the labor market was softening overall and that, therefore, there was a greater chance the Federal Reserve (Fed) would need to make a larger 0.50% cut to interest rates rather than the standard 0.25% in September. Lower interest rates are positive for Gold as they reduce the opportunity cost of holding non-interest-bearing assets. 

The precious metal failed to hold its gains, however, as traders processed the rest of the data in the report and its implications for interest rates going forward. The Unemployment Rate, for example, was shown to have actually fallen to 4.2% from 4.3% as anticipated, and wage growth increased by 0.4% in the month, exceeding the forecasted 0.3%. This suggested the labor market was not in as bad shape as first thought and that wage inflation was rising. As a result of the report, the market-based probabilities of the Fed cutting interest rates by 0.50% actually ended up falling from around 40% to about 30%. 

As a result, Gold eventually rolled over and ended the week back down at around the $2,500 mark, before inching slightly lower into the $2,490s on Monday. 

Gold remains supported, however, by persistent concerns about the outlook for the US economy. Fed Governor Christopher Waller said on Friday that it was now appropriate to start cutting interest rates to keep the economy’s “forward momentum” intact and because the labor market was showing signs of “softening” but – he added – not “deteriorating”. Waller also said he would be in favor of “front-loading cuts”, keeping alive the possibility of a non-standard 0.50% reduction. 

US Consumer Price Index (CPI) and Producer Price Index (PPI) data out this week could further color the outlook for interest rates, although analysts are mixed as to how much, with some, such as Deutsche Bank’s Head of Macro Research, Jim Reid, playing down the importance of inflation compared to employment data. 

“Wednesday's US CPI and Thursday's PPI will probably help move that debate on, but it seems employment is more important at the moment and Friday's mixed employment report had arguments for both sides, so the swing factor is probably how the committee view labor markets rather than inflation,” said Reid in his “Early Morning Reid” macro note.   

Data from the People’s Bank of China (PBoC) continued to show no increase in the bank’s Gold reserves as it has continued its halt on buying since May. 

On the geopolitical front, a ceasefire deal between Israel and Hamas seems even less likely after a gunman from Jordan shot dead three Israelis at a border crossing in the West Bank, in the first such killing since the October 7 terrorist attack.  

In Ukraine, Russia continues its advance towards the key strategic hub city of Pokrovsk. If successful, it could dramatically impact the war on the eastern front and threaten Ukraine’s whole defensive line in the Donbass. Such an outcome, though still unlikely to occur soon, would nevertheless ratchet up tensions in the region and increase demand for Gold. The Central Bank of Poland (NBP), for example, has been hoarding Gold since the war began, according to data from the World Gold Council (WGC). 

Technical Analysis: Continues trading within a range 

Gold (XAU/USD) continues trading in a sideways range between the all-time highs of $2,531 and a floor at around the $2,475 level. It is currently plum in the centre of the range. 

XAU/USD 4-hour Chart

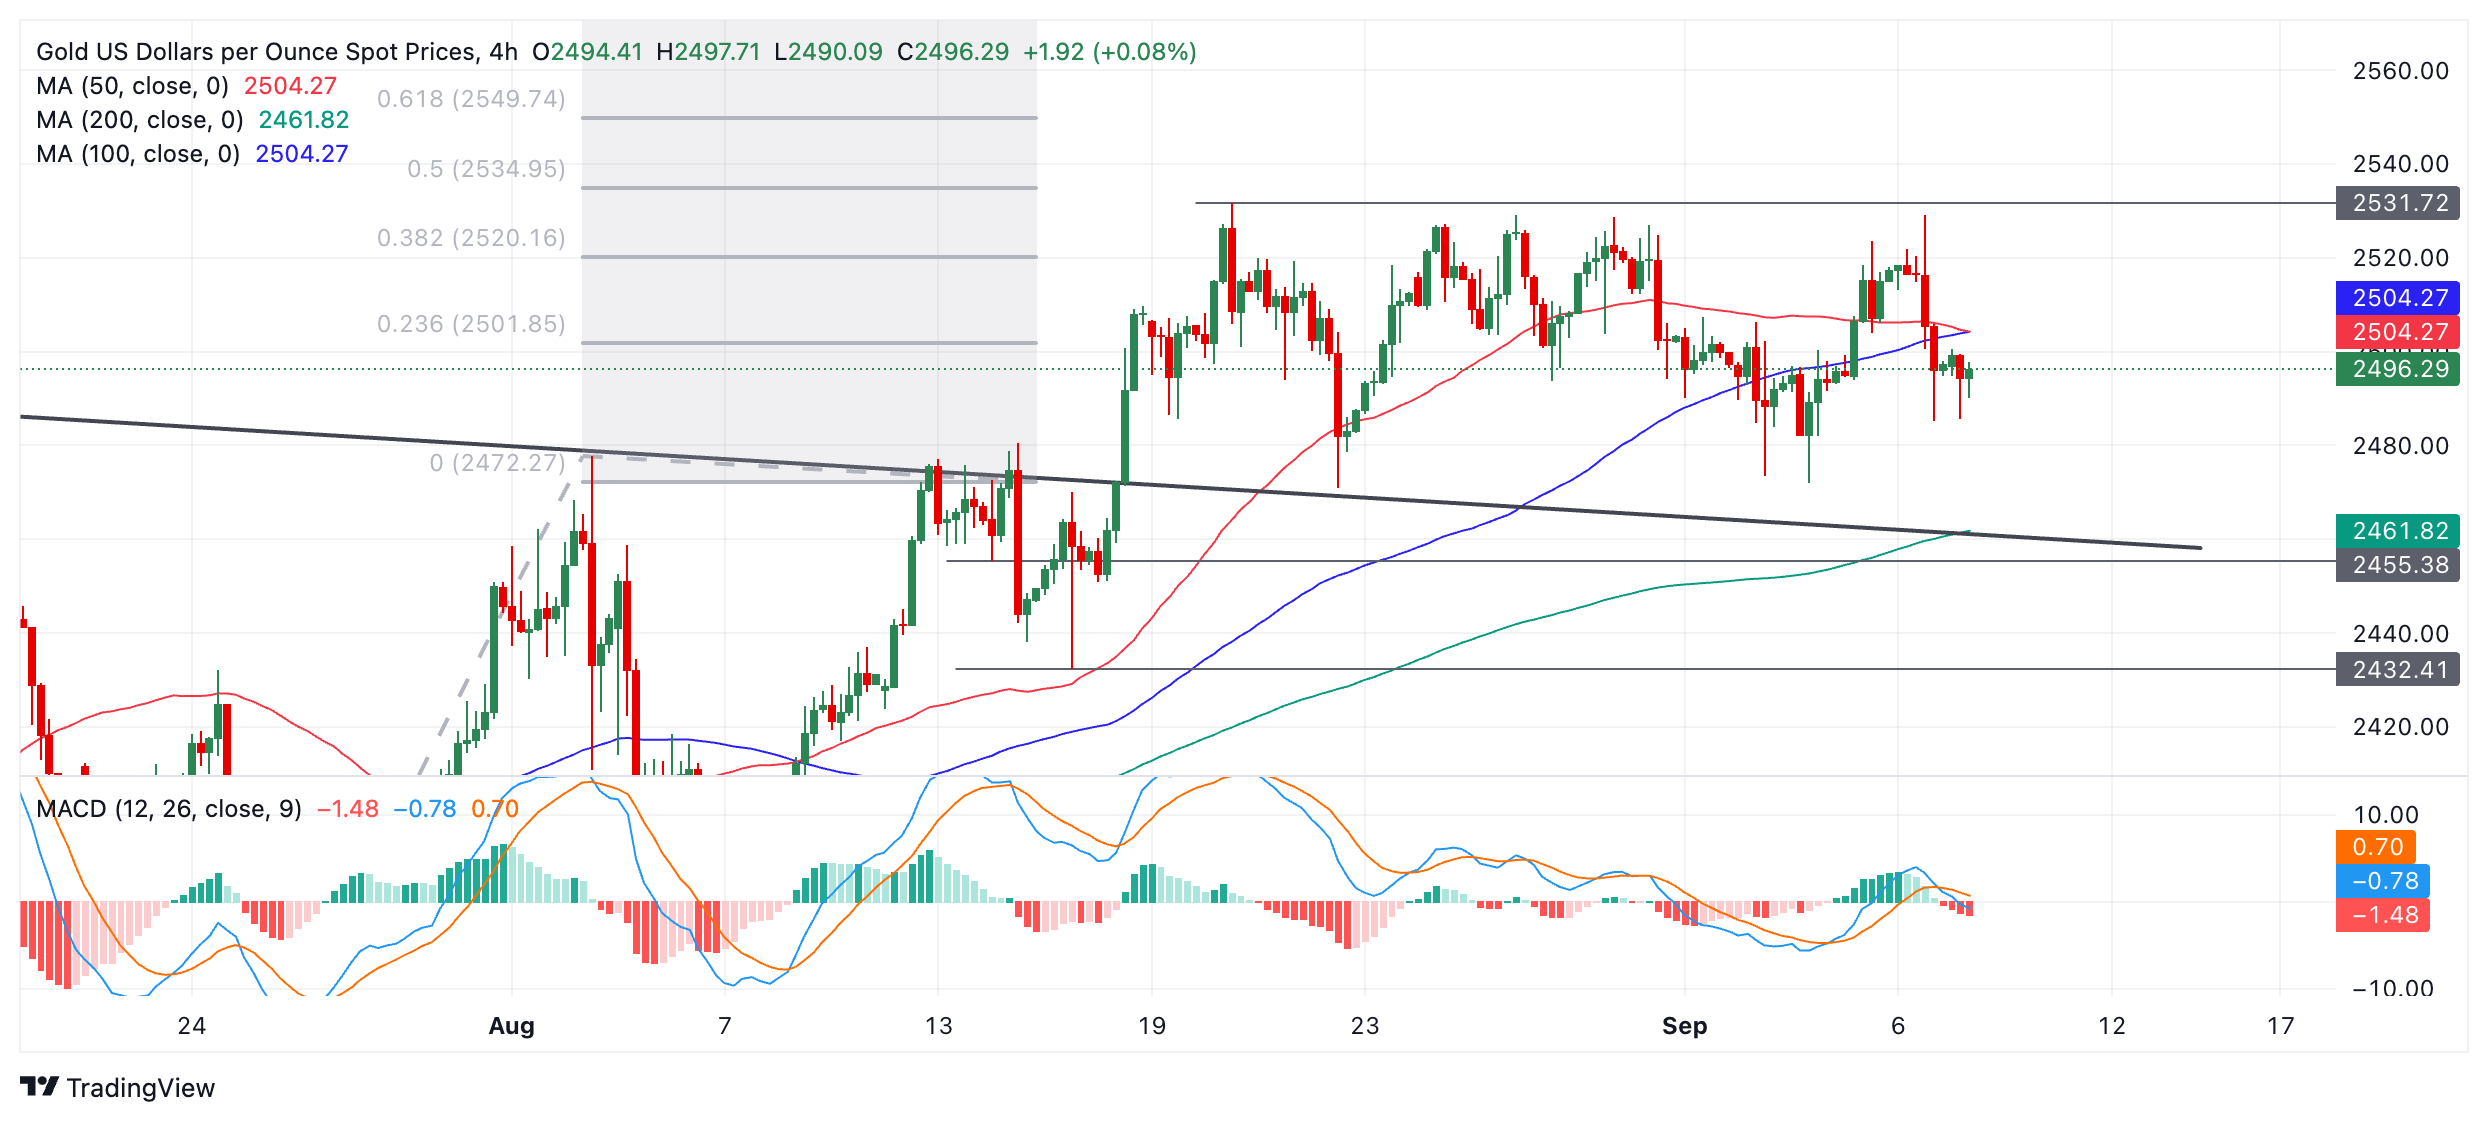
The yellow metal will probably continue trading up and down within this range until it breaks decisively out of one side or another. 

A decisive break would be one accompanied by a long green or red candle that broke clearly through the level and closed near its highs or lows, or three candles in a row of the same candle that pierced the level.  

However, the longer-term trend of Gold is bullish, slightly enhancing the odds of an upside breakout. Gold has an as-yet unreached bullish target at $2,550, generated after the original breakout from the July-August range on August 14. It will probably finally reach its goal in the end, assuming the uptrend resumes. 

A break above the August 20 all-time high of $2,531 would provide more confirmation of a continuation higher toward the $2,550 target.  

If Gold continues steadily weakening, however, a decisive break below the range floor and a close below $2,460 would change the picture and suggest that the commodity might be starting a more pronounced downtrend. 

Economic Indicator

Consumer Price Index (YoY)

Inflationary or deflationary tendencies are measured by periodically summing the prices of a basket of representative goods and services and presenting the data as The Consumer Price Index (CPI). CPI data is compiled on a monthly basis and released by the US Department of Labor Statistics. The YoY reading compares the prices of goods in the reference month to the same month a year earlier.The CPI is a key indicator to measure inflation and changes in purchasing trends. Generally speaking, a high reading is seen as bullish for the US Dollar (USD), while a low reading is seen as bearish.

Read more.

Next release: Wed Sep 11, 2024 12:30

Frequency: Monthly

Consensus: 2.6%

Previous: 2.9%

Source: US Bureau of Labor Statistics

The US Federal Reserve has a dual mandate of maintaining price stability and maximum employment. According to such mandate, inflation should be at around 2% YoY and has become the weakest pillar of the central bank’s directive ever since the world suffered a pandemic, which extends to these days. Price pressures keep rising amid supply-chain issues and bottlenecks, with the Consumer Price Index (CPI) hanging at multi-decade highs. The Fed has already taken measures to tame inflation and is expected to maintain an aggressive stance in the foreseeable future.


Haftungsausschluss: Nur zu Informationszwecken. Die bisherige Performance ist kein verlässlicher Indikator für zukünftige Ergebnisse.
placeholder
Silberpreis heute: Silber steigt laut FXStreet-DatenDie Preise für Silber (XAG/USD) stiegen am Montag, wie aus FXStreet-Daten hervorgeht. Der Silberpreis liegt bei 109,94 USD pro Unze, was einem Anstieg von 7,28 % gegenüber den 102,48 USD vom Freitag entspricht
Autor  FXStreet
Mo. 26.Jan
Die Preise für Silber (XAG/USD) stiegen am Montag, wie aus FXStreet-Daten hervorgeht. Der Silberpreis liegt bei 109,94 USD pro Unze, was einem Anstieg von 7,28 % gegenüber den 102,48 USD vom Freitag entspricht
placeholder
Silber steigt in Asien auf 113,50 US-Dollar – Safe-Haven-Nachfrage und Fed im FokusSilber (XAG/USD) steigt am Mittwoch in Asien auf 113,50 US-Dollar (+1,30%), gestützt von Dollar-Schwäche, Safe-Haven-Nachfrage und Zinssenkungsfantasie, während die Fed-Entscheidung und mögliche Gewinnmitnahmen nach über 200% Jahresplus im Fokus stehen.
Autor  Mitrade Team
Mi. 28.Jan
Silber (XAG/USD) steigt am Mittwoch in Asien auf 113,50 US-Dollar (+1,30%), gestützt von Dollar-Schwäche, Safe-Haven-Nachfrage und Zinssenkungsfantasie, während die Fed-Entscheidung und mögliche Gewinnmitnahmen nach über 200% Jahresplus im Fokus stehen.
placeholder
Krypto-Ausblick: Bitcoin stabilisiert sich über 87.787 US-Dollar – Ether vor der nächsten Hürde, XRP bleibt fragil• Bitcoin pendelt am Mittwoch um 89.000 US-Dollar und hat sich nach der Vorwochenkorrektur bislang um knapp 3% erholt – entscheidend bleibt die Zone um 87.787 US-Dollar. • Ethereum arbeitet sich an die Widerstandszone heran: Erst ein Tagesschluss über 3.017 US-Dollar und der 50-Tage-EMA bei 3.101 US-Dollar würde den Weg nach oben freimachen. • XRP prallt von 1,83 US-Dollar ab und steht wieder bei 1,90 US-Dollar – doch RSI und MACD sprechen weiter für Vorsicht. Nach der kräftigen Korrektur der vergangenen Woche setzt sich im Kryptomarkt eine vorsichtige Stabilisierung durch. Bitcoin, Ether und XRP bauen ihre Erholung aus, stoßen nun aber auf charttechnisch wichtige Marken, an denen sich entscheidet, ob aus der Gegenbewegung mehr wird – oder ob der nächste Rücksetzer folgt. Bitcoin: 87.787 US-Dollar bleibt der Dreh- und Angelpunkt Bitcoin hat am Montag nach der 7,48%-Korrektur der Vorwoche wieder oberhalb der Mittellinie eines horizontalen Parallelkanals bei 87.787 US-Dollar geschlossen. Am Dienstag verteidigte der Kurs diese Zone erneut, am Mittwoch notiert BTC bei rund 89.300 US-Dollar. Hält 87.787 US-Dollar als Support, rückt die obere Begrenzung des Musters bei 90.000 US-Dollar in den Fokus. Der RSI (Tag) liegt bei 45 und steigt in Richtung der neutralen 50 – ein Hinweis auf nachlassenden Verkaufsdruck. Auch der MACD entspannt sich: Die Linien nähern sich an, die roten Histogrammbalken unterhalb der Nulllinie werden schwächer. Bricht Bitcoin dagegen per Tagesschluss wieder unter 87.787 US-Dollar, bleibt die Unterseite anfällig – dann würde die nächste Auffangzone bei 85.569 US-Dollar (zugleich 78,6% Fibonacci-Retracement) wieder relevant. Ethereum: Erst über 3.017 und 3.101 US-Dollar wird es konstruktiver Ethereum startete positiv in die Woche und legte bis Dienstag um 7,62% zu – nach der 14,22%-Korrektur in der Woche davor. Am Mittwoch nähert sich ETH dem zentralen Widerstand bei 3.017 US-Dollar. Für ein klareres Erholungssignal braucht es mehr als nur Intraday-Stärke: Ein Ausbruch über 3.017 US-Dollar und ein Tagesschluss über dem 50-Tage-EMA bei 3.101 US-Dollar könnten den Blick in Richtung des Hochs vom 14. Januar bei 3.402 US-Dollar lenken. Die Momentum-Indikatoren (RSI und MACD) deuten zwar auf nachlassenden Abwärtsdruck hin, aber das Setup bleibt empfindlich. Kommt es stattdessen zu einer erneuten Abweisung an der Widerstandszone, rückt auf der Unterseite das 61,8% Fibonacci-Retracement bei 2.749 US-Dollar wieder ins Blickfeld. XRP: Rebound ja – Trendwende noch nicht XRP hat am Sonntag die tägliche Unterstützung bei 1,83 US-Dollar getestet und anschließend binnen zwei Tagen um 4,51% zugelegt. Am Mittwoch handelt der Kurs bei 1,90 US-Dollar. Solange 1,83 US-Dollar hält, kann sich die Erholung in Richtung des nächsten Widerstands bei 1,96 US-Dollar fortsetzen. Allerdings ist der Unterton noch nicht gedreht: Der RSI liegt bei 42 und damit weiter unter der neutralen 50. Zudem bleibt das Bild im MACD belastet – das bärische Crossover der Vorwoche ist weiterhin aktiv, was das Rückschlagrisiko erhöht. Fällt XRP per Tagesschluss erneut unter 1,83 US-Dollar, wäre ein weiterer Abwärtsimpuls bis zum Tief vom 19. Dezember bei 1,77 US-Dollar wieder ein realistisches Szenario.
Autor  Mitrade Team
Mi. 28.Jan
• Bitcoin pendelt am Mittwoch um 89.000 US-Dollar und hat sich nach der Vorwochenkorrektur bislang um knapp 3% erholt – entscheidend bleibt die Zone um 87.787 US-Dollar. • Ethereum arbeitet sich an die Widerstandszone heran: Erst ein Tagesschluss über 3.017 US-Dollar und der 50-Tage-EMA bei 3.101 US-Dollar würde den Weg nach oben freimachen. • XRP prallt von 1,83 US-Dollar ab und steht wieder bei 1,90 US-Dollar – doch RSI und MACD sprechen weiter für Vorsicht. Nach der kräftigen Korrektur der vergangenen Woche setzt sich im Kryptomarkt eine vorsichtige Stabilisierung durch. Bitcoin, Ether und XRP bauen ihre Erholung aus, stoßen nun aber auf charttechnisch wichtige Marken, an denen sich entscheidet, ob aus der Gegenbewegung mehr wird – oder ob der nächste Rücksetzer folgt. Bitcoin: 87.787 US-Dollar bleibt der Dreh- und Angelpunkt Bitcoin hat am Montag nach der 7,48%-Korrektur der Vorwoche wieder oberhalb der Mittellinie eines horizontalen Parallelkanals bei 87.787 US-Dollar geschlossen. Am Dienstag verteidigte der Kurs diese Zone erneut, am Mittwoch notiert BTC bei rund 89.300 US-Dollar. Hält 87.787 US-Dollar als Support, rückt die obere Begrenzung des Musters bei 90.000 US-Dollar in den Fokus. Der RSI (Tag) liegt bei 45 und steigt in Richtung der neutralen 50 – ein Hinweis auf nachlassenden Verkaufsdruck. Auch der MACD entspannt sich: Die Linien nähern sich an, die roten Histogrammbalken unterhalb der Nulllinie werden schwächer. Bricht Bitcoin dagegen per Tagesschluss wieder unter 87.787 US-Dollar, bleibt die Unterseite anfällig – dann würde die nächste Auffangzone bei 85.569 US-Dollar (zugleich 78,6% Fibonacci-Retracement) wieder relevant. Ethereum: Erst über 3.017 und 3.101 US-Dollar wird es konstruktiver Ethereum startete positiv in die Woche und legte bis Dienstag um 7,62% zu – nach der 14,22%-Korrektur in der Woche davor. Am Mittwoch nähert sich ETH dem zentralen Widerstand bei 3.017 US-Dollar. Für ein klareres Erholungssignal braucht es mehr als nur Intraday-Stärke: Ein Ausbruch über 3.017 US-Dollar und ein Tagesschluss über dem 50-Tage-EMA bei 3.101 US-Dollar könnten den Blick in Richtung des Hochs vom 14. Januar bei 3.402 US-Dollar lenken. Die Momentum-Indikatoren (RSI und MACD) deuten zwar auf nachlassenden Abwärtsdruck hin, aber das Setup bleibt empfindlich. Kommt es stattdessen zu einer erneuten Abweisung an der Widerstandszone, rückt auf der Unterseite das 61,8% Fibonacci-Retracement bei 2.749 US-Dollar wieder ins Blickfeld. XRP: Rebound ja – Trendwende noch nicht XRP hat am Sonntag die tägliche Unterstützung bei 1,83 US-Dollar getestet und anschließend binnen zwei Tagen um 4,51% zugelegt. Am Mittwoch handelt der Kurs bei 1,90 US-Dollar. Solange 1,83 US-Dollar hält, kann sich die Erholung in Richtung des nächsten Widerstands bei 1,96 US-Dollar fortsetzen. Allerdings ist der Unterton noch nicht gedreht: Der RSI liegt bei 42 und damit weiter unter der neutralen 50. Zudem bleibt das Bild im MACD belastet – das bärische Crossover der Vorwoche ist weiterhin aktiv, was das Rückschlagrisiko erhöht. Fällt XRP per Tagesschluss erneut unter 1,83 US-Dollar, wäre ein weiterer Abwärtsimpuls bis zum Tief vom 19. Dezember bei 1,77 US-Dollar wieder ein realistisches Szenario.
placeholder
Solana unter Druck: SOL rutscht weiter ab und steuert auf Schlüsselstütze bei $116 zuSolana (SOL) fällt am Donnerstag rund 2% und nähert sich der Schlüsselstütze bei $116; sinkendes Open Interest ($7,42 Mrd.), negative Funding Rate (-0,0042%) und Long-Liquidationen erhöhen das Risiko eines Rutsches Richtung $100 und $95.
Autor  Mitrade Team
Do. 29.Jan
Solana (SOL) fällt am Donnerstag rund 2% und nähert sich der Schlüsselstütze bei $116; sinkendes Open Interest ($7,42 Mrd.), negative Funding Rate (-0,0042%) und Long-Liquidationen erhöhen das Risiko eines Rutsches Richtung $100 und $95.
placeholder
Gold fällt, da die Einigung über die Regierungsfinanzierung den USD stärkt und Gewinnmitnahmen auslöstGold (XAU/USD) erlebt am Freitag zum zweiten Mal in Folge eine starke Liquidation, nachdem es seit Beginn dieses Monats um mehr als 25% parabolisch gestiegen ist und in den letzten zwei Wochen eine Reihe von Rekordhochs erreicht hat.
Autor  FXStreet
Fr. 30.Jan
Gold (XAU/USD) erlebt am Freitag zum zweiten Mal in Folge eine starke Liquidation, nachdem es seit Beginn dieses Monats um mehr als 25% parabolisch gestiegen ist und in den letzten zwei Wochen eine Reihe von Rekordhochs erreicht hat.
verbundene Finanzinstrumente
goTop
quote