EUR/JPY Price Analysis: Slips below 169.00 amid political turmoil

Quelle Fxstreet
  • EUR/JPY trades at 168.43, marking the second consecutive day of losses due to political uncertainty in France.
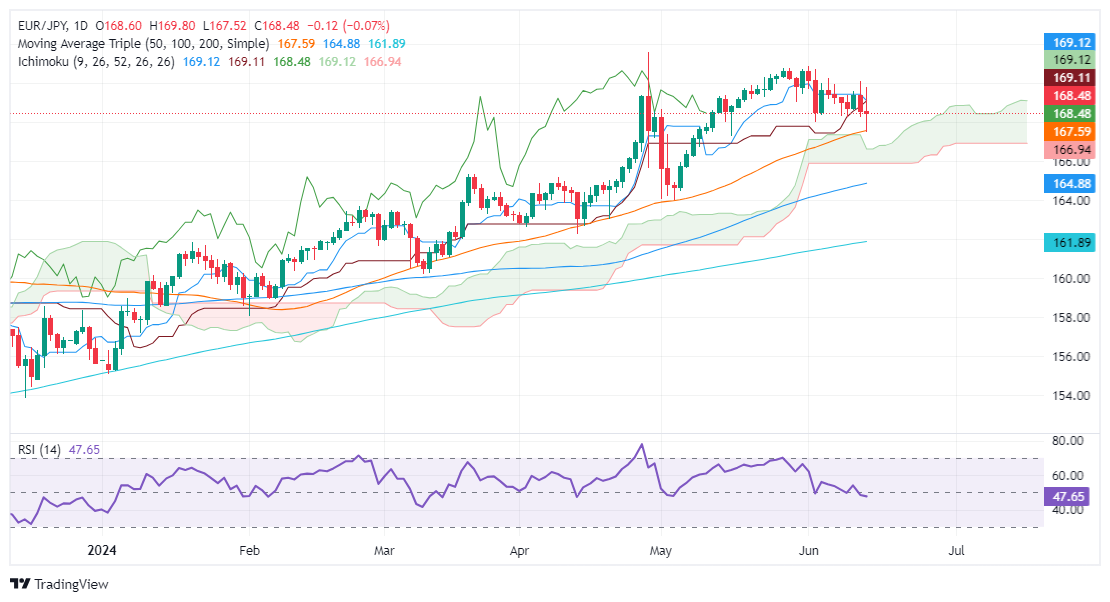
  • Technical outlook: Consolidation below 170.00 with potential further losses if price drops below the 50-DMA at 167.47.
  • Key support levels: Kumo bottom at 165.92 and 100-DMA at 164.78, indicating acceleration of the downtrend if breached.

The Euro tumbled for the second straight day against the Japanese Yen due to political uncertainty. France's presidential approvals plunged to their lowest level in five years ahead of the General Elections. The EUR/JPY trades at 168.43, down 0.08%.

EUR/JPY Price Analysis: Technical outlook

After peaking around 170.00, EUR/JPY has consolidated below this level but remains above the Ichimoku Cloud (Kumo), which would accelerate the downtrend if breached.

The Relative Strength Index (RSI) indicates that sellers are gaining momentum as it falls below the 50-line, suggesting that EUR/JPY could face further losses.

If EUR/JPY drops below the 50-day moving average (DMA) of 167.47, it could trigger a decline into the Kumo, signaling an acceleration of the downtrend. The next support would be the bottom of the Kumo at 165.92, followed by the 100-DMA at 164.78.

EUR/JPY Price Action - Daily Chart

EUR/JPY

Overview
Today last price 168.48
Today Daily Change -0.13
Today Daily Change % -0.08
Today daily open 168.61
 
Trends
Daily SMA20 169.64
Daily SMA50 167.51
Daily SMA100 164.81
Daily SMA200 161.84
 
Levels
Previous Daily High 170.14
Previous Daily Low 168.28
Previous Weekly High 170.89
Previous Weekly Low 168.01
Previous Monthly High 170.8
Previous Monthly Low 164.02
Daily Fibonacci 38.2% 168.99
Daily Fibonacci 61.8% 169.43
Daily Pivot Point S1 167.88
Daily Pivot Point S2 167.15
Daily Pivot Point S3 166.03
Daily Pivot Point R1 169.74
Daily Pivot Point R2 170.86
Daily Pivot Point R3 171.59


Haftungsausschluss: Nur zu Informationszwecken. Die bisherige Performance ist kein verlässlicher Indikator für zukünftige Ergebnisse.
placeholder
Solana im Abwärtsstrudel: Institutionelle kaufen, Kleinanleger fliehen – hält die 80-Dollar-Marke?SOL kämpft mit der 80-Dollar-Marke. Institutionelle kaufen via ETFs, während Derivate-Daten massive Short-Wetten der Kleinanleger zeigen.
Autor  Mitrade Team
Mi. 11.Feb
SOL kämpft mit der 80-Dollar-Marke. Institutionelle kaufen via ETFs, während Derivate-Daten massive Short-Wetten der Kleinanleger zeigen.
placeholder
Silberpreis unter Druck: Die 38,2-Prozent-Hürde bleibt unüberwindbarXAG/USD fällt auf 82 Dollar. Scheitern am 38,2% Fibonacci-Level und SMA-Widerstand belasten. Wichtige Unterstützungen im Fokus.
Autor  Mitrade Team
Do. 12.Feb
XAG/USD fällt auf 82 Dollar. Scheitern am 38,2% Fibonacci-Level und SMA-Widerstand belasten. Wichtige Unterstützungen im Fokus.
placeholder
Cardano-Analyse: Derivate-Markt sendet Hoffnungssignale – Gelingt die Trendwende?Positive Funding Rates und steigende Long-Wetten deuten auf Erholung hin. Charttechnik zeigt überverkaufte Signale bei 0,257 Dollar, Widerstand bei 0,301 Dollar im Fokus.
Autor  Mitrade Team
Do. 12.Feb
Positive Funding Rates und steigende Long-Wetten deuten auf Erholung hin. Charttechnik zeigt überverkaufte Signale bei 0,257 Dollar, Widerstand bei 0,301 Dollar im Fokus.
placeholder
Goldpreis im freien Fall: Margin Calls und Zinsangst drücken Kurs unter 5.000 DollarXAU/USD fällt auf 4.910 Dollar (-3,5%). Margin Calls wegen KI-Sorgen und starke US-Jobdaten lösen Ausverkauf aus. Fokus auf CPI-Daten.
Autor  Mitrade Team
Gestern 00: 53
XAU/USD fällt auf 4.910 Dollar (-3,5%). Margin Calls wegen KI-Sorgen und starke US-Jobdaten lösen Ausverkauf aus. Fokus auf CPI-Daten.
placeholder
Silberpreis-Prognose: XAG/USD steigt auf fast 76,50 US-Dollar, hat jedoch die dritte wöchentliche Abnahme im BlickDer Silberpreis (XAG/USD) gewinnt an Boden, nachdem er im vorherigen Handel einen Verlust von 11,5 % verzeichnete, und notiert in den frühen europäischen Stunden am Freitag um die 76,60 USD je Feinunze. Der Silberpreis steht jedoch vor einem dritten wöchentlichen Rückgang in Folge, da die Volatilität wieder auftritt.
Autor  FXStreet
Gestern 08: 25
Der Silberpreis (XAG/USD) gewinnt an Boden, nachdem er im vorherigen Handel einen Verlust von 11,5 % verzeichnete, und notiert in den frühen europäischen Stunden am Freitag um die 76,60 USD je Feinunze. Der Silberpreis steht jedoch vor einem dritten wöchentlichen Rückgang in Folge, da die Volatilität wieder auftritt.
verbundene Finanzinstrumente
goTop
quote