


Is silver preparing for another historic rally, or is a deeper correction still possible? Long-term demand from electric vehicles, AI hardware and power infrastructure remains supportive, while the market is heading for a sixth consecutive annual supply deficit.
However, 2026 industrial demand is expected to soften as solar manufacturers reduce silver use, and the Federal Reserve is no longer clearly moving toward rate cuts. In this comprehensive silver price prediction for 2026, we analyze Wall Street institutional forecasts, technical trends, and actionable strategies to help you determine if now is the right time to buy.
Current Silver Price
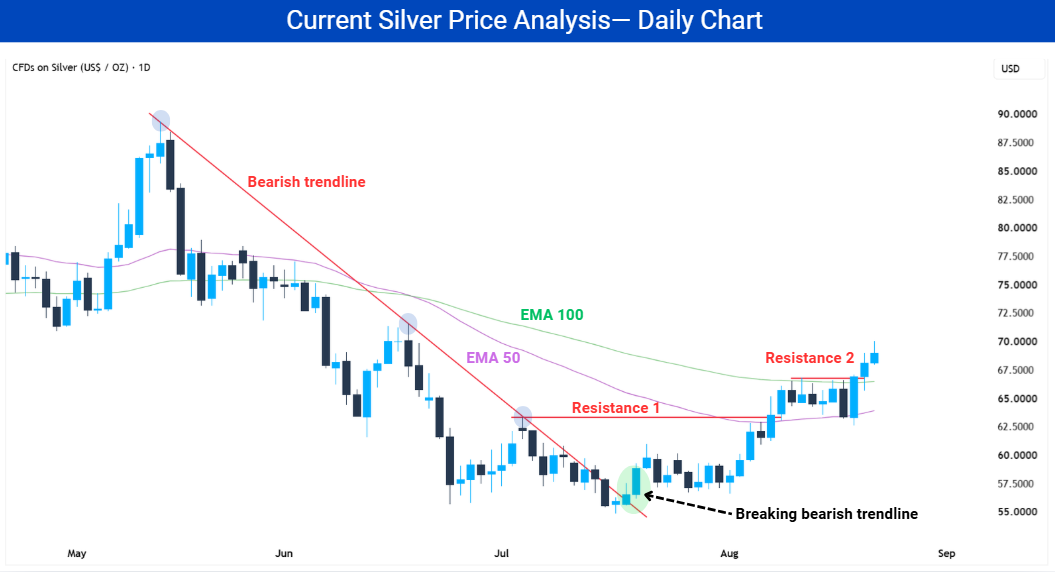
Silver closed at $69.95 on August 21, 2026, continuing its recovery from the July lows. Price had previously broken above its downtrend, cleared two resistance levels and moved above the 50-day and 100-day EMAs, reflecting stronger bullish momentum.
Silver’s recovery was supported by July payrolls falling 23,000, retail sales declining 0.6%, and softer inflation, with CPI up 0.1% and core CPI up 0.2%. It accelerated after the Treasury doubled long-dated bond buybacks, lowering the 10-year yield to 4.66% and the Dollar Index by 0.8%, while silver gained nearly 4%.
Silver Price Movements Over the Past Year
Silver gained 77.8% over the past year, but the rise was far from smooth. It climbed from a 52-week low near $38 in August 2025 to a record high in January 2026, then lost more than 50% before starting to recover.
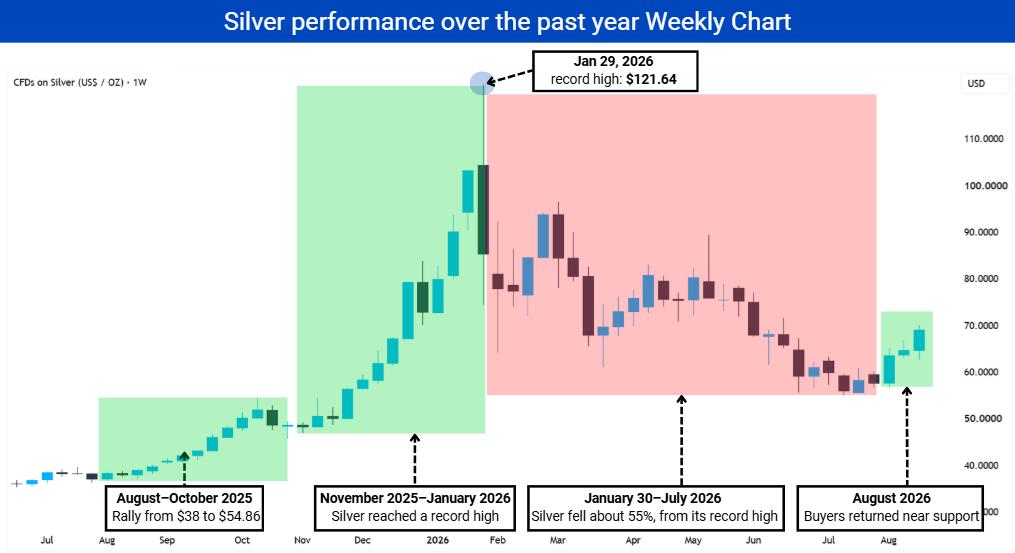
August–October 2025: Silver Rose From $38 to Nearly $55
Silver climbed from around $38 in August to a period high near $54.86 in October. US inventory inflows, investment through silver-backed funds and reduced availability in London contributed to the rise, while the cost of borrowing silver increased sharply.
November 2025–January 2026: Silver Reached a Record High
Silver ended 2025 with a 147% gain and continued climbing to a record high of $121.647 in late January 2026. Strong buying and limited metal available for immediate trading drove the rapid rise, but also left silver exposed to profit-taking.
January 30–July 2026: Silver Lost About 55%
On January 30, silver lost nearly 30% in one session after Kevin Warsh’s Fed-chair nomination lifted the dollar and triggered profit-taking. Leveraged liquidations and higher CME margins added pressure, and the total decline reached about 55% by July as silver fell from $121.647 to $54.78.
August 2026: Buyers Returned Near Support
Buyers started returning near $54.78, helping silver recover above $62.58. The daily Supertrend also turned green, although silver must break the next resistance area to confirm that a larger recovery is underway.
Gold-Silver Ratio: Reversion Signal or Neutral Zone?
The gold to silver ratio measures silver’s value relative to gold. A rising ratio shows gold outperforming, while a falling ratio shows silver outperforming.
The ratio fell from 103 in May 2025 to 46.6 in February 2026, moving from relative silver undervaluation to relative gold undervaluation. It then rebounded to 66.4 by August 22, crossing its historical average of 59.1.
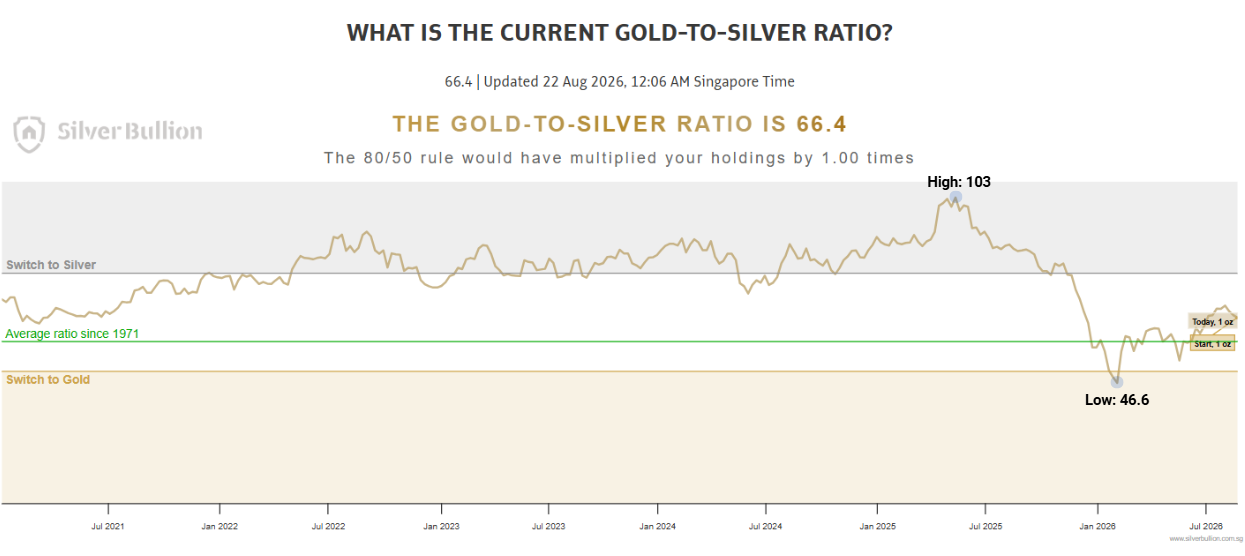
Source: Silver Bullion, updated August 22, 2026
Under the 80/50 framework, readings above 80 favor switching to silver, while those below 50 favor gold. At 66.4, no switch is indicated, although silver remains moderately cheap relative to its historical relationship with gold.
The rebound above 59.1 shows that the ratio has moved beyond its historical mean, giving gold near term relative momentum. A turn below 59.1 while silver rises would support the bullish bias, whereas a continued climb toward 80 would favor gold.
What Factors Will Drive Silver Prices in 2026?
Bullish Drivers
1. Industrial Demand: Solar, EVs, Electronics and AI
Silver’s high conductivity supports demand from solar panels, EVs, electronics and AI infrastructure. Battery-electric vehicles use about 25–50 grams each, while automotive silver demand is forecast to grow by 3.4% annually through 2031.
2. Structural Supply Deficits and Mining Bottlenecks
The World Silver Survey 2026 forecasts a 46.3-million-ounce deficit, up from 40.3 million ounces in 2025. Stock withdrawals have reached 762 million ounces since 2021, increasing sensitivity to physical and ETP investment demand. Supply reacts slowly because most silver is produced as a by-product of other metals.
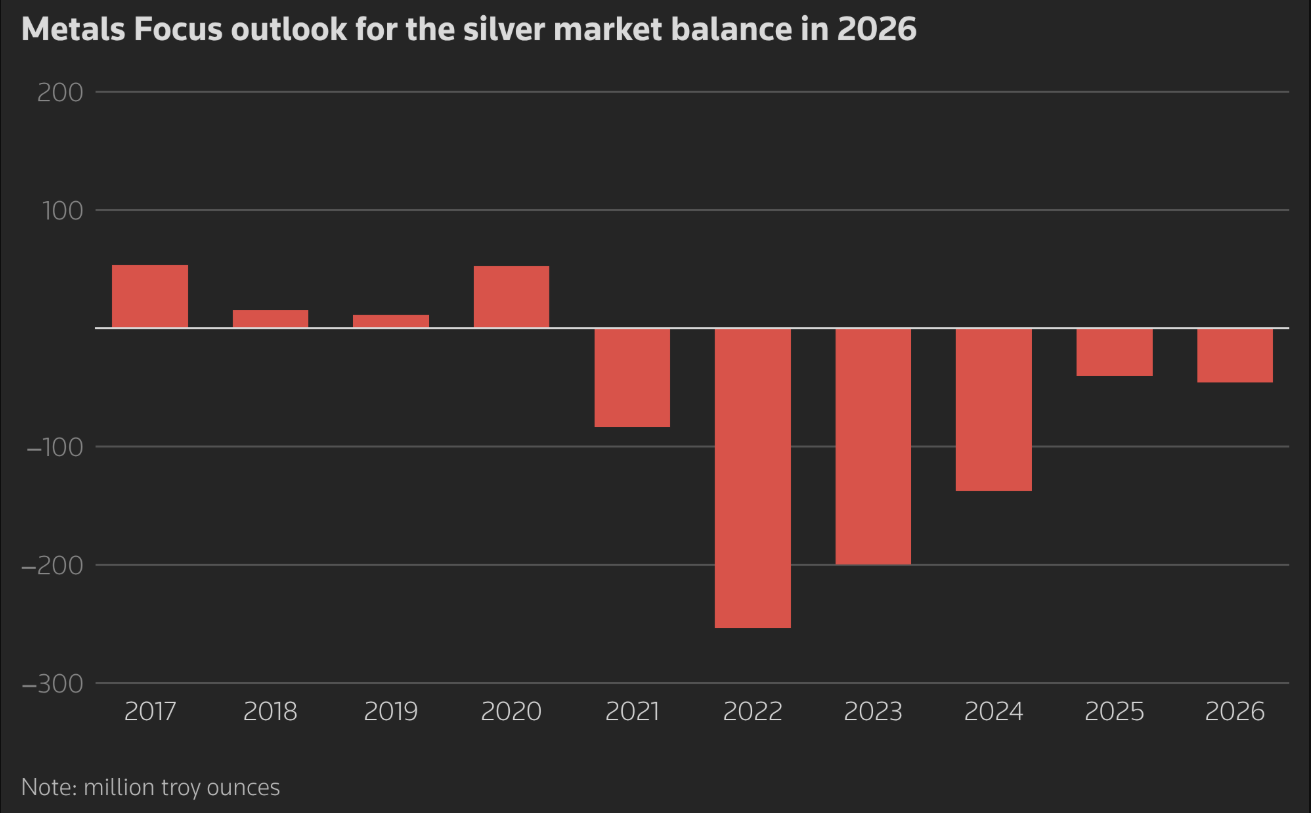
Source: Metals Focus for The Silver Institute, via Reuters, April 15, 2026.
3. Lower Real Yields and a Softer Dollar
Falling real Treasury yields reduce the opportunity cost of holding silver, while a weaker dollar makes it cheaper for international buyers. The Fed held rates at 3.50%–3.75% in July 2026, meaning renewed monetary easing could support silver through lower real yields, a softer dollar and stronger investment demand.
Bearish Drivers
1. Slower Global Growth and Recession Risks
The IMF expects global growth to slow to 3.0% in 2026, compared with a 3.5% average in 2024–2025. A deeper slowdown could weaken demand for vehicles, electronics and solar equipment, causing silver to underperform gold even if economic uncertainty increases safe-haven demand.
2. High Interest Rates Could Persist
US inflation remained above the Fed’s 2% goal, and three policymakers preferred a 25-basis-point rate increase in July. The 10-year real Treasury yield rose from below −1% in 2021 to 2.35% on August 20, 2026. Persistently high yields could support the dollar and weigh on silver investment and industrial demand.
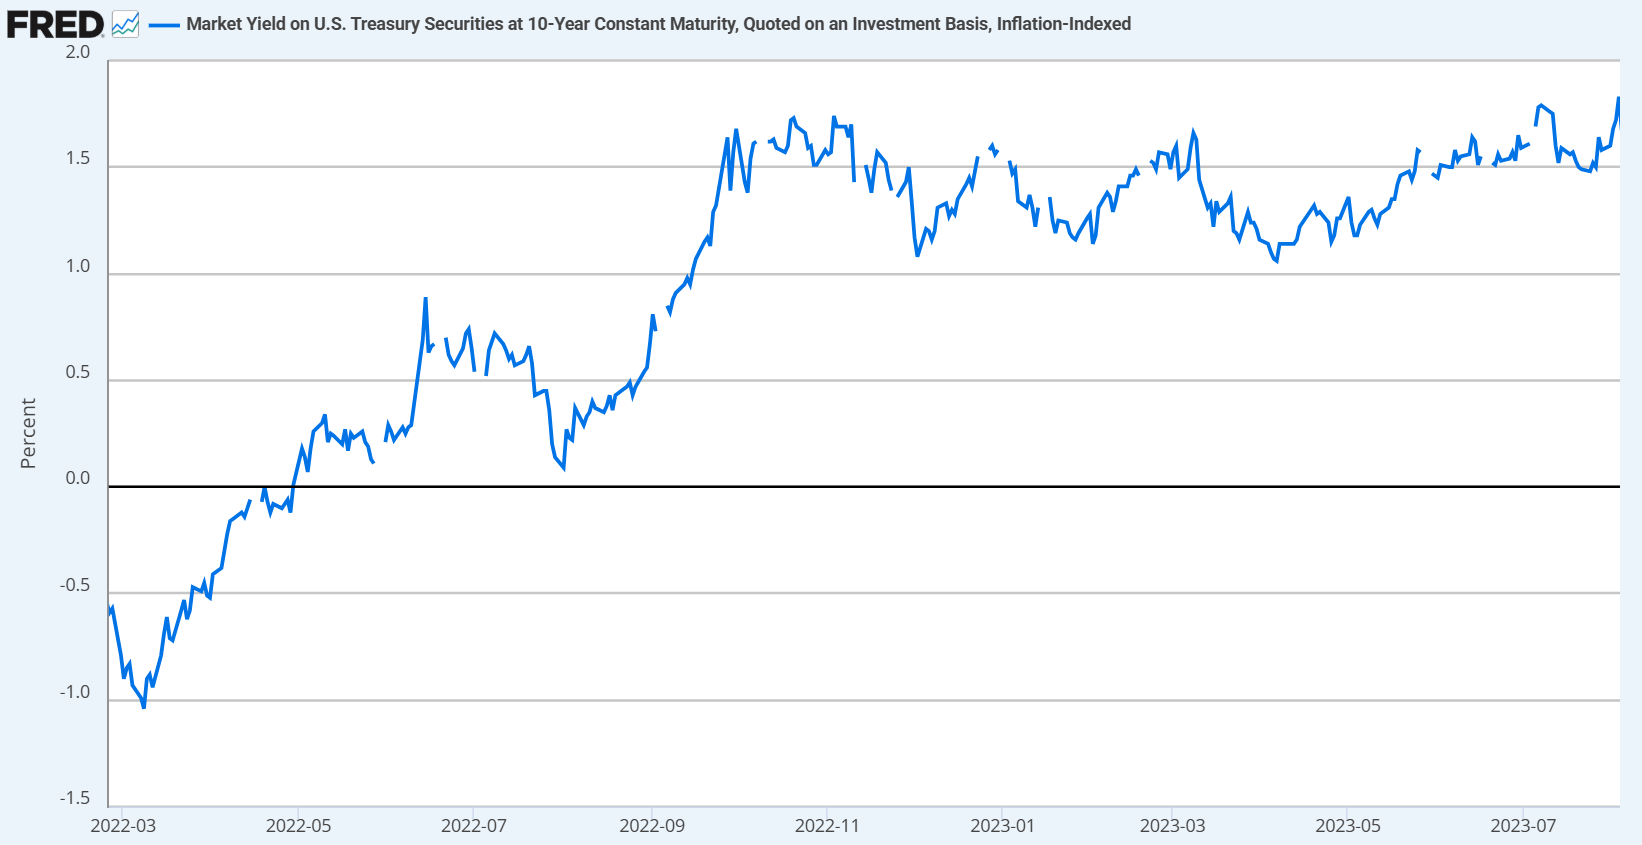
Source: Board of Governors of the Federal Reserve System, via FRED, August 20, 2026.
3. Industrial Thrifting and Substitution
The Silver Institute expects industrial fabrication to decline by approximately 3% to around 640 million ounces in 2026, mainly because solar manufacturers are reducing silver use or adopting alternative materials. Growth in AI and automotive demand may offset part of this decline, but is unlikely to eliminate it in 2026.
Medium and Short Term Silver Price Technical Analysis
This technical analysis identifies silver’s overall trend, key price levels and zones, and the signals supporting trading ideas.
Medium-Term Analysis: Weekly Time Frame
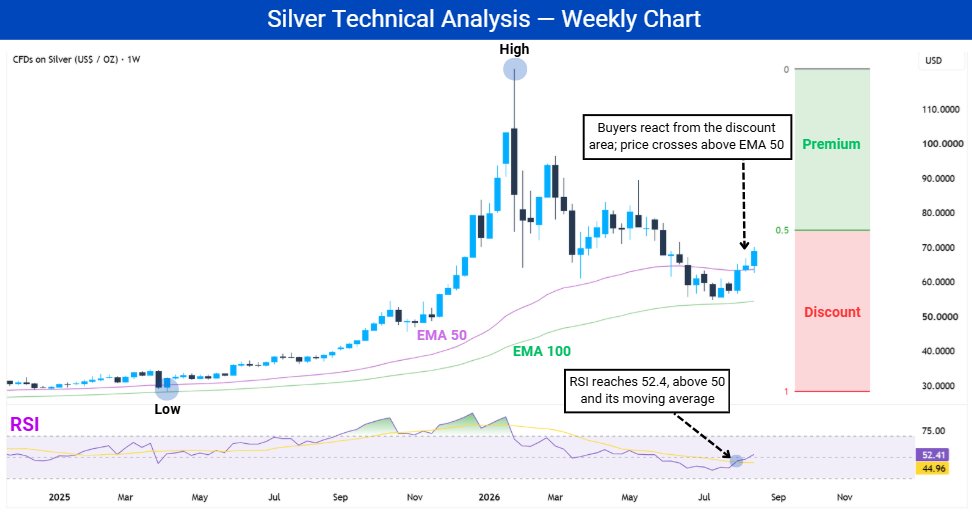
Silver remains bullish on the weekly timeframe. The chart divides the range between the March 2025 low and January 2026 high into a premium area above the midpoint and a discount area below it.
Silver’s decline reached the discount area, where bullish weekly candles showed that buyers were returning. Price then crossed back above the 50-week EMA without breaking below the 100-week EMA, keeping the broader bullish trend intact.
The RSI crossed above 50 and its moving average, reaching 52.4 compared with its average of 45.0. It remains below overbought conditions, showing improving bullish momentum with more room to strengthen.
These signals make a continuation of the bullish scenario more likely.
💡For long term investors, silver’s position in the discount area may offer an opportunity to buy at a relatively lower price and hold for the longer term. However, they should monitor upcoming fundamental developments and resistance levels that could slow further price gains. |
Short-Term Analysis: Daily Time Frame
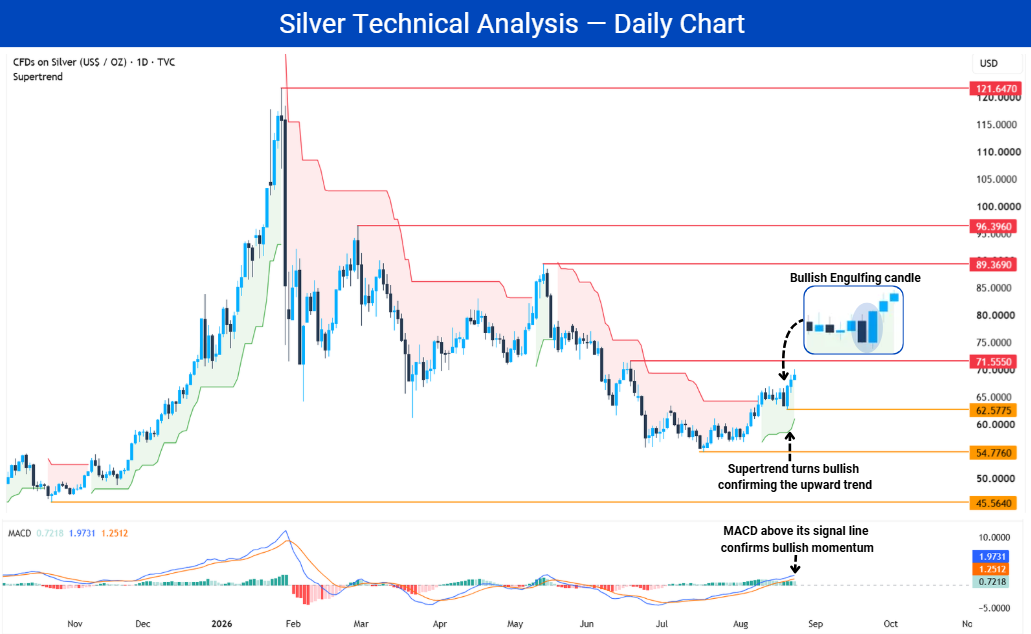
In the daily timeframe, silver is bullish after recovering above $62.58. The Supertrend has also turned bullish, indicating that buyers are gaining strength and the trend is shifting upward.
A bullish engulfing candlestick pattern formed after the recent pullback, showing stronger buying pressure, while the MACD line remains above its signal line and the histogram remains positive, indicating bullish momentum.
Together, these signals suggest that silver may continue rising toward the next resistance levels.
Key Silver Price Levels to Watch
Resistance levels:
$71.555
$89.369
$96.396
$121.647
Support levels:
$62.577
$54.776
$45.564
| 💡Short term traders can look for confirmed buying opportunities on lower timeframes, wait for a break above $71.555, or buy after a bullish reaction from the $62.577 support if price pulls back. |
Institutional Silver Price Predictions for 2026
The latest institutional outlooks place silver within a broad range of $63 to above $100, although most published targets cluster around 70–90. A sustained move above $100 would likely require stronger investment demand, renewed physical-market tightness, lower real interest rates, or a weaker US dollar.
Wall Street & Banking Outlook
Scenarios for Silver Price 2026
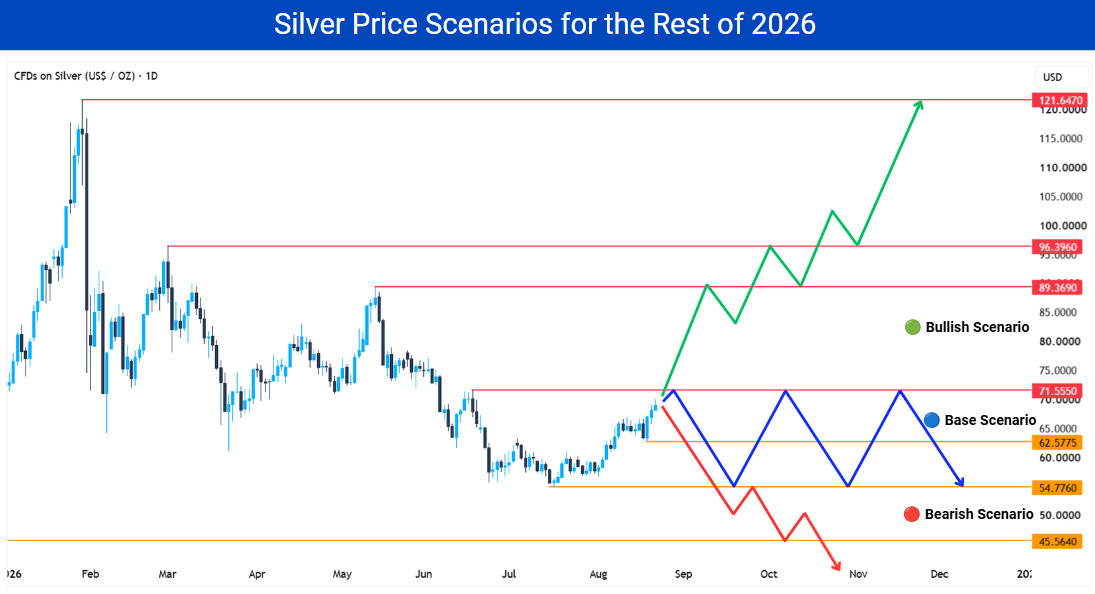
Silver has established a bullish bias across multiple timeframes, making the bullish scenario the most likely for the rest of 2026. However, the base and bearish scenarios remain possible.
1. Bullish Scenario
Silver already shows several bullish signals across the weekly and daily timeframes, including improving momentum, a bullish Supertrend signal and a bullish engulfing pattern. A confirmed breakout above the $71.555 resistance would further confirm the bullish scenario and open the way for price to rise.
Silver could then advance toward $89.369 and $96.396 before potentially retesting the January high at $121.647 or moving higher.
Main catalysts and drivers:
✅Softer inflation
✅Falling real yields
✅A weaker US dollar
✅Stronger investment demand
2. Base Scenario
In the base scenario, silver remains within the range between the $54.776 support and $71.555 resistance. Price could continue moving around the $62.577 intermediate level without establishing a clear direction.
Main catalysts and drivers:
✅Mixed inflation and economic growth data
✅Stable real yields
✅A broadly stable US dollar
✅Balanced industrial and investment demand
✅A confirmed breakout above $71.555 or below $54.776 would invalidate the base scenario.
3. Bearish Scenario
The bearish scenario would become more likely if silver breaks below the $54.776 support. Continued selling pressure could then push the price toward the next major support level at $45.564.
Main catalysts and drivers:
✅Sticky inflation
✅Higher real yields
✅Industrial demand weakness
✅ETP outflows
✅A close below $54.776 followed by a failed retest would confirm the bearish scenario.
Is It a Good Time to Buy Silver?
Silver currently presents a good buying opportunity. Price remains in the higher-timeframe discount zone, where renewed buyer interest is producing clear bullish reactions supported by multiple bullish signals across both higher and shorter timeframes.
Long Term Strategy: Gradual Buying and Hedging
Long term investors can consider gradual buying or dollar cost averaging instead of committing their full capital at once. This reduces timing risk and allows them to adjust their exposure as market conditions change.
Long term investors should do:
Monitor supply deficits, physical and ETP demand, real yields, the dollar and changes in industrial demand.
Reassess exposure and take partial profits as silver approaches important resistance levels.
Consider a hedging strategy only when price confirms a rejection from resistance.
Investors can retain their long term silver position while opening a short term sell position through silver CFDs. The hedge can be closed if price breaks and holds above resistance, although this approach increases trading costs and risk.
Short Term Strategy: Trading the Next Move
Short term traders should wait for confirmation and choose between pullback and breakout entries. The same approach can be applied as silver moves through each key price level.
Short term investors should watch and do:
A bullish reaction at $62.577, or a successful retest of $71.555, $89.369, $96.396 or $121.647 after a breakout, may provide a pullback entry.
Each confirmed breakout may provide a buying opportunity when supported by rising volume or bullish momentum indicators.
Place the stop beyond market structure, risk no more than 2%, maintain a positive risk to reward ratio and take partial profits at key levels.
Each successful breakout could give silver more room to advance toward the next resistance.

Silver’s price action and technicals lean decidedly bullish. Fundamentally, softening inflation, falling real yields, a weaker dollar, robust ETP demand, and physical supply tightness strengthen the case for an upward breakout.
Investors and short-term traders should keep a close eye on critical resistance levels to spot strategic profit targets and entry points.
For traders looking to navigate these market swings, flexible execution is key. Utilizing modern brokerage platforms like Mitrade allows you to trade Silver CFDs seamlessly in both directions—capitalizing on temporary pullbacks or riding potential breakouts with customizable leverage, zero commissions, and built-in risk management tools like stop-loss and trailing stop.
FAQs
1. Will silver reach $100 in 2026?
Yes, silver can reach $100 in 2026. A confirmed breakout above $71.555 would open the way toward $89.369 and $96.396; clearing these resistance levels would bring $100 within reach.
2. Is silver a better investment than gold right now?
Silver currently offers greater upside potential for investors who can tolerate higher volatility, supported by bullish signals. Gold remains the stronger defensive investment because it provides greater stability, liquidity and diversification.
3. What is the biggest risk for silver investors?
Silver’s biggest risk is its extreme volatility. Higher real yields, a stronger US dollar, ETP outflows or weaker industrial demand could reverse the bullish outlook, while a confirmed break below $54.776 would expose the $45.564 support.

* The content presented above, whether from a third party or not, is considered as general advice only. This article should not be construed as containing investment advice, investment recommendations, an offer of or solicitation for any transactions in financial instruments.


