


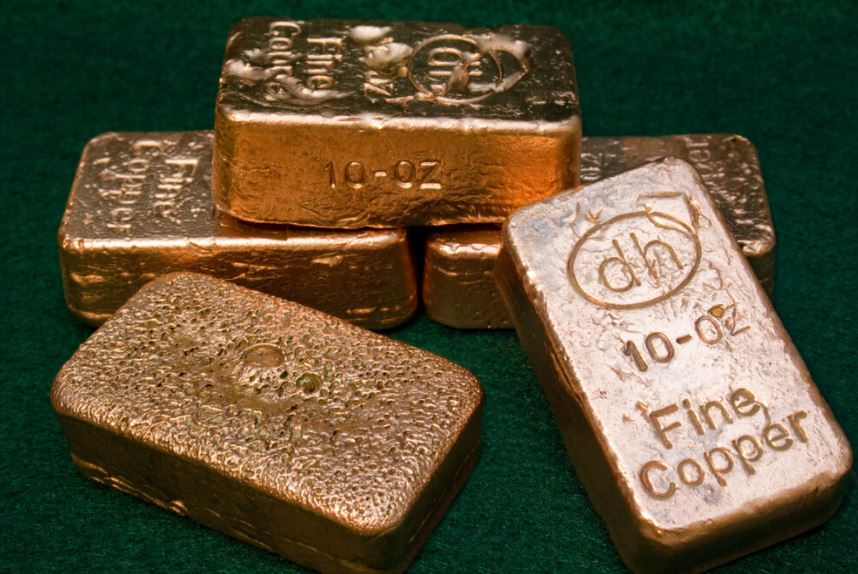
Copper is a key industrial metal used in construction, power grids, vehicles, electronics and data centers. Its price is closely linked to global growth and electrification trends.
After strong gains in 2025, copper reached new records of more than $14,000 in 2026. Tight inventories and supply risks could extend the rally, while high prices, mine restarts and weaker industrial demand may trigger a sharp correction.
This article reviews copper’s recent performance, technical outlook, key drivers, institutional forecasts and possible scenarios through the rest of 2026.
Reviews and Analysis of Copper Prices for the Past Year
Copper’s past-year performance combined a tariff-driven shock with a broader global uptrend. The weekly chart below highlights the main phases that shaped prices over the last 12 months.
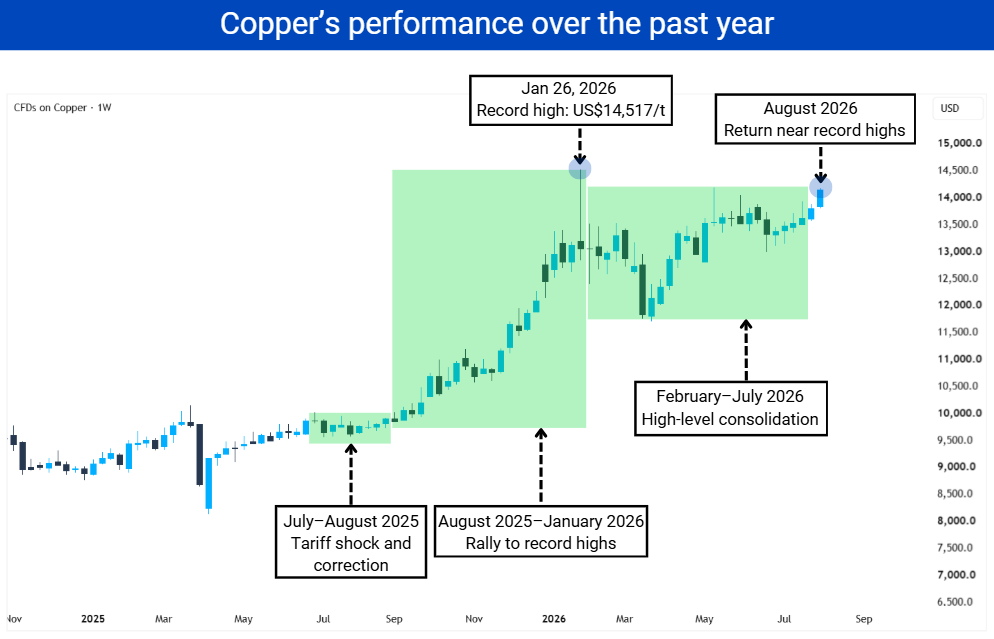
July–August 2025 — Tariff shock and correction
Copper initially surged after the U.S. proposed a 50% tariff on copper imports, then reversed after refined copper was excluded from the immediate measures. Prices stabilized around US$9,000–9,500 per metric tonne, keeping the broader uptrend intact.
August 2025–January 2026 — Rally to record highs
Supply disruptions, declining inventories and growing demand from power grids, electric vehicles and data centers lifted copper from around US$9,000 to a record above US$14,500 per metric tonne. Profit-taking followed after the new high was reached.
February–July 2026 — High-level consolidation
Copper traded mainly between US$12,000 and US$14,000 per metric tonne as supply constraints offset weaker demand at elevated prices. Despite the sideways movement, the broader bullish trend remained intact.
August 2026 — Return near record highs
Copper climbed back toward US$14,000–14,500 per metric tonne, supported by tightening inventories and continued demand from electrification and AI-related infrastructure. Trading close to record levels also increased the risk of short-term pullbacks.
What Caused This Trend?
Copper did not rise for one reason. Policy, physical supply, industrial demand and speculative flows reinforced one another, but their effects changed during the year.
Tariffs redirected global stocks: The 2025 tariff surprise first lifted COMEX and then caused its sudden crash. Continued uncertainty over refined-copper tariffs encouraged U.S. stockpiling in 2026, leaving less immediately available metal in London and Shanghai.
Mine and refined-supply constraints limited the response: Disruptions at large operations such as Grasberg and Kamoa-Kakula reduced concentrate availability. Declining ore grades, tight sulphuric-acid supply and weak smelter margins made it harder to convert high prices into rapid output growth.
China and electrification supported demand: China remained the largest source of refined-copper usage, while grids, electric vehicles, renewable power and data centers added structural demand. However, weak property activity and demand destruction at record prices limited the upside.
The dollar and investment flows amplified moves: A weaker U.S. dollar lowered copper’s cost for many non-U.S. buyers, while fund buying accelerated breakouts. The same positioning can deepen corrections when traders take profits or macro expectations reverse.
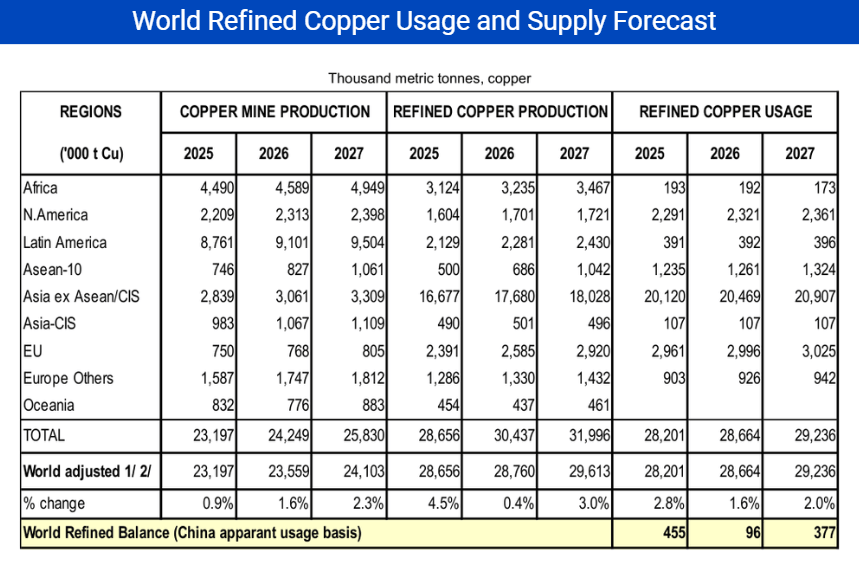
ICSG forecasts a tight market balance: The International Copper Study Group expects world mine production to grow by 1.6% in 2026, refined copper production by only 0.4%, and refined copper usage by 1.6%. This leaves a projected refined surplus of just 96,000 tonnes, compared with global usage of about 28.7 million tonnes.
Copper Technical Analysis: Key Levels to Watch for the Rest of 2026
Copper’s broader trend remains bullish on the daily timeframe, with the price trading above the 50 and 200 exponential moving averages, and the uptrend line. The copper price has also formed several important support and resistance levels during 2026.
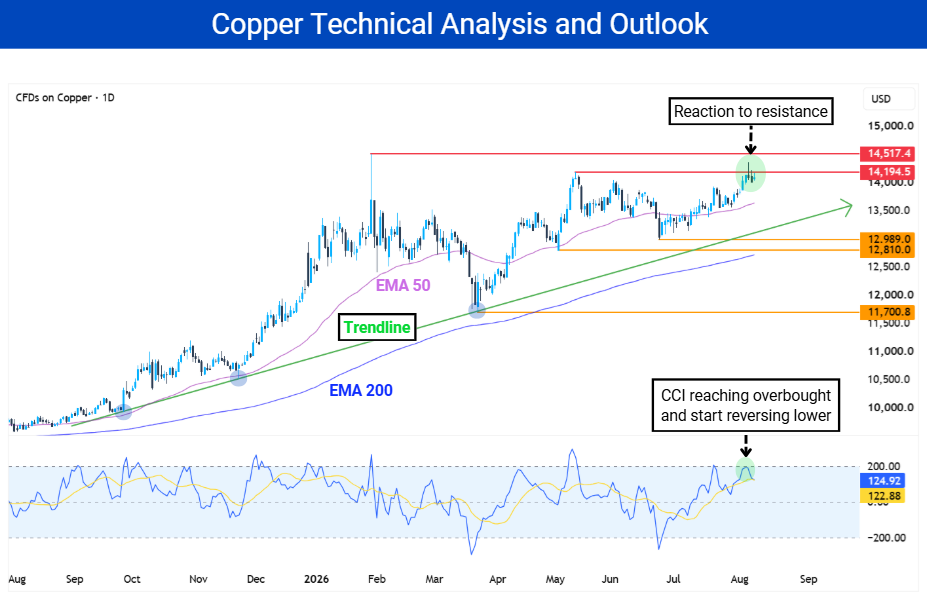
The copper price is currently trading around the key resistance at US$14,194.5 and reacting to it by forming a star candle, signaling a bearish short-term selling opportunity, while the Commodity Channel Index (CCI) is turning lower after exceeding +200, providing additional confirmation of the bearish selling opportunity and indicating that the price may pull back.
Support Levels
$12,989
$12,810
$11,700.8
The first support is near US$12,989. Another support is near US$12,810, while US$11,700.8 is the strongest support, formed after a deep pullback was followed by a significant price rise.
The uptrend line has been tested three times since late 2025, acting as dynamic support. The rising 50-day and 200-day EMAs also provide additional reference points during pullbacks.
A decline toward these support levels, the EMAs or the uptrend line, followed by a bullish reaction, may provide buying opportunities at lower prices. A confirmed break below them may provide short-term selling opportunities.
Resistance Levels
$14,194.5
$14,517.4
The first resistance is near US$14,194.5, where the price is currently reacting. The next resistance is US$14,517.4, the current record high and strongest resistance.
A confirmed break above these resistance levels may provide buying opportunities for breakout traders. Traders can look for confirmation such as a break and retest or stronger volume, while a bearish rejection from either resistance may provide short-term selling opportunities.
Technical setups should also be confirmed with fundamentals. Stronger China data, falling inventories, supply disruptions or a weaker U.S. dollar can support bullish setups, while weaker demand, rising inventories, improving mine supply or a stronger dollar can support bearish setups.
Factors That May Affect Copper Prices in the Rest of 2026
Copper’s next direction will depend on whether supply constraints and industrial demand remain stronger than the forces that could reduce consumption or increase available metal.
📈 Factors That Could Push Copper Higher
Stronger manufacturing activity in China could increase physical copper consumption, while continued investment in power grids, data centers and electric vehicles may strengthen demand across several industries.
Further mine disruptions, lower ore grades or concentrate shortages could restrict copper supply and keep the market sensitive to additional production losses.
A weaker U.S. dollar could support global copper demand, while remaining uncertainty over refined-copper tariffs may attract more metal into the U.S. market and reduce availability elsewhere.
📉 Factors That Could Push Copper Lower
Weaker construction and manufacturing activity in China could reduce consumption, while record prices may encourage substitution, recycling and delays in physical purchases.
Mine restarts and stronger output from major producers could increase available copper and ease the supply pressure that has supported prices.
A stronger U.S. dollar could pressure copper prices. In addition, clearer U.S. tariff policy may reduce precautionary stockpiling, removing one of the factors that recently supported prices.
Copper Price Forecast for the Rest of 2026
Copper forecasts differ because institutions use different assumptions for supply, demand, inventories, China’s economy and the U.S. dollar.
Most forecasts expect copper to stay at high prices, but they differ on how much further it can rise. The main disagreement is whether tight supply or improving mine output will have a stronger effect on prices.
Latest Institutional Copper Price Forecasts
Institutional forecasts generally remain below copper’s current 2026 highs. Goldman Sachs and the World Bank expect annual averages of US$12,650 and US$12,000 per tonne, while UBS forecasts US$13,000 by December 2026.
If copper pulls back toward lower prices, it may attract new buying interest, which could support another price rise after the pullback.
Copper Price Scenarios for the Rest of 2026
Copper’s outlook for the rest of 2026 depends on how supply, demand, inventories and broader market conditions develop. The scenarios below show the main possible price paths and the conditions that could support each one.
Base Case
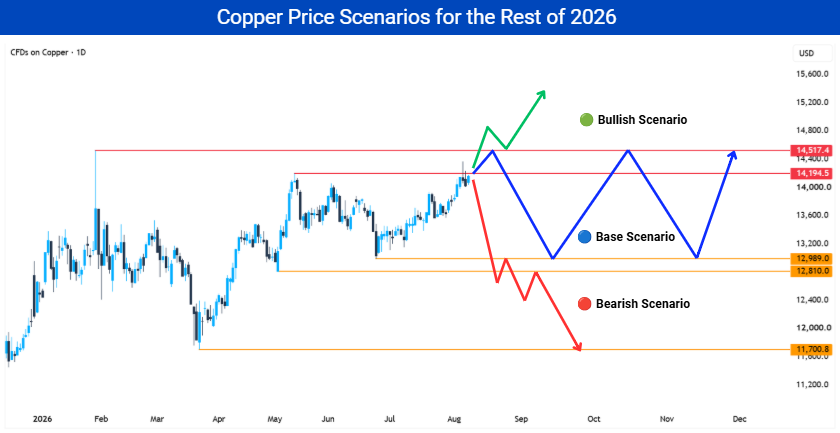
In the base case, copper price may remain in a range between US$12,989.0 and US$14,517.4. Price could continue moving between these support and resistance levels.
Reason: Stable demand, only gradual improvement in mine supply, and relatively tight inventories could keep copper at high prices. Supply may improve enough to prevent a strong breakout, but not enough to cause a deeper drop.
Bullish Case
In the bullish case, copper price may break above the US$14,517.4 record high. A confirmed breakout could push price toward US$15,000, with a further move toward US$15,500 if bullish momentum continues.
Reason: Falling exchange inventories, continued mine disruptions, stronger China demand and a weaker U.S. dollar could tighten available copper. These conditions could increase upward price pressure and support a move above the current record high.
Bearish Case
In the bearish case, copper price may fall toward the US$12,989.0–12,810.0 support levels. A sustained break below US$12,810.0 could push price lower toward US$11,700.8.
Reason: Weaker China demand, rebuilding inventories, stronger mine output and a stronger U.S. dollar could reduce market tightness. If several of these factors develop together, downward pressure could increase and push copper toward the lower support levels.
Strategies for Different Investors Facing Copper Price Volatility in 2026
Copper’s high prices and volatility require different approaches depending on the investment horizon and type of exposure. Short-term traders, long-term investors and individual investors should therefore manage copper risk differently.
Short-Term Traders: Master the Swings, Respect the Risk
For active swing traders, high volatility can provide more trading opportunities. However, keeping control when the market moves quickly requires systematic discipline.
Use Key Levels and Hedges: Instead of chasing emotional breakouts, wait for price confirmation at key support and resistance levels on lower timeframes. If you already hold copper or copper-related equity positions, temporary short positions can also be used to hedge part of the exposure during technical pullbacks.
Strict Risk Discipline: Never enter fresh positions right before major economic releases or supply-disruption announcements. Always use a hard stop-loss, limit risk to 1–2% of capital per trade, and maintain a positive risk-to-reward ratio.
Watch the Key Drivers: Keep a close eye on Chinese economic data, exchange inventories, U.S. dollar movements, trade policies and sudden mine outages. Real-time demand shifts from power grids, electric vehicles and AI data centers can also trigger sharp price swings.
Long-Term Institutional & Value Investors
For investors in it for the long haul, the focus should be less on day-to-day headlines and more on the broader commodity supercycle.
Buy Quality on Major Dips: Resist FOMO during sudden price surges. Instead, track major support levels on higher-timeframe charts and build positions when valuation multiples become more attractive.
Retail Investors: Smart Diversification via Stocks and ETFs
For individual investors without the time to trade futures or analyze complex mining balance sheets, indirect exposure through stocks and ETFs can provide a simpler path to the copper market.
Target Industry Leaders: Companies such as Freeport-McMoRan, Southern Copper and BHP can provide strong exposure to rising copper prices, although investors should also monitor company costs and geopolitical risks.
Simplify with Targeted ETFs: COPX spreads exposure across dozens of global copper miners in a single investment, helping diversify company-specific risk. CPER provides closer exposure to copper price movements through copper futures, without the company-specific equity risk associated with individual mining stocks.
Keep Dry Powder: Scale into positions gradually rather than going all-in at once. Maintaining a sensible cash reserve provides buying power to take advantage of more attractive prices if copper experiences a sharp pullback.

Technical and Fundamental Indicators That Can Help Analyze Copper Prices
Some indicators are more useful for copper than others. Traders should focus on indicators that help measure trend, momentum, volume and physical-market conditions, while using them together rather than relying on one signal alone.
Technical indicators:
Commodity Channel Index (CCI): Measures momentum and helps identify overbought or oversold conditions. A CCI below -100 that begins turning higher can support a bullish reversal signal, while a CCI above +100 that starts falling can warn of weakening momentum. CCI was originally developed for commodities, making it particularly relevant for copper analysis.
Moving Averages: Help identify the broader trend and can act as dynamic support or resistance. Holding above a rising moving average is generally positive, while breaking and remaining below it can indicate a weaker trend.
Money Flow Index (MFI): Combines price and volume to measure buying and selling pressure. A rising MFI supports stronger buying pressure, while a falling MFI indicates increasing selling pressure.
Supertrend: Uses price and Average True Range (ATR) to identify trend direction and possible trend changes. Price above the indicator supports an upward trend, while a move below it can signal a bearish change.
Volume: Can help confirm breakouts, reversals and reactions from important levels. A price move accompanied by stronger volume generally provides better confirmation than the same move on weak volume. For copper, futures volume is particularly useful because it represents actual contracts traded.
Fundamental indicators:
LME Cash-to-Three-Month Spread: Backwardation, where nearby copper trades above later delivery, can indicate tighter immediate supply and is generally supportive for copper. Contango usually points to less immediate tightness and is less supportive.
Treatment and Refining Charges (TC/RCs): Falling TC/RCs can indicate tighter copper-concentrate availability, while rising charges generally indicate improving concentrate supply. This can help traders judge whether conditions in the upstream copper market are becoming tighter or looser.
How to Capitalize on Copper Price Movements on Mitrade for UAE Investors
Copper’s volatility creates opportunities during both pullbacks and breakouts. UAE traders can use Mitrade to analyze the market, follow important news and manage trades within one workflow.
Step 1: Open a Mitrade Account
Open a Mitrade account and choose between demo and live trading. Beginners can use the demo account to practice before risking real money, while experienced traders can switch directly to the live account and make a deposit on the same platform.
Step 2: Analyze the Copper Chart
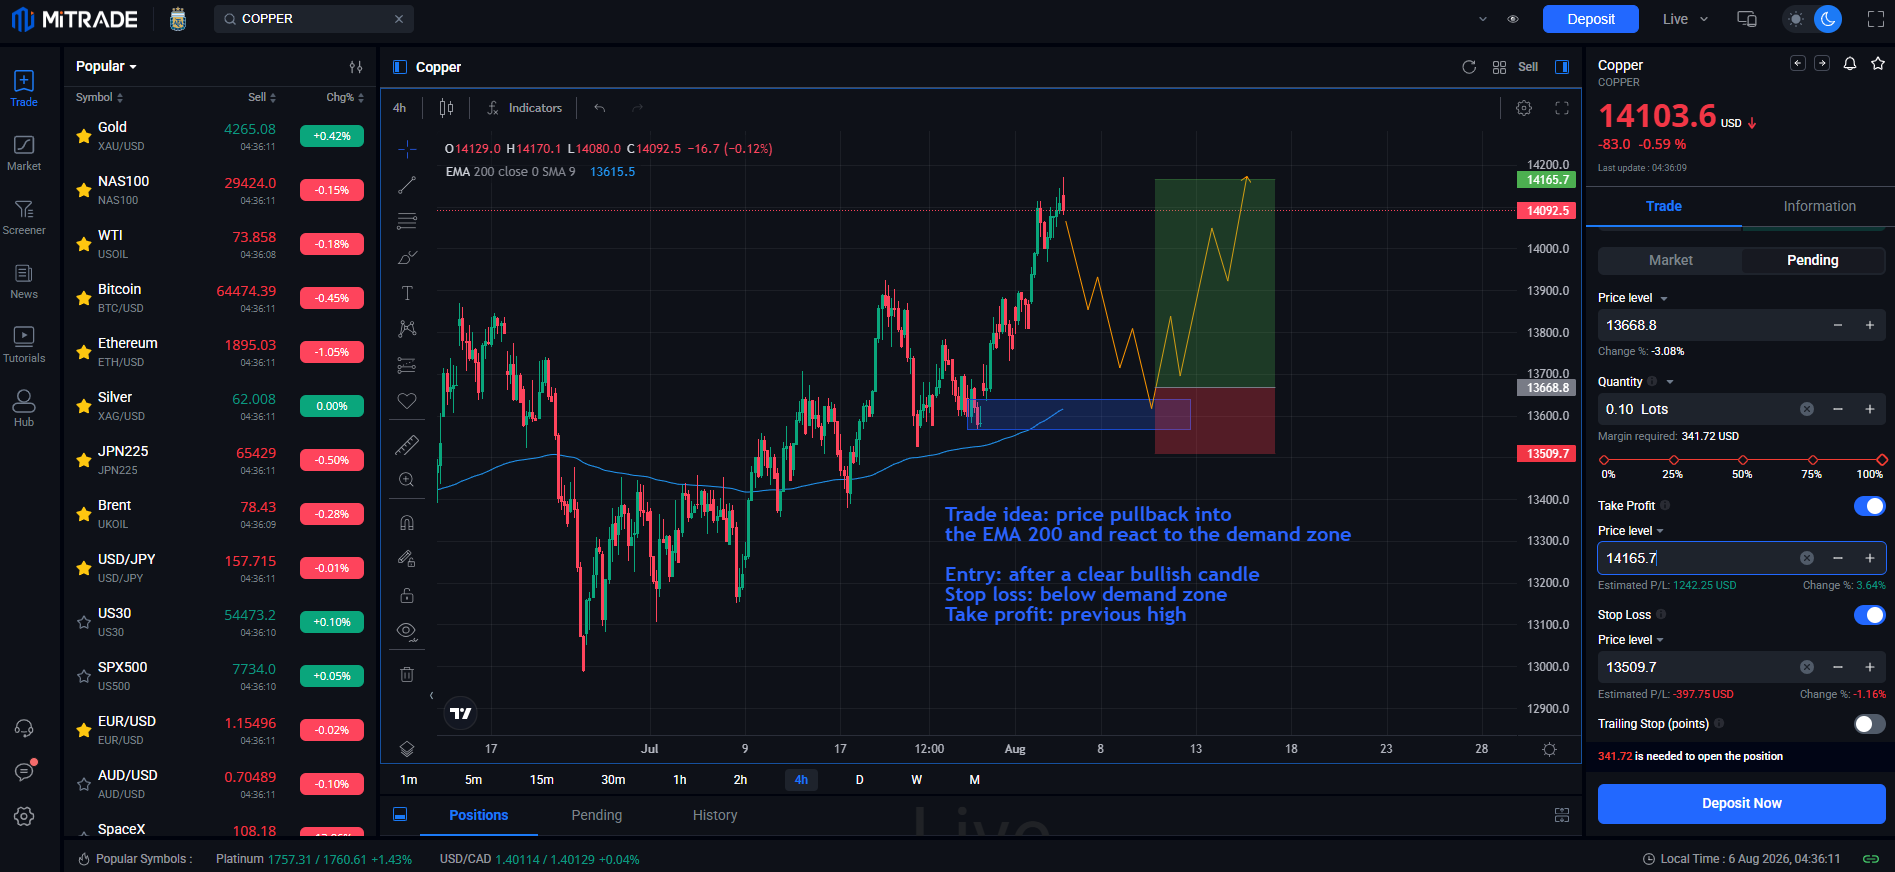
Use Mitrade’s charting tools and indicators to analyze copper across multiple timeframes. Higher timeframes can identify the main trend and important levels or areas, while lower timeframes can provide more precise entries and confirmations.
Step 3: Check Copper News and Market Positioning
Use Mitrade’s economic calendar to track important news that may affect copper prices. Traders can also check the CFTC’s Commitments of Traders (COT) report to see the aggregate buying and selling positions of large market participants, such as swap dealers and investment funds.
Step 4: Open and Manage the Trade
Choose Buy or Sell based on your analysis of the copper price, then set the position size based on the risk you want to take for that position and set the stop-loss and take-profit before entering. Mitrade also provides price alerts, limit and stop orders, and trailing stops to automate entries, manage risk and help protect profits.
Start trading with a live Mitrade account in just 3 easy steps—takes only minutes!▼

Conclusion
While copper’s broader trend remains decidedly bullish, with current prices floating near $14,100—well above many 2026 average price projections—traders should prepare for potential volatility or pullbacks. Success in this environment will come down to agility: tracking technical trendlines, inventory shifts, and incoming economic data closely.
Having the right tools makes all the difference. With Mitrade, traders get seamless access to copper and global markets alongside advanced charts, technical indicators, and real-time news alerts on a single platform. You can sharpen your market timing risk-free using a $50,000 demo account, or transition to live execution with a minimal deposit of just $50.
Will copper prices reach $15,000 per tonne in 2026?
Reaching $15,000 per tonne is possible under a strong bullish scenario. It requires a combination of major mine supply disruptions, aggressive rate cuts by global central banks, and stronger-than-expected industrial demand from China and AI infrastructure expansion.
Is copper a good long-term investment for the next 5 years?
Yes. Copper is considered a crucial strategic metal for the global energy transition and digital infrastructure. Structural supply shortages alongside rising demand from global decarbonization goals make copper an attractive long-term commodity investment.
How does AI expansion affect the copper price forecast?
AI data centers require vast amounts of electricity and specialized cooling systems, which heavily rely on copper wiring and transformers. This surge in power infrastructure adds a new, fast-growing demand driver for physical copper.
* The content presented above, whether from a third party or not, is considered as general advice only. This article should not be construed as containing investment advice, investment recommendations, an offer of or solicitation for any transactions in financial instruments.


