


Copper Price Forecast: Copper Nears Record High, Chilean Mine Strike Hits Supply, Could It Break $15,000?
TradingKey - As of Friday (October 9) Eastern Time, copper prices (COPPER) rebounded significantly, closing up 1.64% at $14,537, with a weekly gain of 2.08%, reversing the previous week's downward trend. International copper prices have strengthened again recently, mainly supported by factors such as supply disruption risks at Chilean copper mines, a recovery in Chinese import demand, and falling exchange inventories. However, the trend of the US dollar and US interest rate expectations may still limit the short-term upside for copper prices.
Chilean Copper Mine Strike Heightens Supply Concerns as China's Import Demand Rebounds
A major driver behind the recent rise in international copper prices has been supply uncertainty at major global copper mines.
The union at Chilean miner Antofagasta's Centinela copper mine has gone on strike. The union stated that if labor negotiations make no progress, the strike could have a more pronounced impact on copper output starting in November. Meanwhile, Escondida, the world's largest copper mine, is also facing pressure from labor negotiations, further heightening market concerns over copper concentrate supply.
Declining inventories have also provided support for copper prices. The latest data show that copper stocks in LME-registered warehouses dropped to a six-week low of 233,025 metric tons, with a single-day net outflow of 2,200 metric tons. As large volumes of copper were previously shipped to the U.S. to hedge against potential import tariffs, U.S. COMEX copper inventories reached a record 711,609 metric tons, highlighting significant disparities in global copper inventory distribution.
On the demand side, imported copper procurement activity recovered after China's National Day holiday. The Yangshan copper premium, a key indicator of Chinese copper import demand, rose to $135 per ton, its highest level in four years, signaling an improvement in Chinese buyers' appetite for overseas copper.
However, copper inventories on the Shanghai Futures Exchange rose to 58,744 metric tons, up by 20,000 metric tons from the end of September, suggesting that the degree of domestic supply tightness still needs to be evaluated alongside subsequent inventory changes.
On the macro front, weak U.S. nonfarm payrolls data reduced market expectations of another Federal Reserve rate hike in October. However, the U.S. dollar and U.S. Treasury yields remain relatively high, which could exert some pressure on dollar-denominated copper prices.
Copper Price Technical Analysis
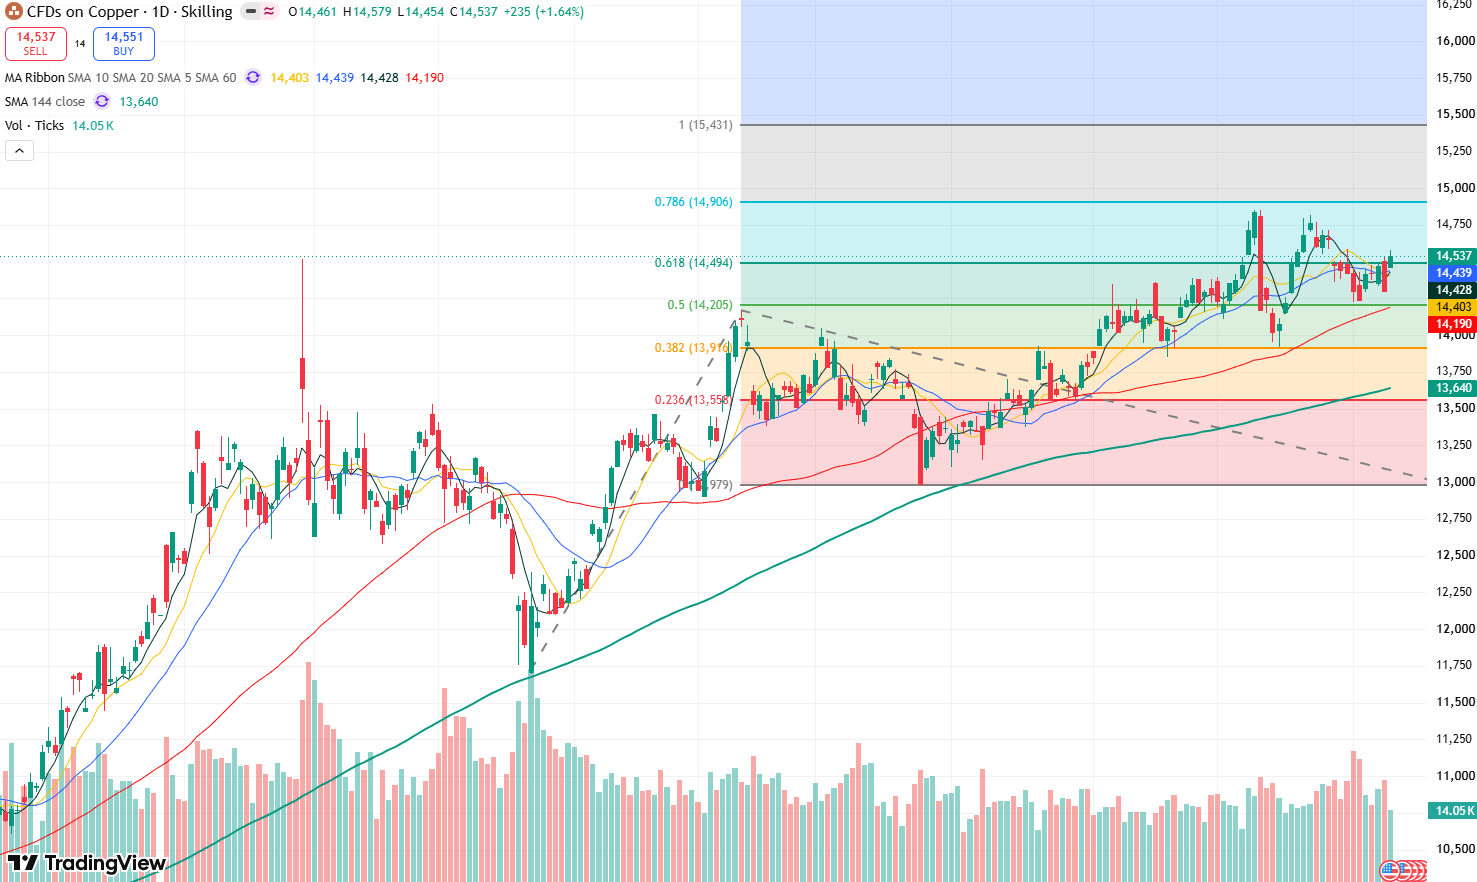
Copper price daily chart, Source: TradingView
Looking at the daily chart, copper prices recently tested the resistance level of $14,900 twice in succession but failed to break above it, indicating that the $14,900–$15,000 range has become an important short-term resistance zone. However, copper found support near $14,200 during its pullback and rebounded, currently reclaiming the $14,500 level, with short-term price action showing improvement.
Currently, copper's overall trend displays a structure of higher highs and higher lows, indicating that the broader trend remains distinctly bullish. Meanwhile, the 60-day and 144-day moving averages maintain a bullish alignment, further underscoring the strong sustainability of copper's medium-to-long-term uptrend, with the primary upside target set at the $15,000 mark.
On the downside, initial support is seen at $14,400, with further support located in the $14,290–$14,300 area. A break back below $14,300 could signal weakening momentum in the current rebound, with the next support pointing to around $14,000.
Recommended Articles


