


Bitcoin Price Forecast: High-Level Profit-Taking Pressure Emerges for BTC, Can It Still Reach $100,000 This Year?
Bitcoin Price Trend Review
TradingKey - Bitcoin (BTC) has gone through several key stages of reshuffling and bottoming out this year. Overall, the trend in 2026 has presented a wave-like upward pattern, characterized by an opening high followed by a pullback, a deep mid-year shakeout, and a strong recovery in the second half of the year.
At the beginning of the year, Bitcoin extended its bullish momentum, touching a high close to $98,000 in mid-January. However, entering February, BTC prices quickly pulled back to around $60,000 to form a bottom. Subsequently, Bitcoin gradually rebounded and strengthened, rallying above $80,000 in early May. Moving into May and June, BTC experienced its sharpest technical correction of the year, with prices breaking below the key defense line of $60,000 in late June and briefly approaching $57,000, touching lows from September 2024.
Starting July 1, spot buying returned in force, and BTC quickly staged a V-shaped reversal, reclaiming $60,000 in one move. In mid-to-late August, Bitcoin prices experienced a vertical surge, reclaiming the $70,000 and $80,000 levels within a single week. In late September, BTC surged to a high of $87,000 before trading lower in a volatile pattern toward $80,000.
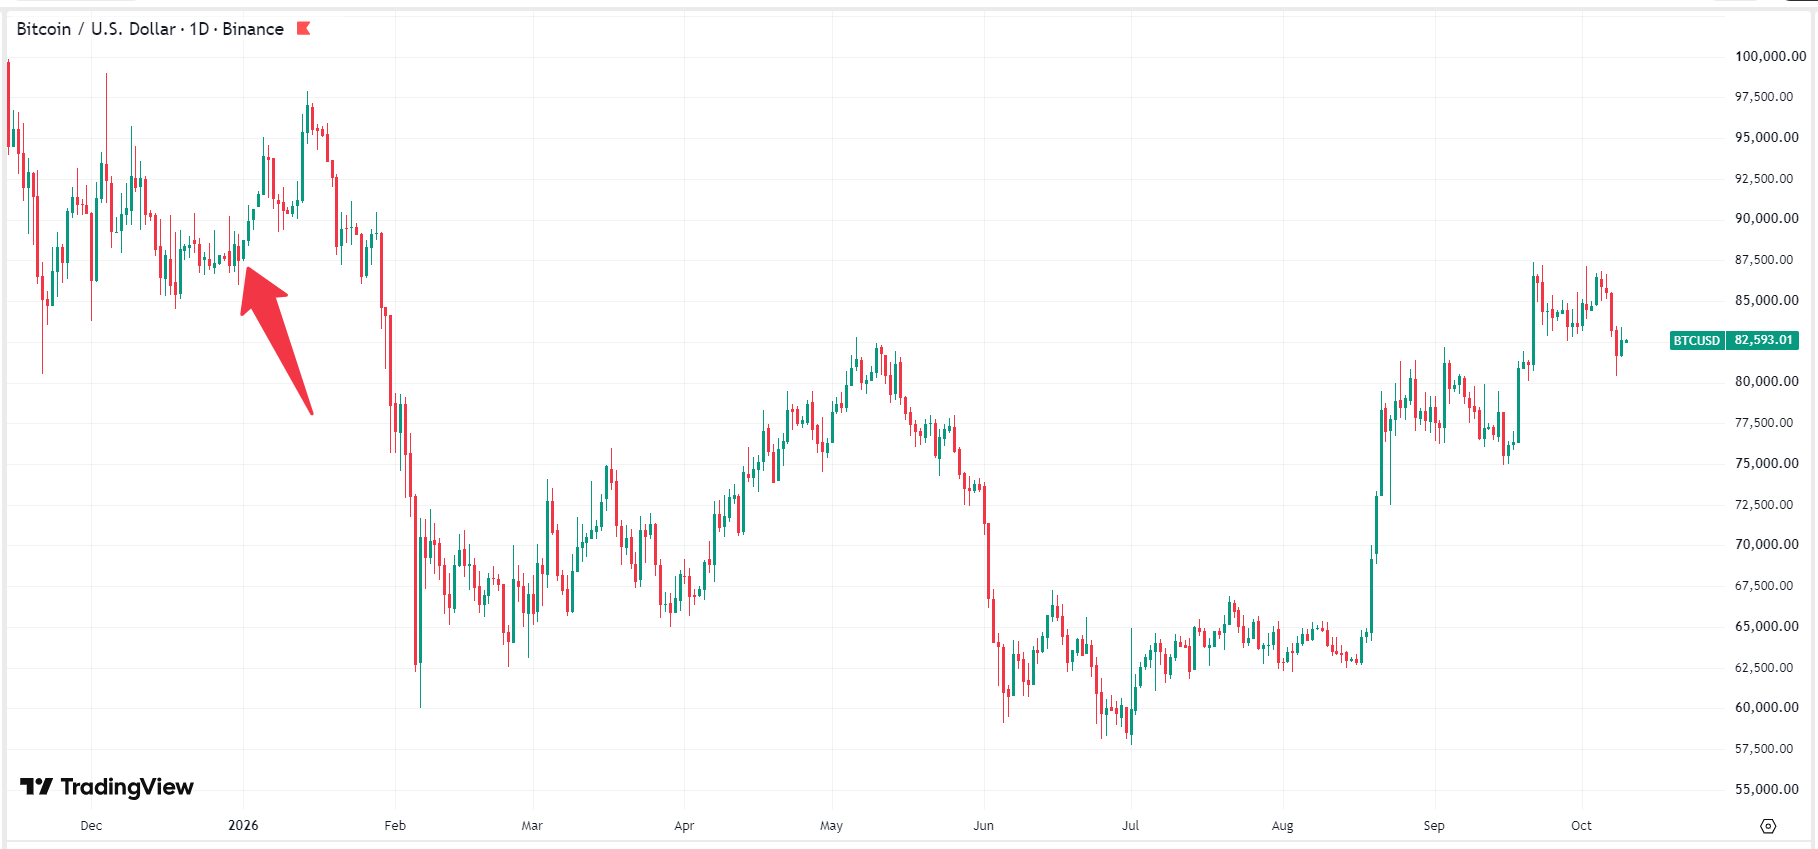 Bitcoin Price Chart (Daily), Source: TradingView
What Factors Are Driving Bitcoin’s Sharp Price Volatility This Year?
Traditional institutional funds reallocated into crypto assets at the beginning of the year. However, heading into February, uncertainty surrounding macroeconomic interest rate policies dampened the momentum for consecutive breakthroughs, which, combined with profit-taking at market highs, triggered a rapid pullback in Bitcoin prices.
In May and June, tightening global macroeconomic liquidity, coupled with excessive leverage build-up in parts of the derivatives market, led to a deeper decline in Bitcoin. Meanwhile, a wave of liquidations among short-term leveraged positions chasing highs accelerated the transfer of holdings from retail investors and high-leverage traders to long-term institutions.
In the second half of the year, Bitcoin's price increase was primarily driven by macroeconomic and regulatory factors. These included weakening market expectations of aggressive rate hikes by the Federal Reserve, the U.S. Treasury's mid-August announcement to double its long-term bond buyback scale to $4 billion, and the U.S. Securities and Exchange Commission (SEC) introducing a regulatory framework for bringing U.S. equities on-chain.
Can Bitcoin Reach $100,000 This Year?
Recently, news of Bitcoin transfers from U.S. government-custody wallets brought short-term panic to the market. However, two key supporting catalysts remain unchanged: first, the Federal Reserve is slowing its rate hikes, with the probability of holding interest rates unchanged in October exceeding 80%, and Governor Waller previously stated that there is no need to raise rates at consecutive meetings; second, with the U.S. midterm elections approaching, both the Democratic and Republican parties may issue positive signals to court crypto voters.
From a technical perspective, Bitcoin's price swiftly staged a V-shaped reversal after a recent decline and broke through $83,000, validating the strength of the $81,000–$82,000 neckline and key support level, forming a classic bear trap pattern. Going forward, if Bitcoin breaks above the previous high range of $87,000–$88,000, resistance above is sparse, making it easy to trigger cascading short liquidations and directly opening an ascending channel toward 90,000 and 100,000.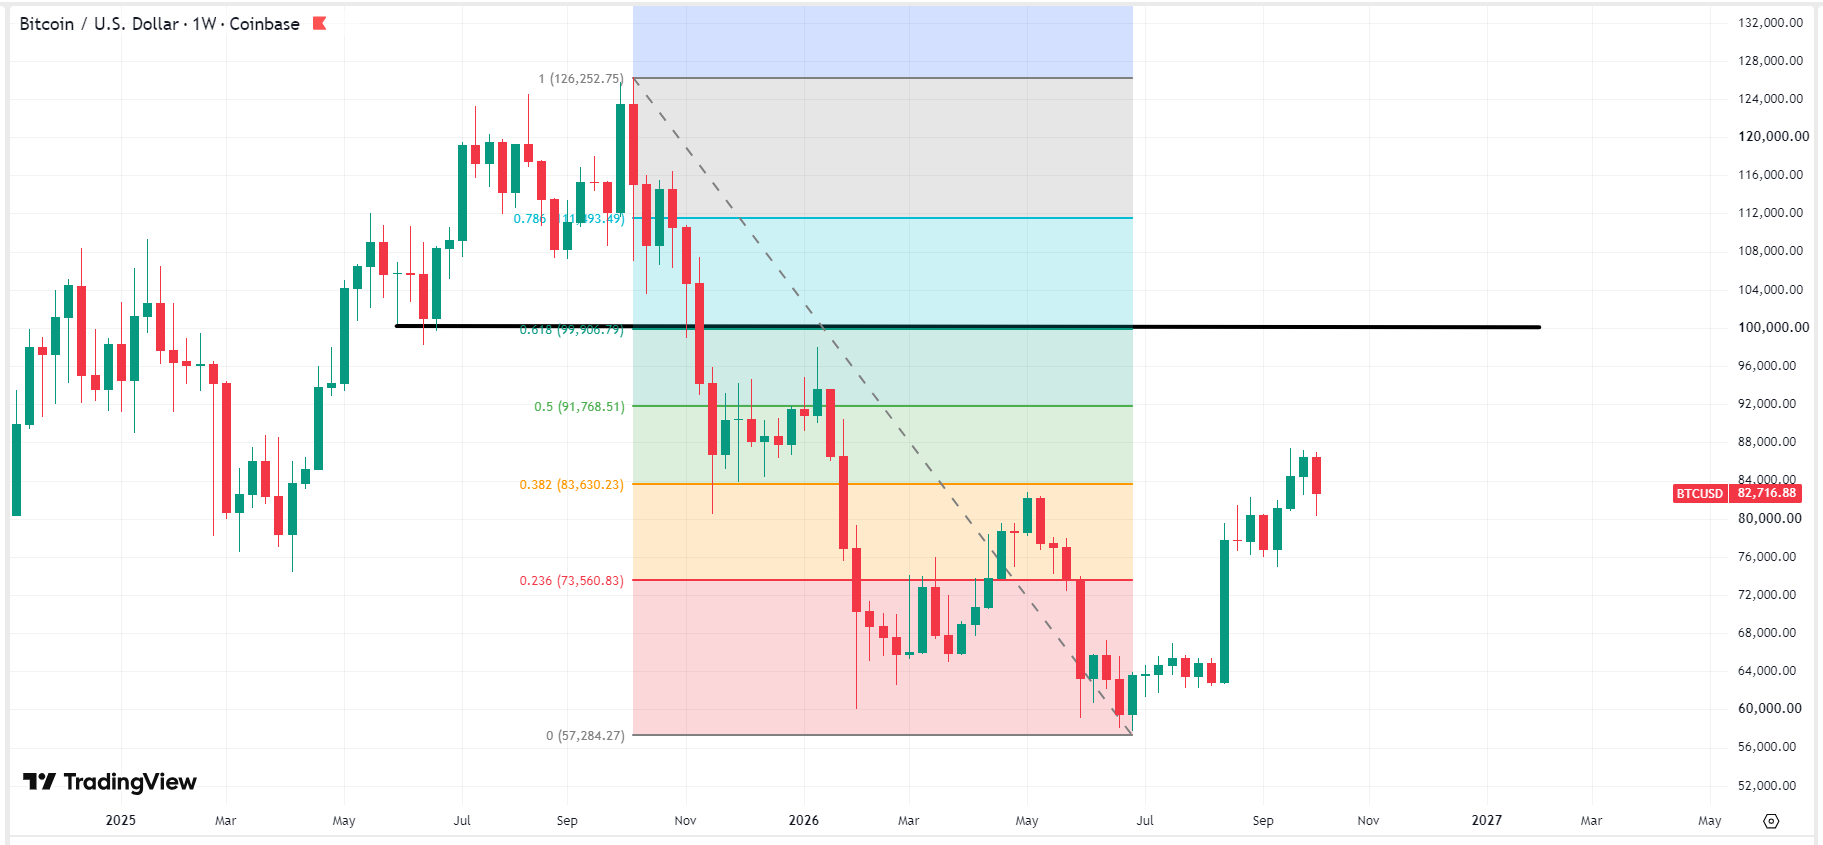 Bitcoin Price Chart (Weekly), Source: TradingView
It is worth noting that $80,000–$81,500 currently serves as the bull-bear pivot. As long as the weekly candlestick does not decisively break below 80,000 on high volume, the medium-to-long-term bullish structure of higher lows remains intact. However, an effective break below this key level would mean the bullish structure is broken, leaving a less-than-optimistic outlook for the market.
Conclusion
In 2026, Bitcoin displays a wave pattern of "surging then pulling back, a mid-year shakeout, and a second-half recovery." Driven by factors such as Federal Reserve policy, liquidity, and regulatory tailwinds, it staged a strong rebound in the second half. If it holds firm above the $80,000 bull-bear pivot and breaks through its previous high of $87,000, it could still test $100,000 this year.
Recommended Articles


