


WTI Crude Oil Price Forecast: Oil Holds $90, Poised to Challenge $100 Next Week
TradingKey - As of Friday (October 9) Eastern Time, WTI (USOIL) crude oil fell and then rose during intraday trading. Intraday oil prices briefly dropped to $90.01 before recovering losses to close at $91.67, up 0.55%. This round of oil price volatility was mainly driven by the combined impact of progress in U.S.-Iran negotiations and crude oil production disruptions in the U.S. Gulf of Mexico.
Expectations for US-Iran Talks Weigh on Oil Prices as US Hurricane Halts Provide Support
Oil prices fell in early trading on Friday, mainly impacted by news of progress in U.S.-Iran negotiations.
U.S. President Donald Trump stated that the U.S. and Iran are conducting constructive discussions and said the U.S. will not launch a military strike against Iran prior to the midterm elections on November 3. Meanwhile, Iran stated that it is evaluating the U.S. response to its proposal on reopening the Strait of Hormuz.
The above news reduced market expectations for a further near-term escalation in the Middle East situation. However, shipping restrictions in the Strait of Hormuz have not been fully lifted, and U.S. sanctions against Iranian crude oil shipments remain ongoing; therefore, uncertainty persists in the market's assessment regarding the actual recovery of Middle Eastern supply.
On the other hand, crude oil production in the U.S. Gulf of Mexico faced a new supply shock. As Hurricane Isaias approached the U.S. Gulf Coast, major oil companies suspended offshore production and evacuated staff. According to the latest statistics, as of Friday, approximately 1.5 million barrels per day of crude oil production in the Gulf of Mexico had been shut in, accounting for about 72% of the region's offshore crude output. This temporary supply reduction provided support for WTI crude prices and was a key reason oil prices turned from losses to close higher on Friday.
In addition, the latest data from the U.S. Energy Information Administration (EIA) showed that commercial crude oil inventories in the U.S. fell by 3.2 million barrels in the week ended October 2, significantly better than market expectations of a 1.7-million-barrel increase, bringing inventories down to 424.1 million barrels. Increased U.S. refining activity and growth in crude oil exports were key factors behind the inventory decline.
However, China's plan to resume refined oil product exports after the National Day holiday, along with the International Energy Agency's push to accelerate the release of emergency oil reserves, could also ease tightness in global fuel supply.
WTI Crude Oil Price Technical Analysis
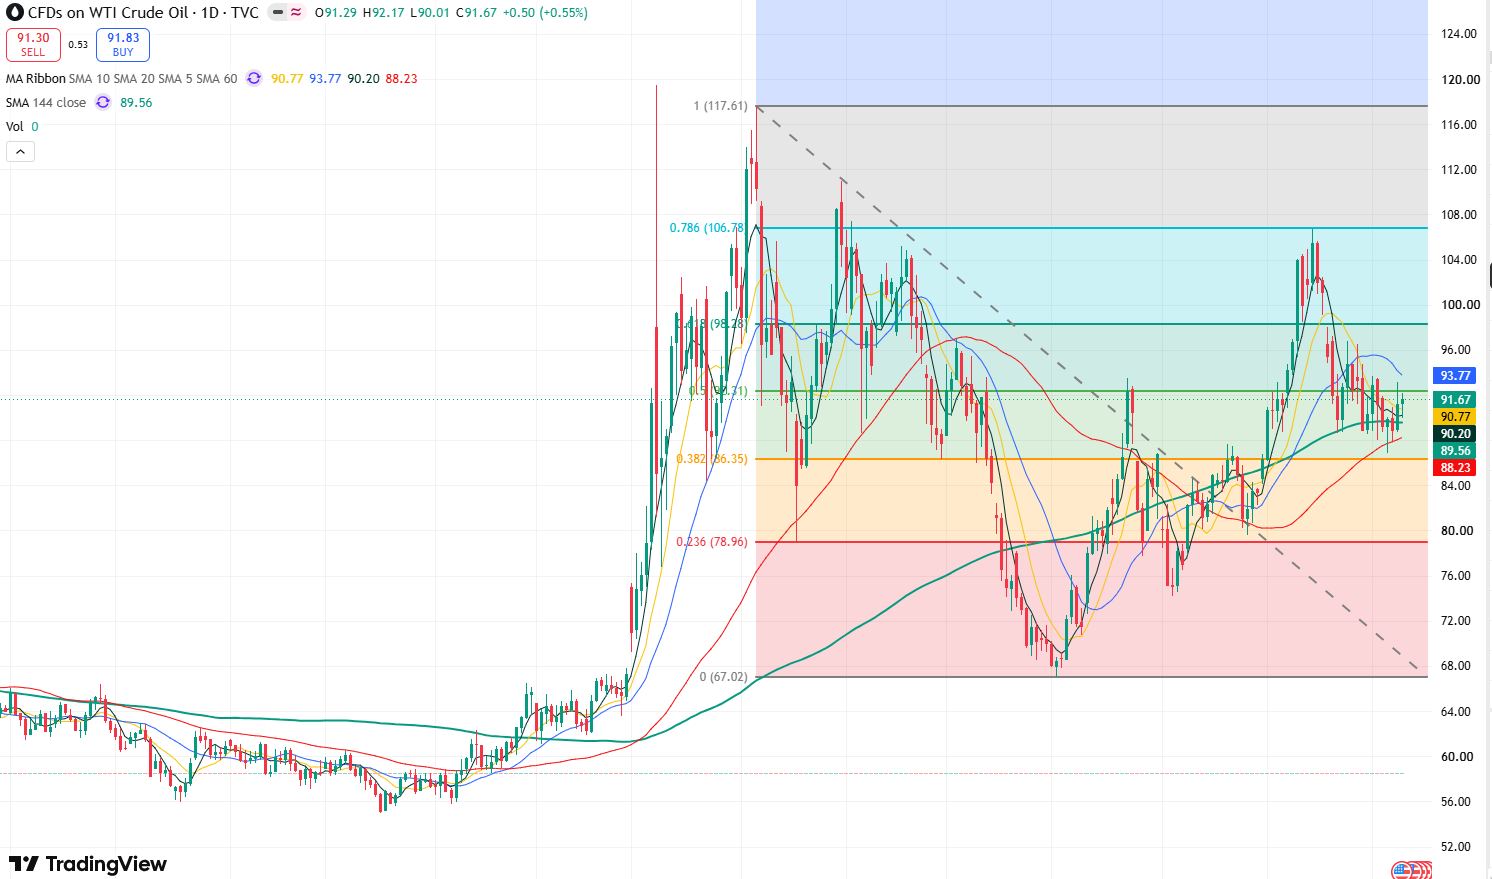
WTI crude oil price daily chart, Source: TradingView
Looking at the daily chart of WTI crude oil, prices rose to $106.75 on September 15, breaking above the May 18 high of $105.21, which technically opened up further upside space. However, oil prices began to pull back after touching the 0.786 Fibonacci retracement level of $106.78, indicating strong resistance at this level.
Currently, the candlestick structure of oil prices since July 2 shows a clear upward trend. Recently, oil prices pulled back to test the 60-day moving average and rose for two consecutive trading days, indicating strong support at this level and significantly strengthening bullish momentum. In the short term, oil prices may continue their upward trend, with the primary upside target testing the resistance level near $96.50. If broken, prices could further challenge the $100 mark.
On the downside, attention should first be paid to the $90–$90.50 support zone. If oil prices fall back below $90, they may test the $86 support level. If this zone fails to hold as well, short-term downside pressure could increase further.
Recommended Articles


