USD/CAD Price Forecast: Stuck in range below 1.3600 ahead of Canadian CPI/US Retail Sales

Quelle Fxstreet
  • USD/CAD continues with its struggle to gain any meaningful traction amid mixed cues.
  • The USD languishes near the YTD low amid dovish Fed expectations and cap the upside.
  • A downtick in Crude Oil prices undermines the Loonie and acts as a tailwind for the pair.

The USD/CAD pair extends its sideways consolidative price move on Tuesday and remains confined in a familiar range held over the past week or so. Spot prices, meanwhile, remain below the 1.3600 mark through the early European session amid a bearish US Dollar (USD), though the downside seems cushioned ahead of the key central bank event risk.

The markets are now pricing in a greater chance of an oversized interest rate cut by the Federal Reserve (Fed) amid signs that inflation in the US was subsiding. This, in turn, drags the US Treasury bond yields to one or two-year lows, which, along with the upbeat market mood, keeps the USD depressed near the 2024 trough touched on Monday and acts as a headwind for the USD/CAD pair. 

That said, a modest pullback in Crude Oil prices from a nearly two-week high and bets for additional interest rate cuts by the Bank of Canada (BoC) undermines the commodity-linked Loonie. This could hold back traders from placing aggressive bearish bets around the USD/CAD pair and help limit deeper losses ahead of the Canadian consumer inflation figures, due later this Tuesday.

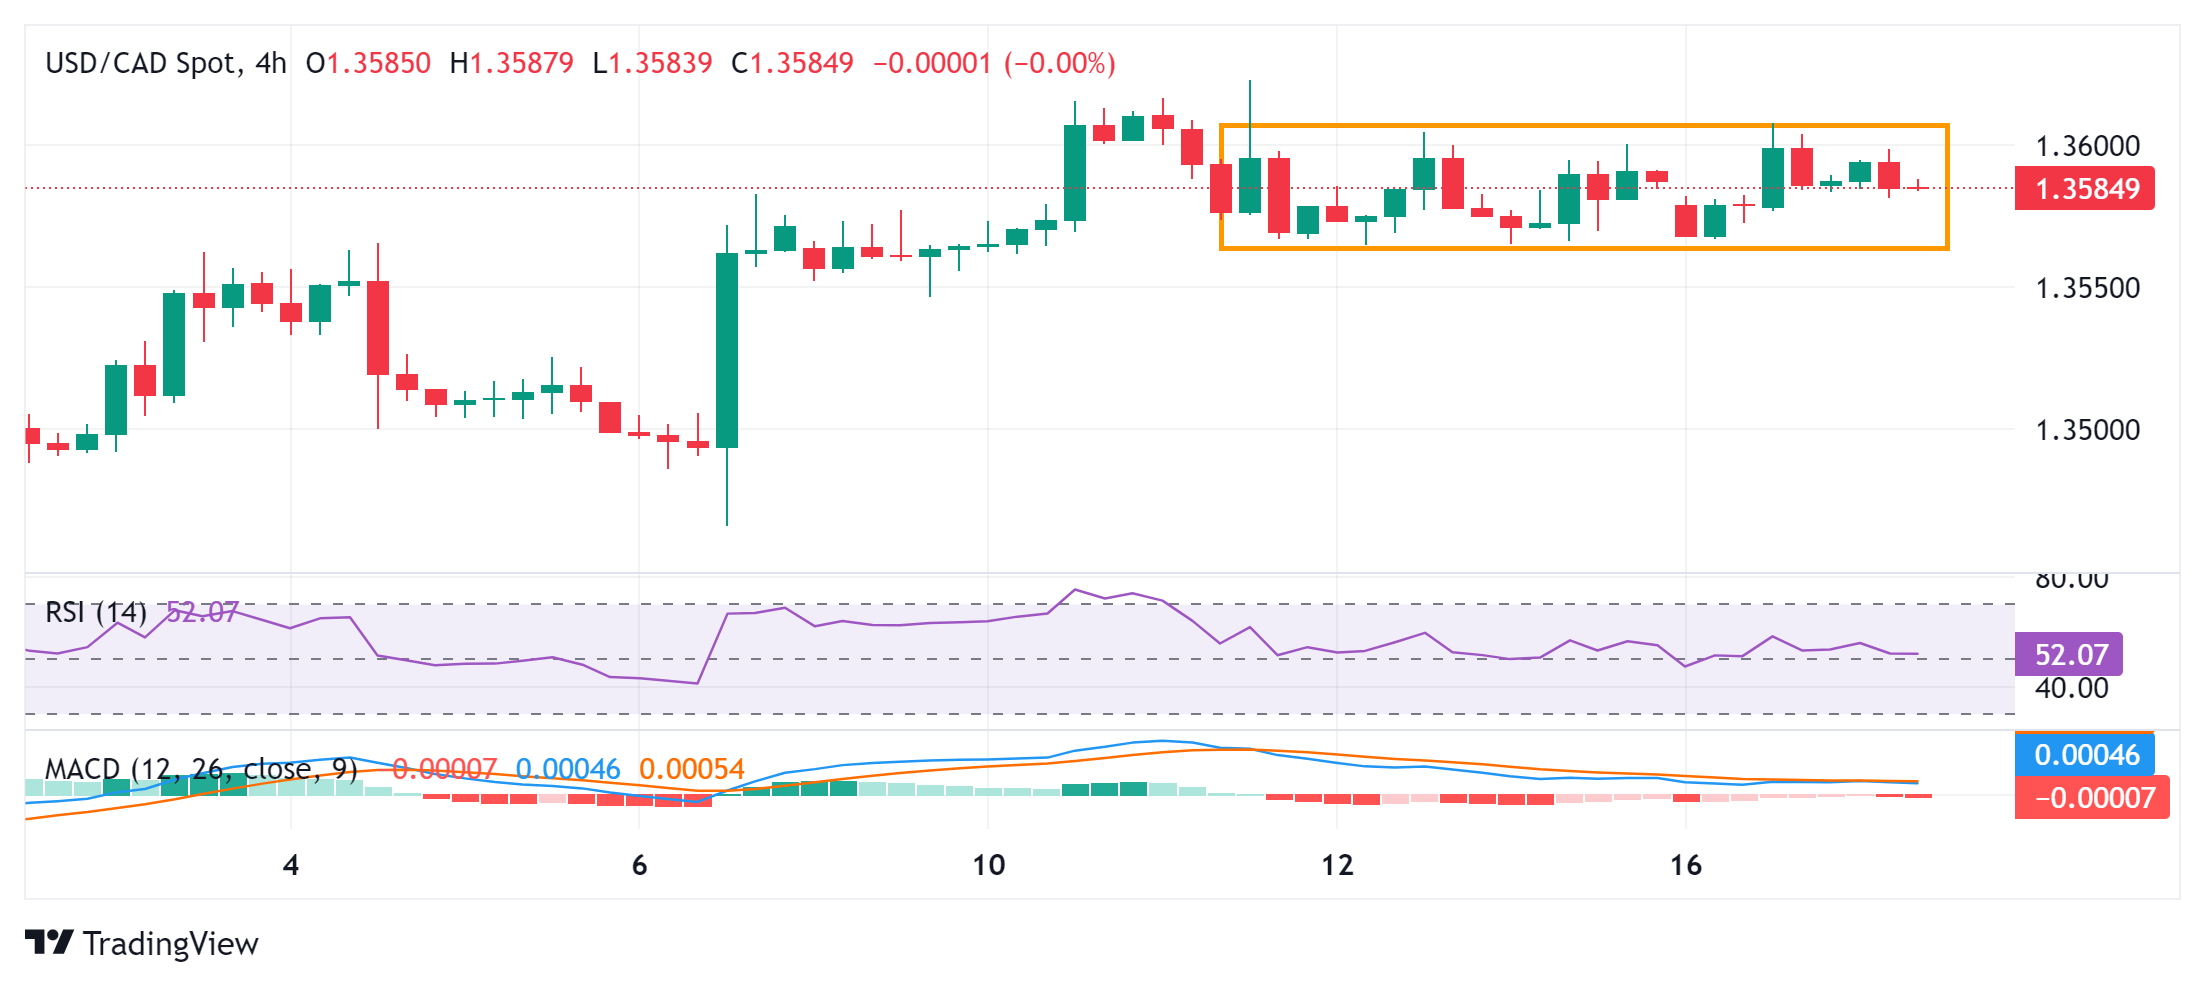
From a technical perspective, the recent repeated failures to find acceptance above the 1.3600 mark favor bearish traders. That said, the range-bound price action around the very important 200-day Simple Moving Average (SMA) constitutes the formation of a rectangle and marks a consolidation phase. Moreover, neutral oscillators on the daily chart warrant some caution before placing directional bets. 

Meanwhile, strength beyond the 1.3600 mark is likely to confront some resistance near the monthly peak, around the 1.3620-1.3625 region touched last week. Some follow-through buying will set the stage for an extension of the recent recovery from the multi-month low touched in August and lift the USD/CAD pair further beyond the 1.3665-1.3670 intermediate hurdle, towards the 1.3700 round figure. 

On the flip side, the 1.3565 horizontal zone now seems to have emerged as immediate support, below which spot prices could accelerate the fall towards the 1.3500 psychological mark. A convincing break below the latter will expose the multi-month low, around the 1.3440 area, and drag the USD/CAD pair further towards the 1.3400 mark en route to the February swing low, around the 1.3365 region.

USD/CAD 4-hour chart

fxsoriginal

Economic Indicator

Consumer Price Index (YoY)

The Consumer Price Index (CPI), released by Statistics Canada on a monthly basis, represents changes in prices for Canadian consumers by comparing the cost of a fixed basket of goods and services. The YoY reading compares prices in the reference month to the same month a year earlier. Generally, a high reading is seen as bullish for the Canadian Dollar (CAD), while a low reading is seen as bearish.

Read more.

Next release: Tue Sep 17, 2024 12:30

Frequency: Monthly

Consensus: -

Previous: 2.5%

Source: Statistics Canada


Haftungsausschluss: Nur zu Informationszwecken. Die bisherige Performance ist kein verlässlicher Indikator für zukünftige Ergebnisse.
placeholder
EUR/USD Kursprognose: Blick auf die 1.1800-Marke nahe ZweimonatshochsEUR/USD baut seine Gewinne am zweiten Tag in Folge aus und notiert während der asiatischen Handelsstunden am Dienstag um 1,1780. Die technische Analyse der Tages-Chart zeigt eine anhaltende bullische Tendenz, da sich das Paar innerhalb des aufsteigenden Kanal-Musters nach oben bewegt.
Autor  FXStreet
vor 16 Stunden
EUR/USD baut seine Gewinne am zweiten Tag in Folge aus und notiert während der asiatischen Handelsstunden am Dienstag um 1,1780. Die technische Analyse der Tages-Chart zeigt eine anhaltende bullische Tendenz, da sich das Paar innerhalb des aufsteigenden Kanal-Musters nach oben bewegt.
placeholder
Aave Preis-Prognose: AAVE setzt Verluste fort, da Whale-Verkäufe an Intensität gewinnenAave (AAVE) setzt seine Verluste fort, da Whale-Verkäufe den Verkaufsdruck verstärken und der Preis unter $162 bleibt. Ein Durchbruch der Unterstützung bei $160,51 könnte den Abwärtstrend bis $147,13 fortsetzen.
Autor  Mitrade Team
Gestern 08: 37
Aave (AAVE) setzt seine Verluste fort, da Whale-Verkäufe den Verkaufsdruck verstärken und der Preis unter $162 bleibt. Ein Durchbruch der Unterstützung bei $160,51 könnte den Abwärtstrend bis $147,13 fortsetzen.
placeholder
Top 10 Krypto-Prognosen für 2026: Institutionelle Nachfrage und Großbanken könnten Bitcoin Rückenwind gebenFür 2026 rücken institutionelle Nachfrage, ETF-Flows (über $700 million Abflüsse im Dezember), BTC-Reserve-Asset-Thesen (3.74 million BTC bei 251 Entities) und zehn Marktprognosen in den Fokus – inklusive eines möglichen Bitcoin-Ziels von $140,259 bei bullischem Ausbruch.
Autor  Mitrade Team
Gestern 08: 00
Für 2026 rücken institutionelle Nachfrage, ETF-Flows (über $700 million Abflüsse im Dezember), BTC-Reserve-Asset-Thesen (3.74 million BTC bei 251 Entities) und zehn Marktprognosen in den Fokus – inklusive eines möglichen Bitcoin-Ziels von $140,259 bei bullischem Ausbruch.
placeholder
Hyperliquid-Preisprognose: Bullishes Interesse wächst im Zuge der NutzererholungHyperliquid (HYPE) wird zum Zeitpunkt der Veröffentlichung am Montag bei 25 USD gehandelt und hält die 3% Gewinne vom Vortag. Die perpetual exchange verzeichnet eine Erholung der aktiven Nutzer, während die wöchentlich erhobenen Gebühren auf den niedrigsten Stand des bisherigen Monats sinken
Autor  FXStreet
Gestern 06: 46
Hyperliquid (HYPE) wird zum Zeitpunkt der Veröffentlichung am Montag bei 25 USD gehandelt und hält die 3% Gewinne vom Vortag. Die perpetual exchange verzeichnet eine Erholung der aktiven Nutzer, während die wöchentlich erhobenen Gebühren auf den niedrigsten Stand des bisherigen Monats sinken
placeholder
Goldminen steigen, Goldbarren gewinnen (19. Dez.)22. Dez - Aktien von Goldminenbetreibern legen zu und folgen dem Anstieg des Goldpreises GOL/Spotgold XAU= steigt um 0,27 Prozent auf Dollar 4.342,82/Unze Goldbarren legen auf Wochensicht zuDie führenden Bergbauunternehmen Newmont NEM.N und Barrick Mining ABX.TO steigen um 1,3 Prozent bzw. 2,4 Proze...
Autor  Reuters
Gestern 06: 46
22. Dez - Aktien von Goldminenbetreibern legen zu und folgen dem Anstieg des Goldpreises GOL/Spotgold XAU= steigt um 0,27 Prozent auf Dollar 4.342,82/Unze Goldbarren legen auf Wochensicht zuDie führenden Bergbauunternehmen Newmont NEM.N und Barrick Mining ABX.TO steigen um 1,3 Prozent bzw. 2,4 Proze...
verbundene Finanzinstrumente
goTop
quote