EUR/GBP Price Analysis: Bearish momentum intensifies, buyers rejected by the 20-day SMA

Quelle Fxstreet
  • The EUR/GBP pair extended its losses on Monday, declining to 0.8425.
  • Technical indicators, including the RSI and MACD, suggest that selling pressure is increasing.
  • Bulls failed to conquer the 20-day SMA which paved the way for the downside.

In Monday's session the EUR/GBP and declined by 0.15% to 0.8425. The pair has been trading sideways in a narrow range over the past sessions, with no clear directional bias. However, the latest price action suggests that selling pressure is increasing after the 20-day Simple Moving Average (SMA) rejected the buyers at 0.8445.

The Relative Strength Index (RSI) is currently at 43 and its slope is declining sharply, suggesting that selling pressure is rising. The Moving Average Convergence Divergence (MACD) is flat with a green histogram, indicating that buying pressure is flat. The overall outlook is mixed, with the RSI suggesting that selling pressure is rising and the MACD suggesting that buying pressure is flat leaving the cross exposed to further declines.

EUR/GBP daily chart

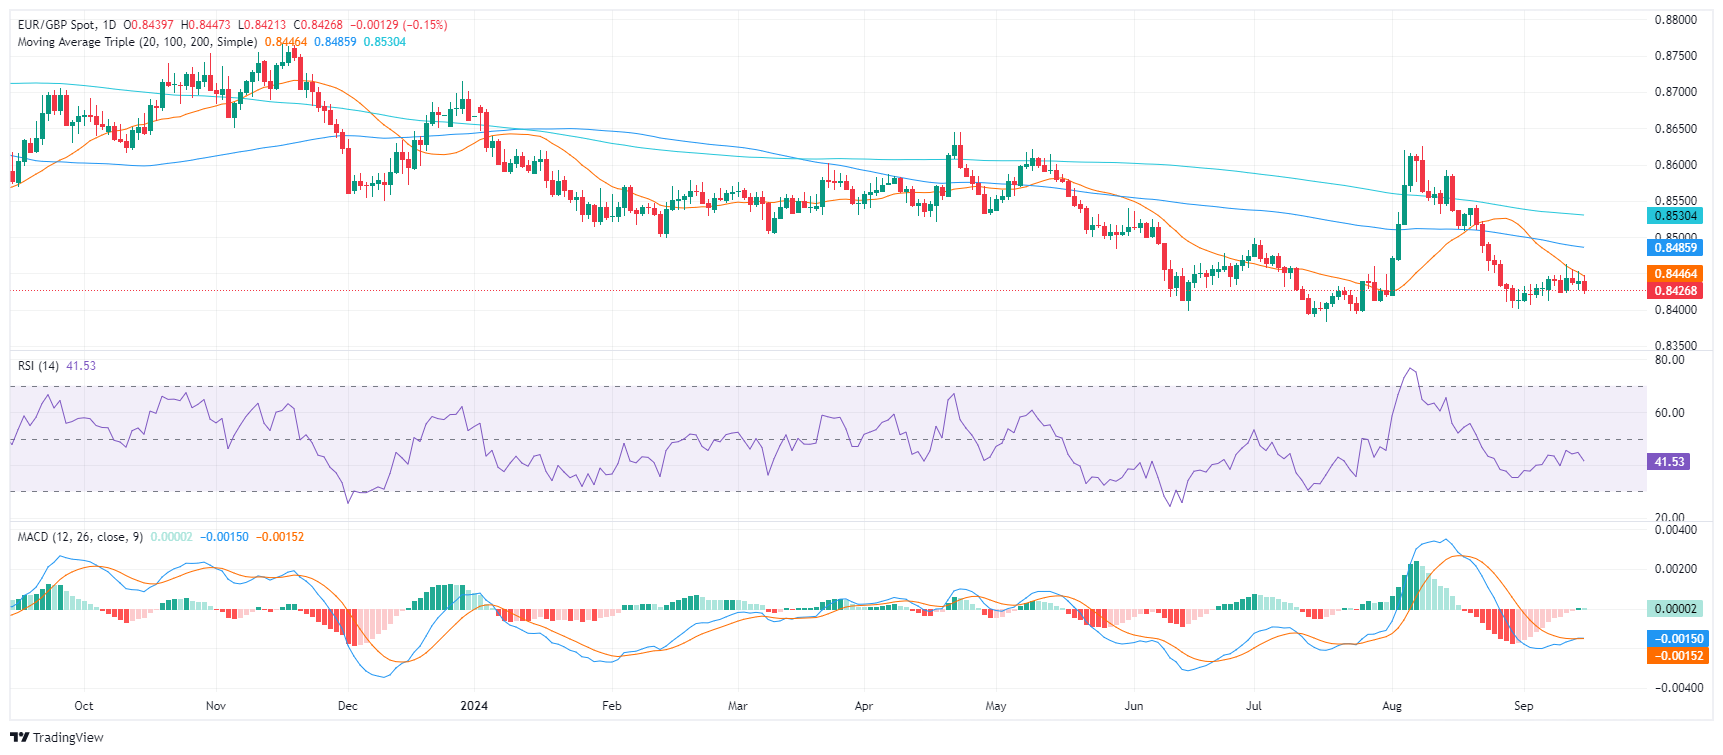
The EUR/GBP pair has been consolidating within a narrow range for the past few trading sessions, fluctuating between 0.8425 and 0.8450. This consolidation is indicative of a lack of clear directional bias in the near term. If the pair manages to break below the immediate support level of 0.8425, it could potentially target 0.8410 and 0.8400. Conversely, a break above 0.8445 (20-day SMA) could open up further upside potential above 0.8470.

Haftungsausschluss: Nur zu Informationszwecken. Die bisherige Performance ist kein verlässlicher Indikator für zukünftige Ergebnisse.
placeholder
Ripple-Schock: Diese Zahl entscheidet über XRP-Absturz oder RallyeXRP kommt einfach nicht vom Fleck – und genau das macht die Lage jetzt so brisant. Während viele Anleger auf den nächsten Ausbruch hoffen, tritt der Ripple-Token seit Tagen auf der Stelle. Der Kurs pendelt knapp über der psychologisch extrem wichtigen Marke von 2,00 US-Dollar.
Autor  FXStreet
Mi. 14.Jan
XRP kommt einfach nicht vom Fleck – und genau das macht die Lage jetzt so brisant. Während viele Anleger auf den nächsten Ausbruch hoffen, tritt der Ripple-Token seit Tagen auf der Stelle. Der Kurs pendelt knapp über der psychologisch extrem wichtigen Marke von 2,00 US-Dollar.
placeholder
Bernstein-Analyse: Bitcoin-Boden bei 60.000 Dollar? Die institutionelle Brandmauer stehtWarum Bitcoin bei 60.000 Dollar den Boden finden könnte und wie ETFs, KI-Miner und die US-Politik eine Erholung im ersten Halbjahr stützen.
Autor  Mitrade Team
Di. 03.Feb
Warum Bitcoin bei 60.000 Dollar den Boden finden könnte und wie ETFs, KI-Miner und die US-Politik eine Erholung im ersten Halbjahr stützen.
placeholder
Bitcoin, Ethereum und Ripple im freien Fall – Wo liegt der Boden?Bitcoin fällt auf 72.945 $(Tief seit Nov. 2024), Ethereum testet 2.110$. Chartanalyse zu Fibonacci-Levels, RSI-Überverkauftheit und Kurszielen.
Autor  Mitrade Team
Mi. 04.Feb
Bitcoin fällt auf 72.945 $(Tief seit Nov. 2024), Ethereum testet 2.110$. Chartanalyse zu Fibonacci-Levels, RSI-Überverkauftheit und Kurszielen.
placeholder
Solana-Crash: Kurs fällt unter 100 Dollar – Trotz Transaktions-Rekord flüchten AnlegerSOL fällt unter 100 $trotz Rekord-Transaktionen. Institutionelle Zurückhaltung und massive Long-Liquidationen drücken den Kurs Richtung 85$.
Autor  Mitrade Team
Mi. 04.Feb
SOL fällt unter 100 $trotz Rekord-Transaktionen. Institutionelle Zurückhaltung und massive Long-Liquidationen drücken den Kurs Richtung 85$.
placeholder
Strategie-Beben bei Ethereum: Buterin erklärt Rollup-Roadmap für obsoletVitalik Buterin vollzieht radikalen Strategiewechsel und erklärt Rollup-Roadmap für obsolet. ETH-Kurs unter Druck bei 2.280 $.
Autor  Mitrade Team
Mi. 04.Feb
Vitalik Buterin vollzieht radikalen Strategiewechsel und erklärt Rollup-Roadmap für obsolet. ETH-Kurs unter Druck bei 2.280 $.
verbundene Finanzinstrumente
goTop
quote