EUR/USD Price Forecast: Flirts with descending channel resistance, just below 1.1100 mark

Quelle Fxstreet
  • EUR/USD builds on this week’s bounce from a multi-week low amid a bearish USD.
  • Bets for a larger rate cut by the Fed and a positive risk tone weigh on the Greenback.
  • Bulls need to wait for a break through a descending channel before placing fresh bets.

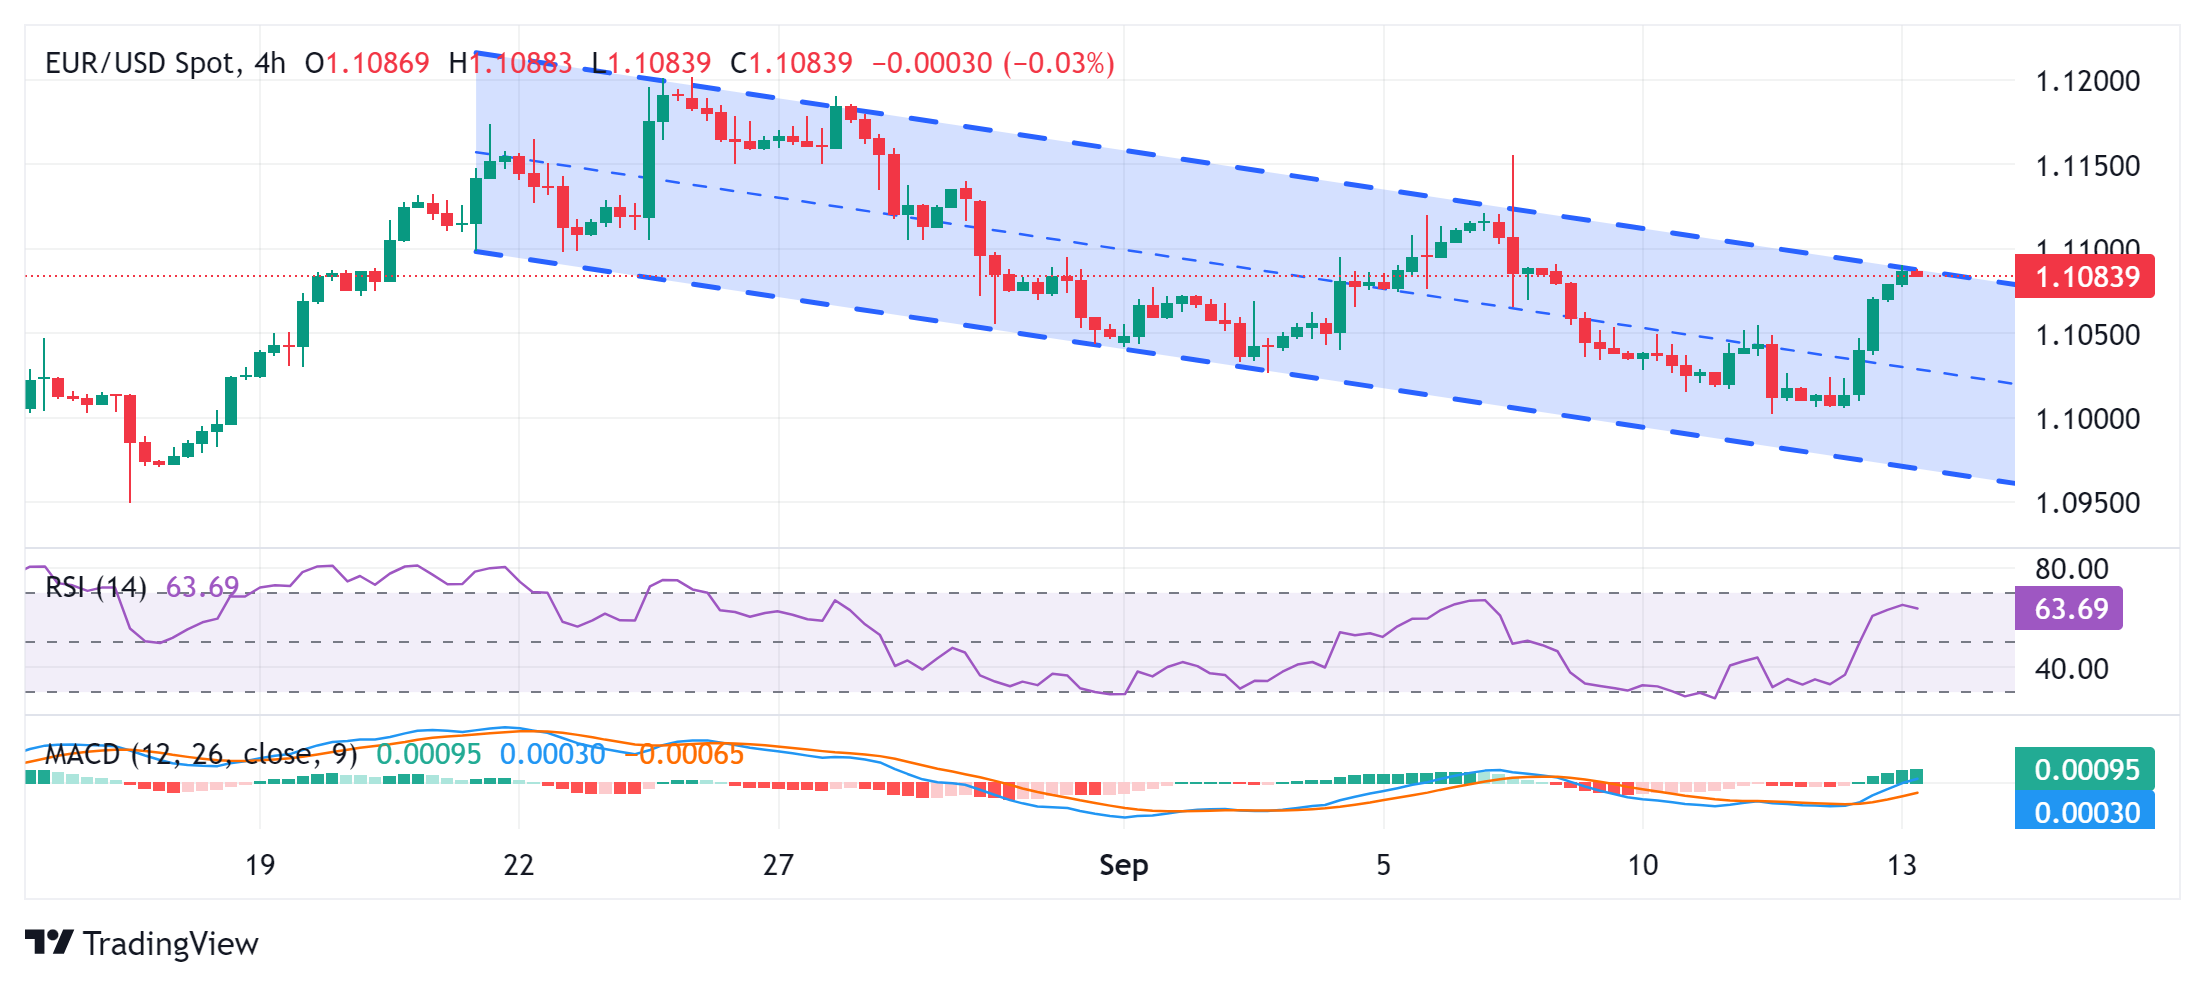
The EUR/USD pair builds on the previous day's goodish recovery move from the 1.1000 psychological mark, or a nearly four-week low and attracts some follow-through buyers for the second straight day on Friday. The momentum lifts spot prices to the top end of the weekly range, around the 1.1090 area during the Asian session and is sponsored by broad-based US Dollar (USD) weakness.

The softer-than-expected US Producer Price Index (PPI) report released on Thursday lifted bets for a larger interest rate cut by the Federal Reserve (Fed) next week. This, along with a positive risk tone, drags the USD to over a one-week low and turns out to be a key factor acting as a tailwind for the EUR/USD pair. Meanwhile, the European Central Bank (ECB) refrained from providing a specific interest rate guidance, which underpins the shared currency and contributes to the bid tone surrounding the currency pair. 

From a technical perspective, spot prices currently trade near the top end of over a three-week-old descending trend channel. A sustained strength beyond will suggest that the recent corrective decline from the highest level since July 2023 touched last month, has run its course and pave the way for a further near-term appreciating move. The EUR/USD pair might then accelerate the positive move towards the next relevant hurdle near the 1.1155 area before making a fresh attempt to conquer the 1.1200 round-figure mark. 

On the flip side, the 1.1065-1.1060 horizontal zone now seems to protect the immediate downside ahead of the 1.1000 pivotal support. The latter is closely followed by the descending trend-channel support, currently near the 1.0975 area, which if broken decisively will be seen as a fresh trigger for bearish traders and prompt aggressive technical selling. The subsequent downfall has the potential to drag the EUR/USD pair towards testing sub-1.0900 levels, with some intermediate support near the 1.0950 region.

EUR/USD 4-hour chart

fxsoriginal

Haftungsausschluss: Nur zu Informationszwecken. Die bisherige Performance ist kein verlässlicher Indikator für zukünftige Ergebnisse.
placeholder
Silberpreis heute: Silber steigt laut FXStreet-DatenDie Preise für Silber (XAG/USD) sind laut FXStreet-Daten am Freitag gestiegen. Der Silberpreis liegt bei 77,91 USD pro Feinunze und damit um 1,29 % höher als die 76,92 USD, die am Donnerstag gezahlt wurden
Autor  FXStreet
Fr. 09.Jan
Die Preise für Silber (XAG/USD) sind laut FXStreet-Daten am Freitag gestiegen. Der Silberpreis liegt bei 77,91 USD pro Feinunze und damit um 1,29 % höher als die 76,92 USD, die am Donnerstag gezahlt wurden
placeholder
Silberpreis-Prognose: XAG/USD handelt über 77,00 US-Dollar, nachdem er vom neuntägigen EMA abgeprallt istDer Silberpreis (XAG/USD) gewinnt nach zwei Tagen der Verluste an Boden und handelt während der asiatischen Handelsstunden am Freitag um die Marke von 77,20 USD je Feinunze.
Autor  FXStreet
Fr. 09.Jan
Der Silberpreis (XAG/USD) gewinnt nach zwei Tagen der Verluste an Boden und handelt während der asiatischen Handelsstunden am Freitag um die Marke von 77,20 USD je Feinunze.
placeholder
XRP-Beben: Warum Ripple 2026 böse überraschen könnteWas ist da bei Ripple los? XRP rutscht bereits den dritten Tag in Folge ab – und plötzlich ist die Euphorie der Jahresanfangsrally wie weggeblasen. Noch am Dienstag jubelten Anleger über Kurse von 2,41 US-Dollar, dem höchsten Stand seit dem 14. November.
Autor  FXStreet
Fr. 09.Jan
Was ist da bei Ripple los? XRP rutscht bereits den dritten Tag in Folge ab – und plötzlich ist die Euphorie der Jahresanfangsrally wie weggeblasen. Noch am Dienstag jubelten Anleger über Kurse von 2,41 US-Dollar, dem höchsten Stand seit dem 14. November.
placeholder
Solana-Ausblick: SOL über $140 – Bullen nehmen $160 ins Visier, ETF-Zuflüsse bleiben robustSolana (SOL) über $140 nach Rebound an der 50-Tage-EMA $136.75. Spot-ETFs mit netto Wochenzufluss von $41.08 million (höchster Wert seit Mitte Dezember), Assets bei $1.10 billion. Technisch bleibt $160 das nächste Ziel.
Autor  Mitrade Team
Fr. 09.Jan
Solana (SOL) über $140 nach Rebound an der 50-Tage-EMA $136.75. Spot-ETFs mit netto Wochenzufluss von $41.08 million (höchster Wert seit Mitte Dezember), Assets bei $1.10 billion. Technisch bleibt $160 das nächste Ziel.
placeholder
Top-3-Ausblick: Bitcoin, Ethereum und XRP verteidigen Schlüsselmarken – Hoffnung auf Fortsetzung der ErholungBitcoin hält $90,000 und blickt auf $94,253; Ethereum ringt um 50-day EMA $3,128 nach Abweisung an 100-day EMA $3,298; XRP stabilisiert über 50-day EMA $2.07 mit Ziel $2.35.
Autor  Mitrade Team
Fr. 09.Jan
Bitcoin hält $90,000 und blickt auf $94,253; Ethereum ringt um 50-day EMA $3,128 nach Abweisung an 100-day EMA $3,298; XRP stabilisiert über 50-day EMA $2.07 mit Ziel $2.35.
verbundene Finanzinstrumente
goTop
quote