


USD/INR moves slightly lower due to a dovish sentiment surrounding the Fed
- The Indian Rupee may appreciate as US data reinforce the likelihood of an aggressive Fed rate cut.
- CME FedWatch Tool suggests the likelihood of a 50 bps rate cut has sharply increased to 41.0%.
- India Consumer Price Index increased 3.65% in August, against the expected 3.55% and July’s 3.54% readings.
The USD/INR pair holds its position on Friday following the losses registered in the previous as recent US economic data reinforced the odds of an aggressive rate cut by the Federal Reserve (Fed) next week.
According to the CME FedWatch Tool, markets are fully pricing at least a 25 basis point (bps) rate cut by the Federal Reserve at its September meeting. The likelihood of a 50 bps rate cut has sharply increased to 41.0%, up from 14.0% a day ago.
India's August retail inflation was slightly higher than economists' expectations on the back of a sharp rise in vegetable prices, Reuters cited government data released on Thursday. Consumer Price Index (CPI) rose 3.65% in August, compared with expected 3.55% and July’s 3.54% readings.
On Thursday, Reuters cited five traders stating that the Reserve Bank of India (RBI) might have intervened in the open markets to prevent the Indian Rupee (INR) from weakening beyond the 84.00 level. Traders await Trade Deficit Government and FX Reserves, USD scheduled to be released on Friday.
Daily Digest Market Movers: Indian Rupee may hold position due to improved risk sentiment
- The Reserve Bank of India Governor Shaktikanta Das said at the Bretton Woods Committee's annual Future of Finance Forum on Friday that India's growth potential is 7.5% or more, which is a little above the central bank's full-year forecast for 2024 of 7.2%, per Reuters.
- The US Producer Price Index (PPI) rose to 0.2% month-on-month in August, exceeding the forecasted 0.1% increase and the previous 0.0%. Meanwhile, core PPI accelerated to 0.3% MoM, against the expected 0.2% rise and July’s 0.2% contraction.
- US Initial Jobless Claims rose slightly higher for the week ended September 6, increasing to the expected 230K from the prior 228K reading.
- India’s Industrial Output rose by 4.8% in July, slightly above market expectations of 4.7%, following a 4.2% growth in the previous month.
- India is considering relaxing investment rules for Chinese firms to stimulate its manufacturing sector. Additionally, the country has eased visa issuance for Chinese nationals to support local manufacturing. India's trade deficit with China has nearly doubled since 2020, according to a Reuters report.
- The US Consumer Price Index dipped to 2.5% year-on-year in August, from the previous reading of 2.9%. The index has fallen short of the expected 2.6% reading. Meanwhile, headline CPI stood at 0.2% MoM. Core CPI ex Food & Energy, remained unchanged at 3.2% YoY. On a monthly basis, core CPI rose to 0.3% from the previous 0.2% reading.
- The first US presidential debate between former President Donald Trump and Democratic nominee Kamala Harris in Pennsylvania was won by Harris, according to a CNN poll. The debate began with a critical focus on the economy, inflation, and economic policies.
Technical Analysis: USD/INR breaks below symmetrical triangle, hovering below 84.00
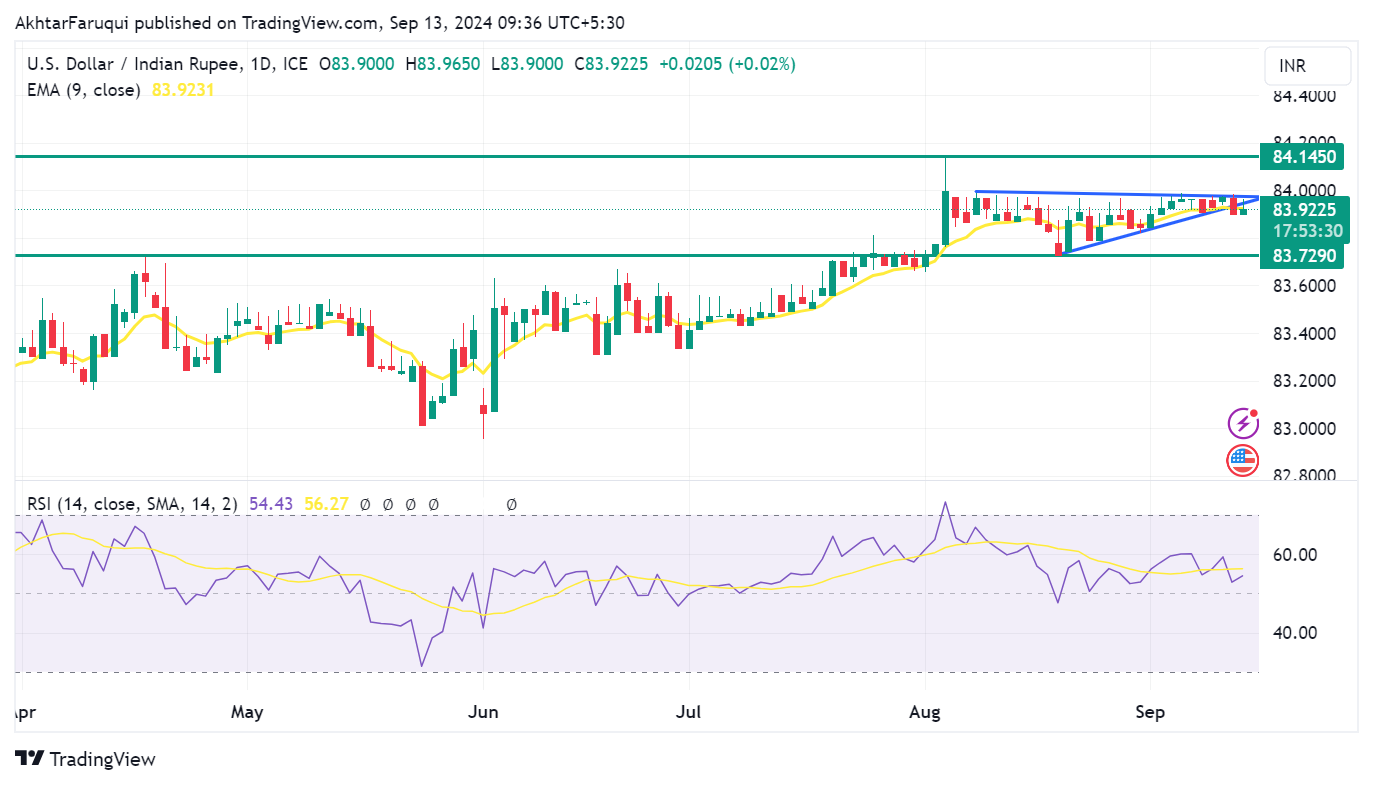
The USD/INR pair trades around 83.90 on Friday. Analysis of the daily chart shows that the USD/INR pair has broken below the symmetrical triangle pattern, indicating the emergence of a bearish bias. However, the 14-day Relative Strength Index (RSI) remains slightly above the 50 level, suggesting a retest of the triangle pullback cannot be ruled out.
On the downside, the USD/INR pair may retest its six-week low around 83.72, followed by the psychological level of 83.50.
In terms of resistance, the nine-day Exponential Moving Average (EMA) at 83.91 could serve as an immediate barrier, aligning with the lower boundary of the symmetrical triangle near 83.95.
Further resistance appears at the upper boundary of the symmetrical triangle near the 84.00 level. A breakout above this point could propel the pair toward the all-time high of 84.14, recorded on August 5.
USD/INR: Daily Chart
Indian Rupee FAQs
The Indian Rupee (INR) is one of the most sensitive currencies to external factors. The price of Crude Oil (the country is highly dependent on imported Oil), the value of the US Dollar – most trade is conducted in USD – and the level of foreign investment, are all influential. Direct intervention by the Reserve Bank of India (RBI) in FX markets to keep the exchange rate stable, as well as the level of interest rates set by the RBI, are further major influencing factors on the Rupee.
The Reserve Bank of India (RBI) actively intervenes in forex markets to maintain a stable exchange rate, to help facilitate trade. In addition, the RBI tries to maintain the inflation rate at its 4% target by adjusting interest rates. Higher interest rates usually strengthen the Rupee. This is due to the role of the ‘carry trade’ in which investors borrow in countries with lower interest rates so as to place their money in countries’ offering relatively higher interest rates and profit from the difference.
Macroeconomic factors that influence the value of the Rupee include inflation, interest rates, the economic growth rate (GDP), the balance of trade, and inflows from foreign investment. A higher growth rate can lead to more overseas investment, pushing up demand for the Rupee. A less negative balance of trade will eventually lead to a stronger Rupee. Higher interest rates, especially real rates (interest rates less inflation) are also positive for the Rupee. A risk-on environment can lead to greater inflows of Foreign Direct and Indirect Investment (FDI and FII), which also benefit the Rupee.
Higher inflation, particularly, if it is comparatively higher than India’s peers, is generally negative for the currency as it reflects devaluation through oversupply. Inflation also increases the cost of exports, leading to more Rupees being sold to purchase foreign imports, which is Rupee-negative. At the same time, higher inflation usually leads to the Reserve Bank of India (RBI) raising interest rates and this can be positive for the Rupee, due to increased demand from international investors. The opposite effect is true of lower inflation.
Empfohlene Artikel


