


Top Altcoins Price Forecast: Ripple, Cardano, and Dogecoin show weakness – Crucial EMAs in focus
- Ripple hovers around $1.37 on Tuesday, testing its 200-day EMA support at $1.35.
- Cardano shows a mild rebound from its 50-day EMA around $0.1917, following a 15% decline last week.
- Dogecoin tests its 100-day EMA around $0.0816 after a 12% pullback last week.
Ripple (XRP), Cardano (ADA), and Dogecoin (DOGE) remain weak after double-digit losses last week, testing their crucial Exponential Moving Averages (EMAs) for immediate support. The technical outlook warns of further weakness in the prices of XRP, ADA, and DOGE as bullish momentum eases.
Ripple tests its 200-day EMA support
Ripple trades around $1.3725, holding above the 50-day and 100-day EMAs, clustered around $1.21, and testing the 200-day EMA at $1.35, which collectively underpin a mild bullish near-term bias.
From a technical perspective, the 50% retracement level of the $2.41 to $0.98 downswing at $1.54 capped gains, resulting in a 10% pullback last week. A confirmed breakout below $1.35 could target the support cluster at the 23.6% Fibonacci retracement and the 50-day and 100-day EMAs near $1.21.
Momentum has cooled, with the Moving Average Convergence Divergence (MACD) slipping slightly below its signal line, yet the Relative Strength Index (RSI) at 61 still suggests constructive buying interest easing from overbought excess.
On the topside, bulls face first resistance at the 50% retracement around $1.54, with additional barriers at the 78.6% Fibonacci retracement level near $1.99.
Cardano takes support at its 50-day EMA
Cardano extends gains on Tuesday, advancing its 2% rise from the previous day above its 50-day EMA at $0.1916. The altcoin now tests the 100-day EMA at $0.1975, suggesting a mildly constructive near-term tone.
Still, ADA remains capped beneath the 200-day EMA at $0.2434, near the 50% retracement of the downswing from $0.4370 to $0.1382 at $0.2458. A confirmed breakout above $0.1975 could target the 200-day EMA at $0.2434.
Momentum shows weakness as the MACD slopes downward below its signal line, hinting at fading upside momentum, while the RSI around 51 suggests neutral conditions following the recent recovery.
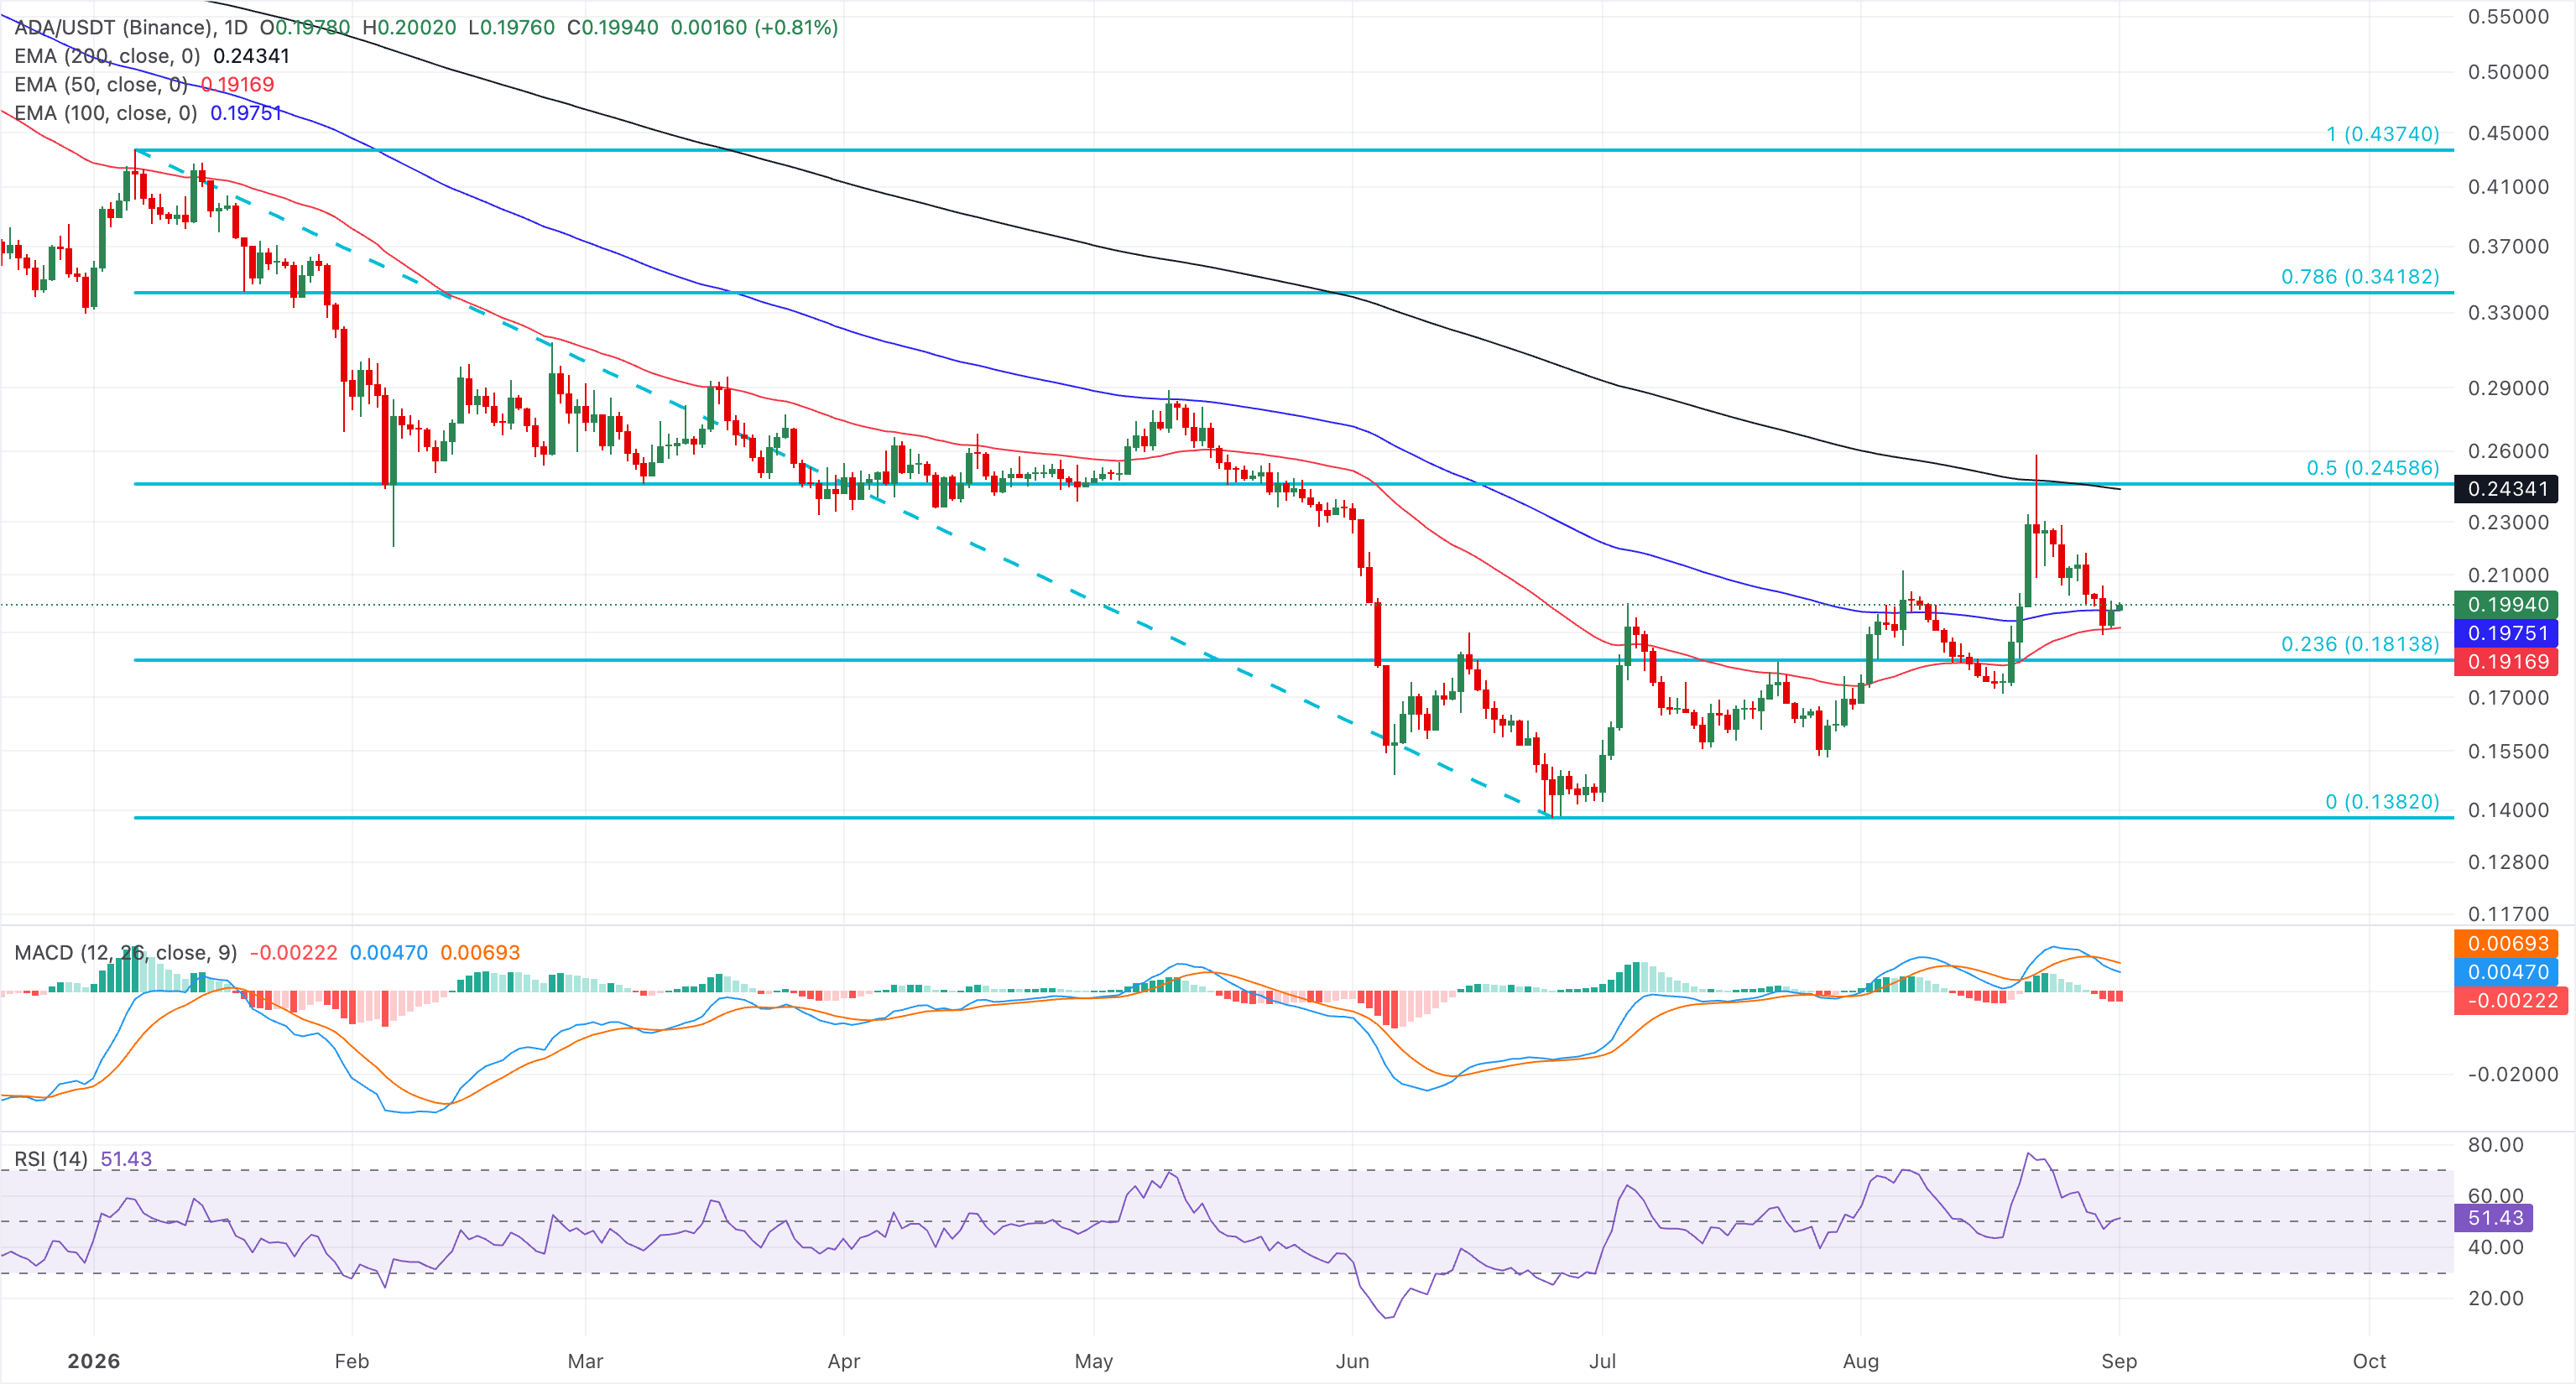
On the downside, initial support is provided by the 50-day EMA at $0.1916, serving as the next cushion; a deeper slide would expose the broader structural floor at the 23.6% Fibonacci retracement level of $0.1813, followed by the Fibonacci anchor around $0.1382.
Dogecoin risks further weakness below its 100-day EMA
Dogecoin trades around $0.0828, holding just above the 100-day EMA at $0.0816 while remaining capped well below the 200-day EMA at $0.0954. This configuration suggests a neutral near-term bias.
From a technical perspective, the 100-day EMA at $0.0816 provides support against further downside after last week's 12% pullback. A confirmed breakout below this moving average could target the support cluster around the $0.0800 round figure and the 50-day EMA at $0.0787. Further weakness in DOGE could target the annual swing low near $0.0676.
The RSI around 55, hovering above the midline after easing from overbought conditions, suggests balanced momentum, while the MACD has slipped marginally below its signal line, hinting that recent upside momentum is fading.
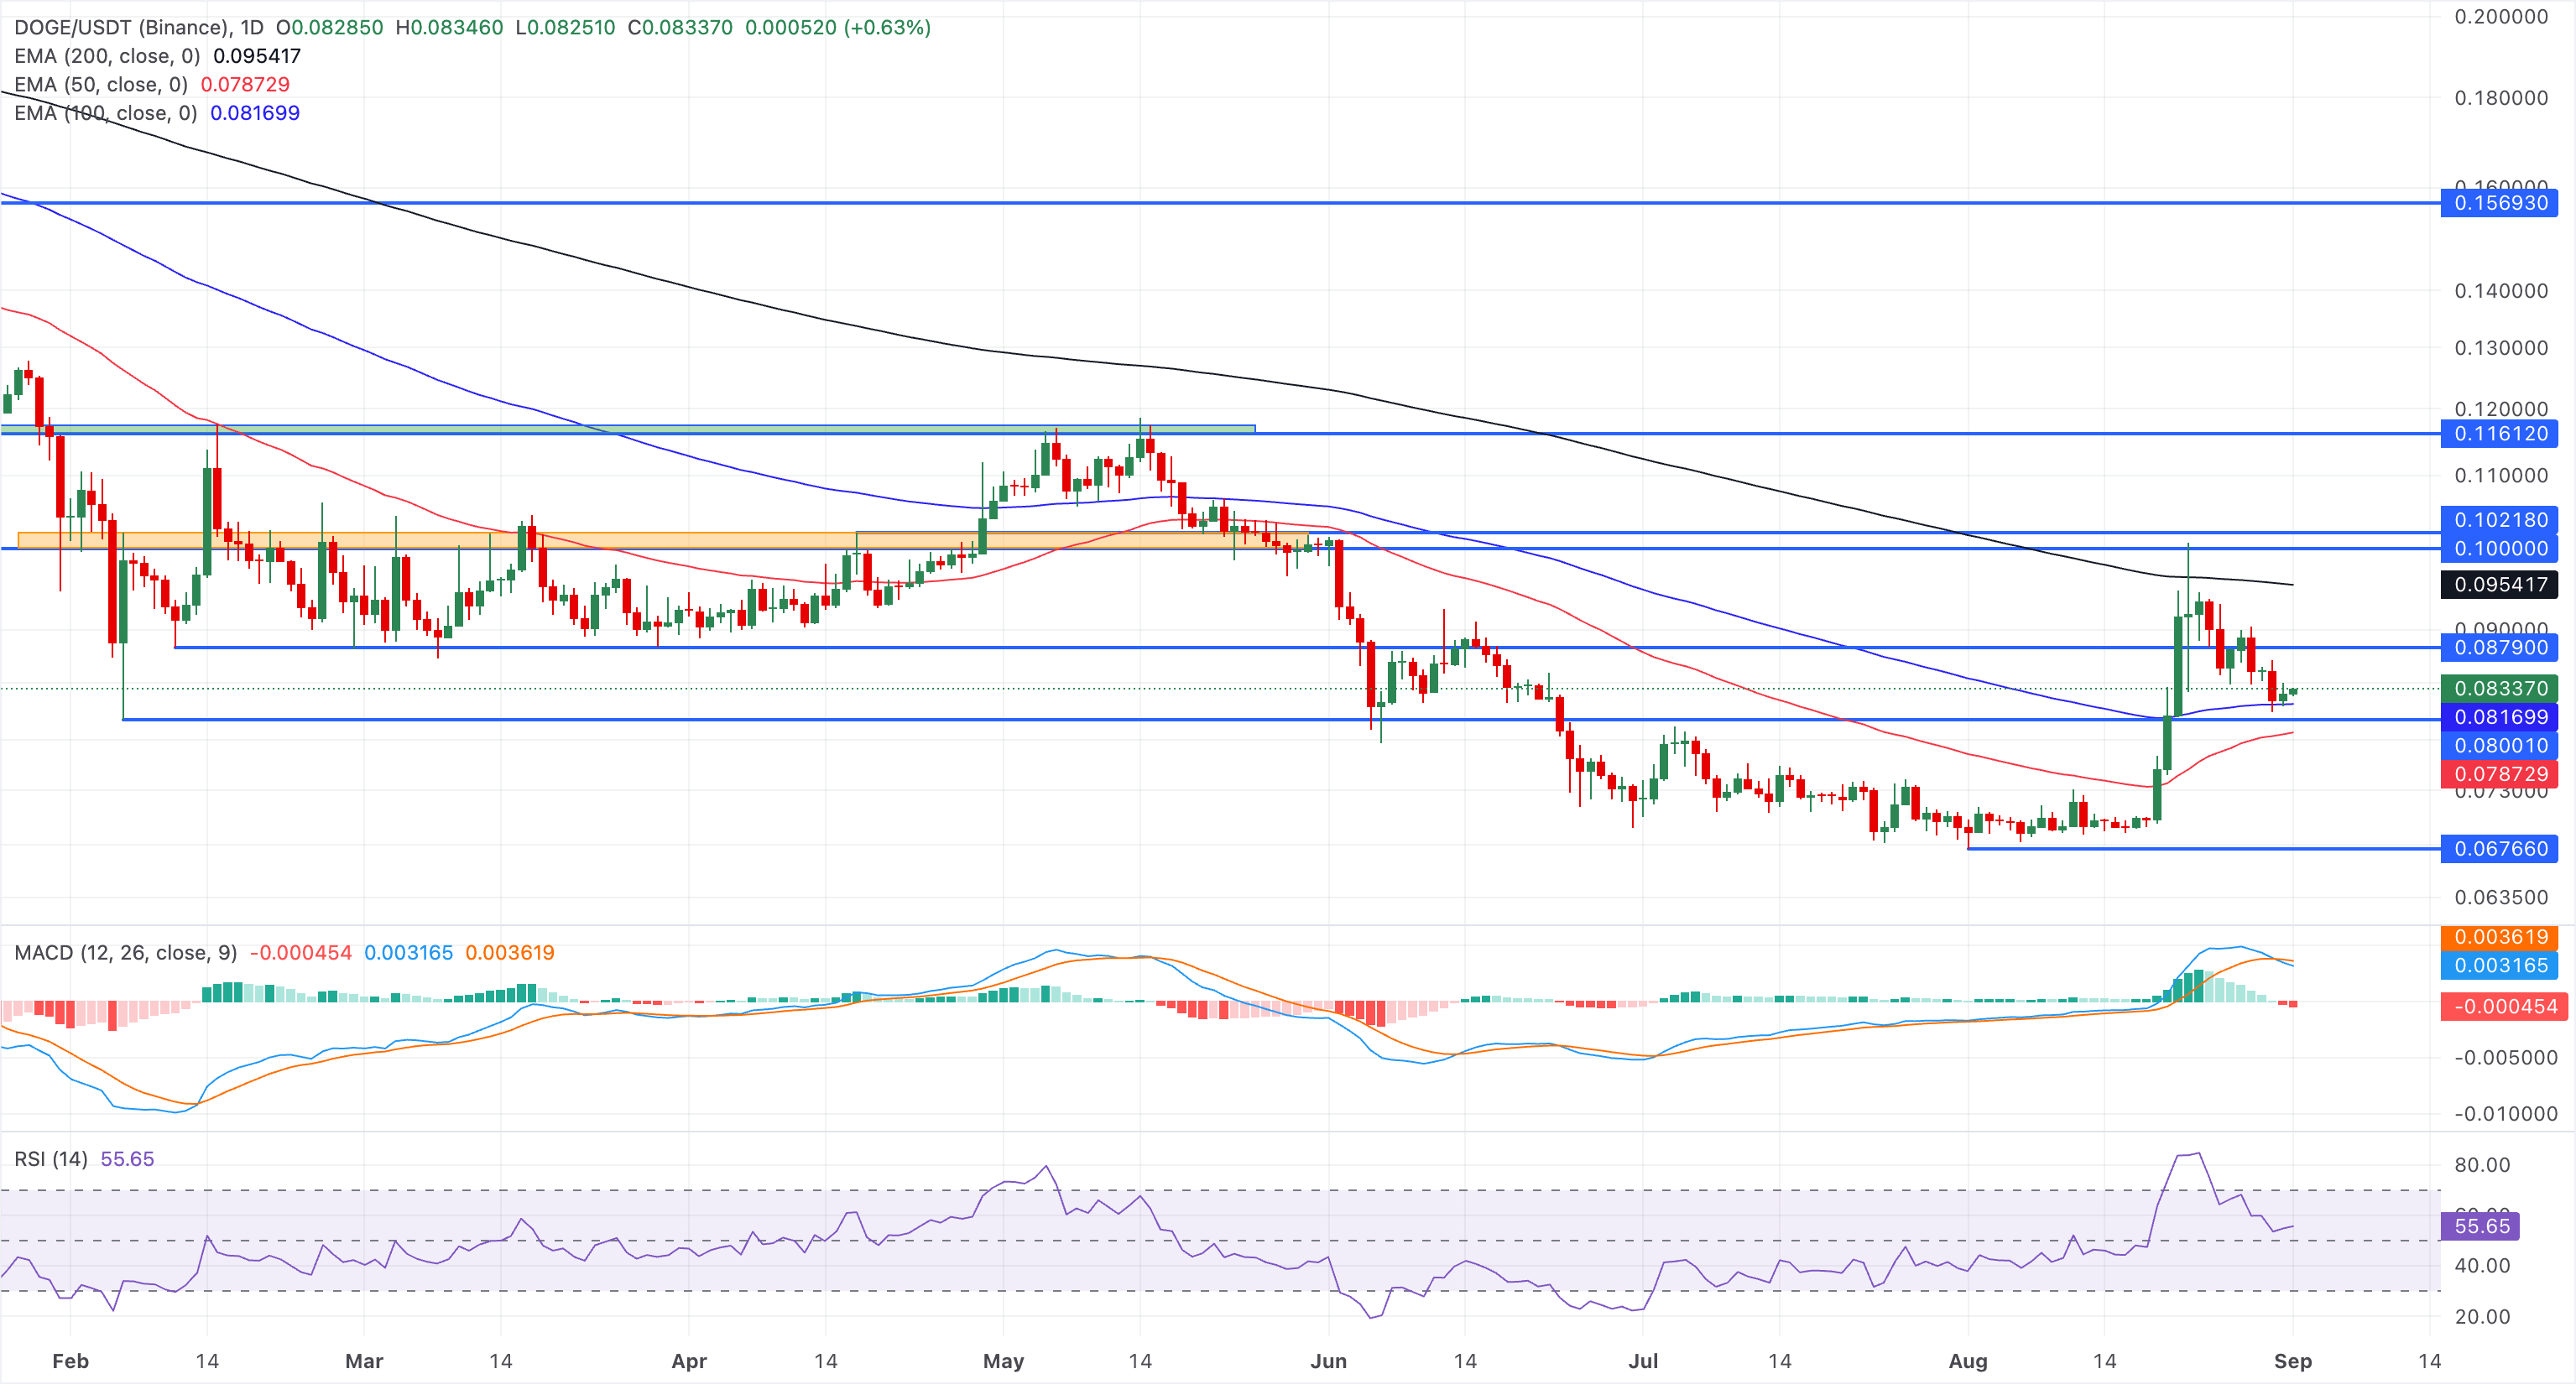
On the topside, initial resistance is located at the horizontal barrier near $0.0879, marked by the February 11 low, followed by the 200-day EMA near $0.0954. A more significant horizontal barrier lies at $0.1000, where prior supply is likely to re-emerge if bulls attempt another leg higher.
(The technical analysis of this story was written with the help of an AI tool. Know more.)
Recommended Articles


