


The Stock Market Is Flashing a Major Red Flag Seen Only Once Before. Here's What's Different This Time.
Key Points
The S&P 500 CAPE ratio topped a level seen just once before in history.
There are some key differences between the current market and the last time stocks were this expensive.
Investors should still consider their time horizon and risk tolerance for investing in today's market.
- 10 stocks we like better than S&P 500 Index ›
The S&P 500 (SNPINDEX: ^GSPC) has been on a phenomenal run. The popular index has doubled since the start of 2023, producing huge returns for investors. If you go back further, the S&P 500 is up more than 1,000% from its March 2009 low, producing a 15% annualized return.
That's a tremendous run for the index, and some investors may be wondering if we're approaching a new market peak. That 2009 low was the culmination of a near-decade-long stretch in which the index fell around 50% before recovering, only to fall 50% again. And now, the market is flashing the same major red flag it did just before the so-called "lost decade."
Missed Nvidia in 2009? This Rare Signal Is Flashing Again. In 2009, a "Double Down" signal flashed for a little-known chipmaker called Nvidia. For the first time in years, that same "Total Conviction" signal is flashing for a company 1/100th the size of Nvidia. Continue »
There are important differences between today's market and the stock market of the late '90s when we last saw this warning sign. But that doesn't mean investors can ignore it entirely.

Image source: Getty Images.
Will the market repeat the lost decade?
One factor that has created some concern among investors is the S&P 500's current valuation. Its price-to-earnings (P/E) ratio based on expected earnings for the next 12 months sits close to 20, well above the average of about 16 over the past 40 years.
Even more concerning is the cyclically adjusted price-to-earnings ratio (CAPE), which looks back at the last decade of earnings, adjusts them for inflation, and compares them to current market prices. The CAPE ratio currently exceeds 42, a level unseen since August 2000 and never before the 1999-2000 dot-com bubble.
The CAPE ratio is typically used to forecast long-term stock market returns. The higher the CAPE, the lower the expected long-term returns. If you go back to the first instance when the CAPE surpassed 42, in April 1999, the 10-year return for the S&P 500 was a dismal 48% decline. That doesn't bode well for the next decade.
But before investors panic and head for the exits, it's important to understand a fundamental difference between the current market and the market of 1999.
The big difference investors need to pay attention to
The biggest difference between today's high valuations and those of the dot-com bubble is the strength of corporate profits.
Back in the late '90s, many stocks were richly valued with no real profits. Today, corporate profits are booming. After-tax corporate profits reached 13.24% of gross domestic product (GDP) in the second quarter, the highest on record dating back to 1947. Meanwhile, corporate profits were historically low in the 1990s.
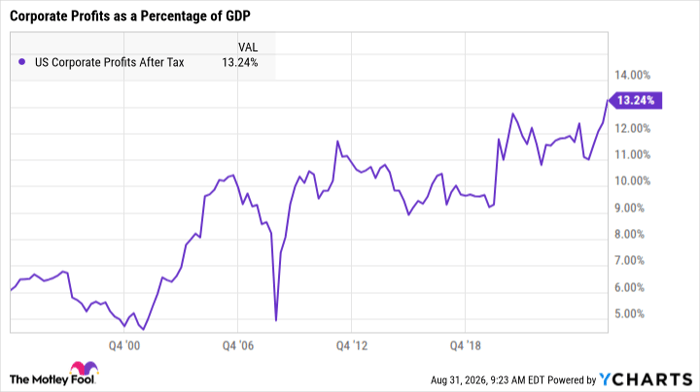
US Corporate Profits After Tax data by YCharts
And analysts expect very strong earnings growth for companies over the coming years, projecting 25% average earnings growth for the S&P 500 in aggregate over the next five years. Granted, sell-side analysts tend to be an optimistic group. It's worth pointing out that the long-term earnings growth forecast is the highest since 1995, including the dot-com bubble.
Therefore, the high valuation of today's S&P 500 is much more valid than the high valuation of the index 26 years ago. The fundamental earnings growth of the large-cap companies in the index is a good reason for the stocks to trade at a rich value.
At the same time, investors shouldn't ignore the riskiness inherent in buying stocks with high valuations and high expectations. As valuations climb, an investment becomes riskier. Any shortfall in expectations could cause a significant collapse in share price as analysts adjust their models and earnings multiples compress. And as mentioned, expectations are at an all-time high.
For long-term investors, buying at the current valuation isn't nearly as risky as it would be for someone who will need the money in the next few years. The market is sitting on a solid foundation of strong earnings. A shortfall in earnings results could cause a severe short-term downturn at the current prices, but it's unlikely to result in another lost decade.
Should you buy stock in S&P 500 Index right now?
Before you buy stock in S&P 500 Index, consider this:
The Motley Fool Stock Advisor analyst team just identified what they believe are the 10 best stocks for investors to buy now… and S&P 500 Index wasn’t one of them. The 10 stocks that made the cut could produce monster returns in the coming years.
Consider when Netflix made this list on December 17, 2004... if you invested $1,000 at the time of our recommendation, you’d have $440,710!* Or when Nvidia made this list on April 15, 2005... if you invested $1,000 at the time of our recommendation, you’d have $1,335,252!*
Now, it’s worth noting Stock Advisor’s total average return is 978% — a market-crushing outperformance compared to 213% for the S&P 500. Don't miss the latest top 10 list, available with Stock Advisor, and join an investing community built by individual investors for individual investors.
See the 10 stocks »
*Stock Advisor returns as of September 1, 2026.
Adam Levy has no position in any of the stocks mentioned. The Motley Fool has no position in any of the stocks mentioned. The Motley Fool has a disclosure policy.
Recommended Articles


