

Pi Network Price Forecast: PI holds steady as OpenPay brings back cash-in feature

Source Fxstreet
  • Pi Network hovers above $0.09100 on Tuesday, holding steady in a consolidation range.
  • OpenPay officially brings back the cash-in feature, enabling users to convert Pi token into OUSD stablecoin.
  • The technical outlook for PI remains mixed, with bulls struggling to reclaim the $0.1000 threshold.

Pi Network (PI) price is trading in the green above $0.0910 on Tuesday, sustaining its 10% monthly gains in August. OpenPay announced the reintroduction of the cash-in feature, allowing users to convert PI tokens and other altcoins into the OUSD stablecoin, on Monday. Pi Network must reclaim the $0.1000 psychological threshold with a confirmed breakout to sustain an upward trend.

OpenPay’s cash-in feature for PI token

OpenPay, a Web3 decentralized wallet linked to Pi Network, announced the return of the cash-in feature, in response to public demand, in an X post on Monday. It supports 96 partners, including Pi Network, local Philippine banks, and global payment services like Apple Pay and PayPal. 

Users opting for Pi token payment must convert their holdings to OUSD stablecoin, which can then be used for sends, QR payments, or transfers back toward a Pi Wallet. The cash-in feature could help increase the PI token’s utility and adoption in the community, while additional Know Your Customer (KYC) steps on OpenPay could raise concerns.

https://x.com/OpenPayTeam/status/2094416013437878566

Technical outlook: Will PI token regain bullish strength?

Pi Networ trades around $0.0915 on Tuesday, capped below the $0.1000 psychological threshold, suggesting clear overhead supply pressure. From a technical perspective, the PI token prolongs a sideways movement above the 23.6% Fibonacci retracement level of $0.1341 to $0.0703 downswing at $0.0836.

Looking up, the PI token must clear the $0.1000 resistance, reinforced by the 50% retracement level at $0.1022, to sustain a bullish trend. The potential upside could target the 78.6% Fibonacci retracement level at $0.1204.

The Moving Average Convergence Divergence (MACD) and signal line are moving sideways on the daily chart, just above the zero line, suggesting reduced momentum. At the same time, the Relative Strength Index (RSI) at about 52 is mildly constructive, yet both only hint at limited upside given the dense overhead supply structure.
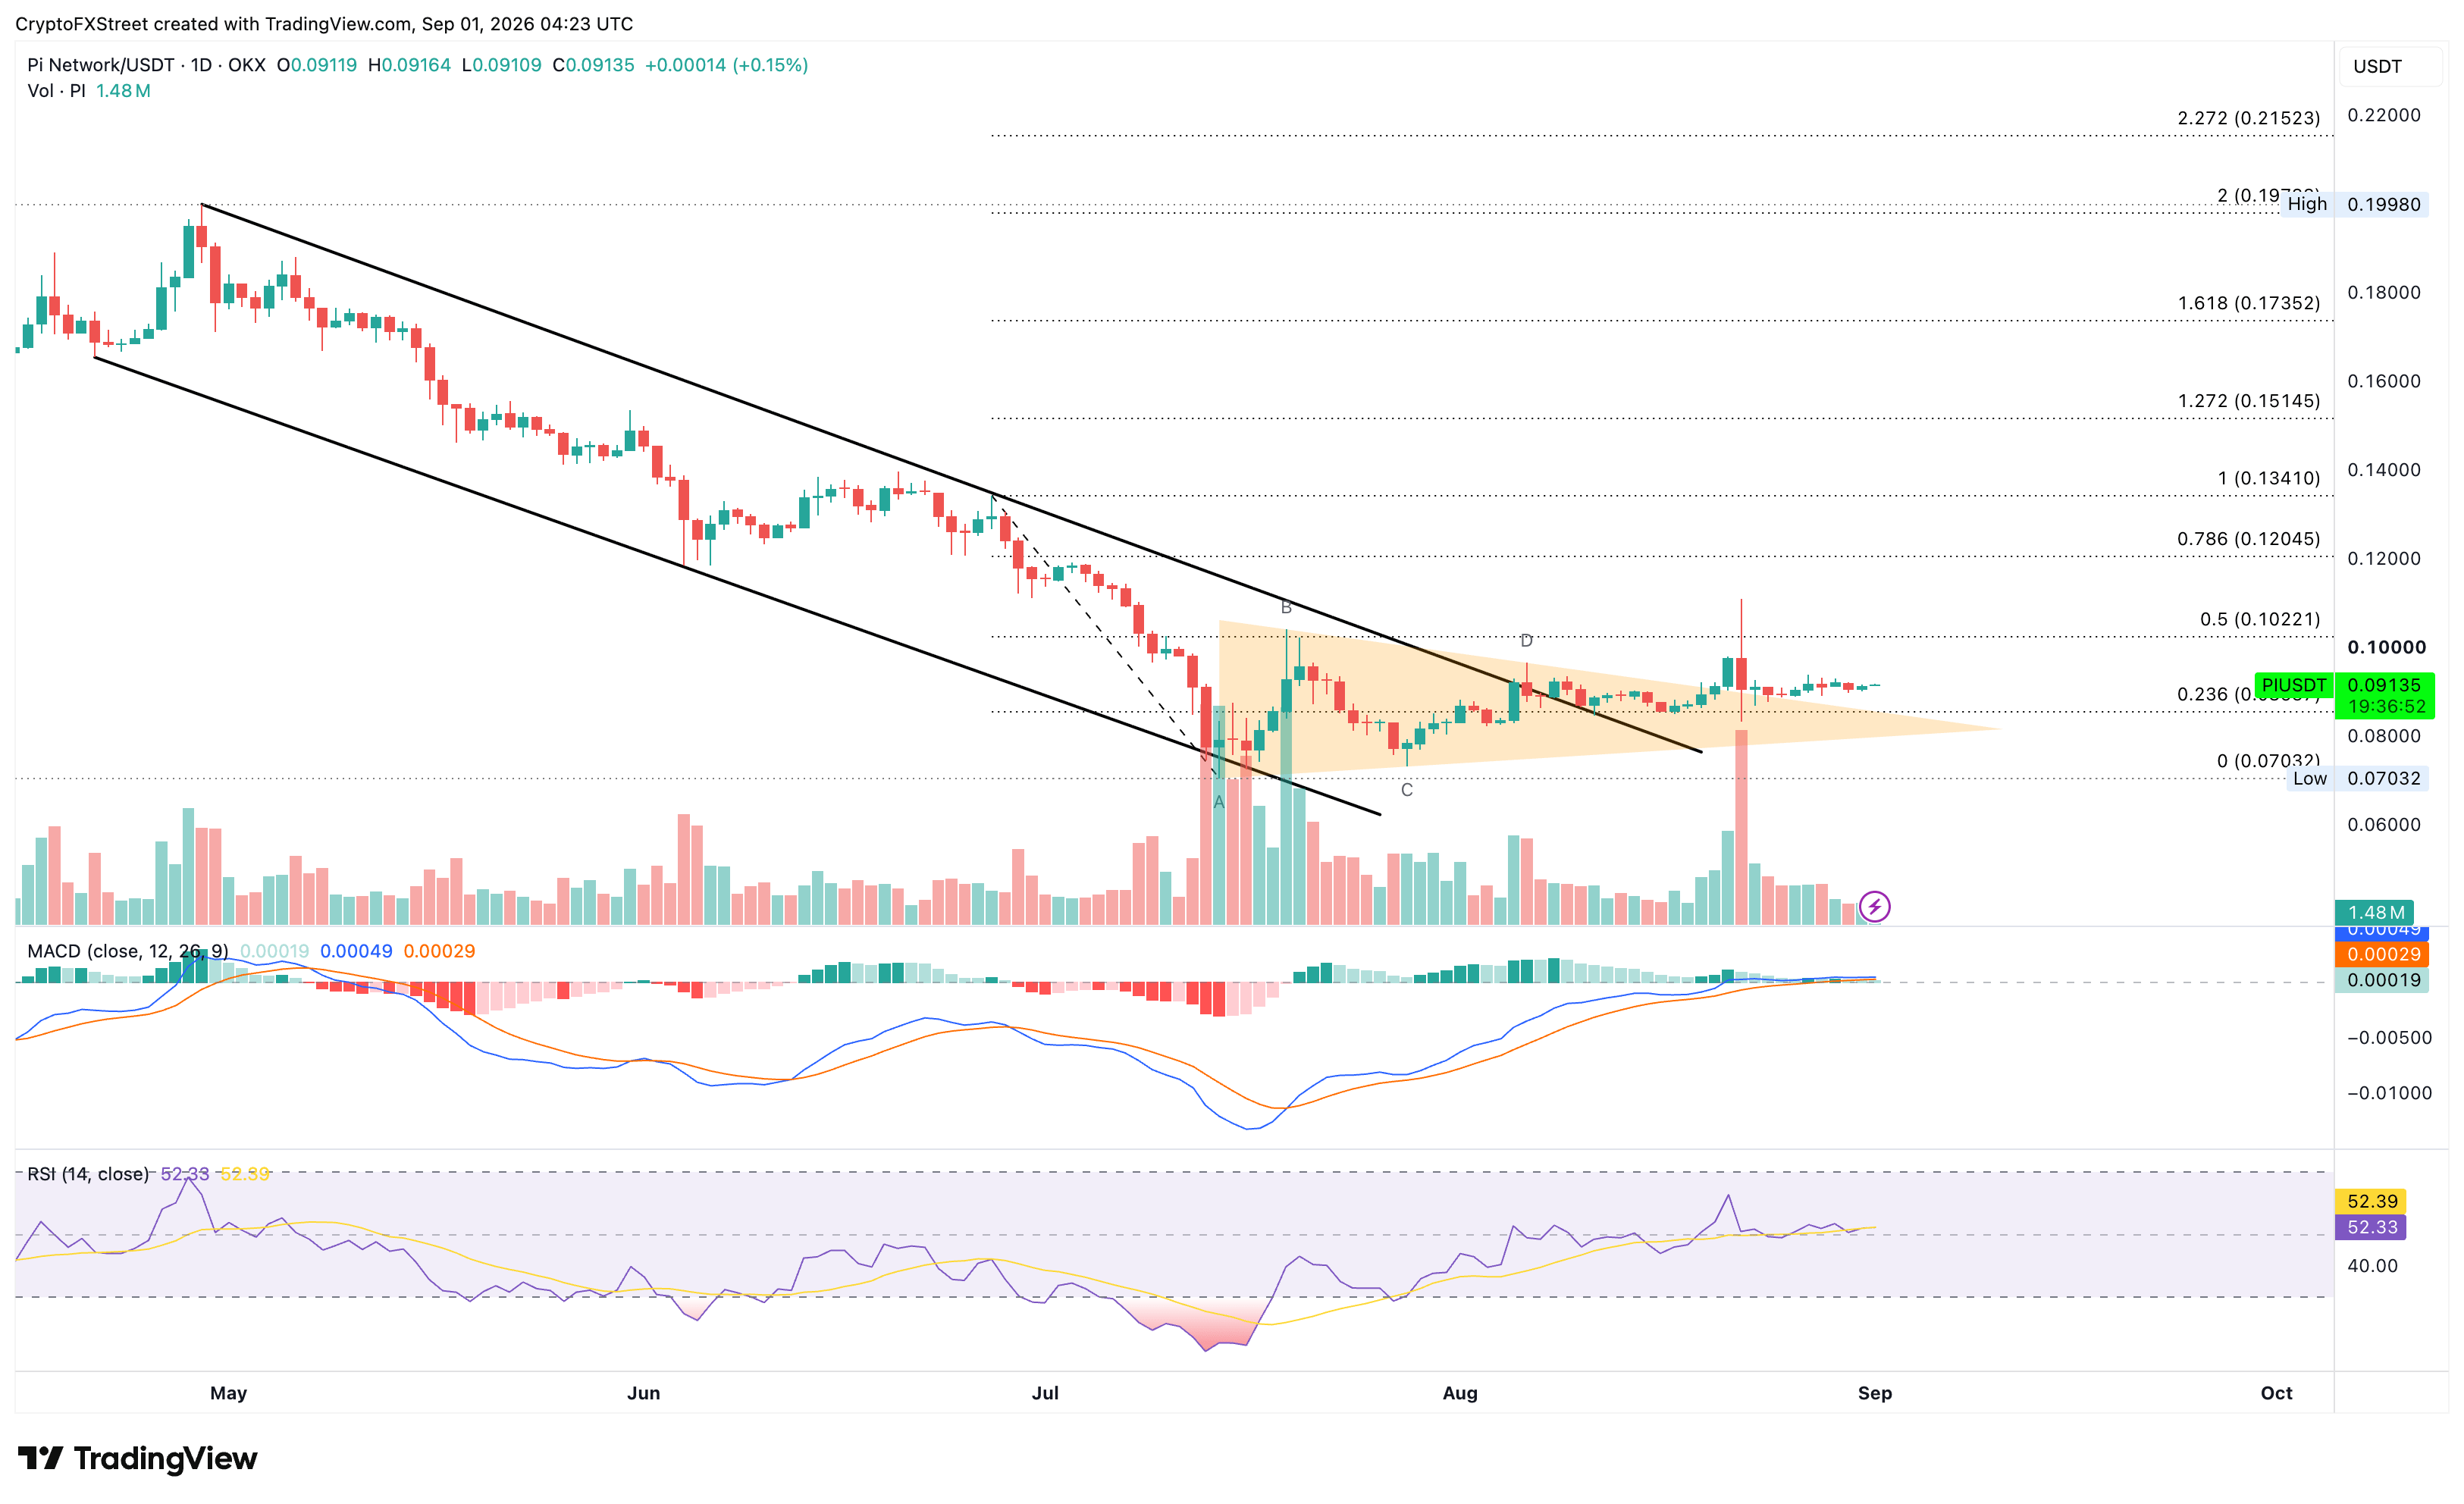
PI/USDT daily price chart.

On the downside, a confirmed breakout below $0.0836 could target the $0.0703 swing low. A deeper correction could extend the bearish trend into a price-discovery phase.

(The technical analysis of this story was written with the help of an AI tool. Know more.)

Disclaimer: For information purposes only. Past performance is not indicative of future results.
placeholder
XRP Price Prediction for July 2026: Can Buyers Finally Break the Downtrend?XRP (XRP) price trades near $1.05, caught between a year-long downtrend and a sudden burst of buying.July has historically rewarded XRP holders. This year the month arrives with on-chain accumulation
Author  Beincrypto
Jun 30, Tue
XRP (XRP) price trades near $1.05, caught between a year-long downtrend and a sudden burst of buying.July has historically rewarded XRP holders. This year the month arrives with on-chain accumulation
placeholder
NVIDIA Price Forecast: Michael Burry Shorts NVDA, but Analysts See $299On July 1, NVIDIA (NASDAQ: NVDA) sits at $198.34, failing to break above the former support level that is now serving as resistance between $198 and $205 on the 2H chart's downward blue c
Author  TradingKey
Jul 02, Thu
On July 1, NVIDIA (NASDAQ: NVDA) sits at $198.34, failing to break above the former support level that is now serving as resistance between $198 and $205 on the 2H chart's downward blue c
placeholder
XAUUSD Gold Analysis: Gold Holds Above $4,350 Ahead of US Inflation Data Is $4,500 Next? Gold holds above $4,350 following weak US jobs data. As inflation reports approach and UBS eyes $5,000, can XAUUSD break resistance at $4,435 to rally toward $4,500?
Author  Naoufal Seddik
Aug 12, Wed
Gold holds above $4,350 following weak US jobs data. As inflation reports approach and UBS eyes $5,000, can XAUUSD break resistance at $4,435 to rally toward $4,500?
placeholder
Gold Price Analysis Today: Gold Gains 0.94% as Markets Expect Fed to Hold Rates, Can $4,449 Resistance Break? Gold gained 0.94% on August 17, closing near $4,417.30 as softer US data strengthened expectations for unchanged Fed rates in September. Gold remains bullish, with $4,449.730 resistance and $4,310.650 support in focus.
Author  Naoufal Seddik
Aug 18, Tue
Gold gained 0.94% on August 17, closing near $4,417.30 as softer US data strengthened expectations for unchanged Fed rates in September. Gold remains bullish, with $4,449.730 resistance and $4,310.650 support in focus.
placeholder
Gold Price Analysis Today: Gold Rebounds After 1.91% Drop as Yields Ease. Is $4,449 Next? Gold fell about 1.91% on August 18 before producing a strong bullish reaction from the 1-hour demand zone in early August 19 trading. RSI is recovering from oversold conditions, but Supertrend remains bearish as traders await the Fed minutes.
Author  Naoufal Seddik
Aug 19, Wed
Gold fell about 1.91% on August 18 before producing a strong bullish reaction from the 1-hour demand zone in early August 19 trading. RSI is recovering from oversold conditions, but Supertrend remains bearish as traders await the Fed minutes.
goTop
quote