


Silver Price Forecast: XAG/USD trades flat around $66.60 ahead of US data
- Silver price flattens around $66.67 in the countdown to US Manufacturing PMI and Job Openings data.
- Fed Chair Warsh signaled at the Jackson Hole Symposium that the central bank needs to act if inflation remains higher.
- Renewed Middle East tensions lift energy prices.
Silver price (XAG/USD) trades in a tight range at around $66.67 during the Asian trading session on Tuesday. The white metal consolidates as investors await the United States (US) ISM Manufacturing PMI data for August and the JOLTS Job Openings data for July, which will be published at 14:00 GMT.
The Manufacturing PMI is expected to arrive at 55.2, lower than 55.6 in July. Meanwhile, fresh jobs posted by US employers are seen marginally lower at 7.3 million from 7.359 million in June. The Job Openings data is expected to have a meaningful influence on Federal Reserve (Fed) interest rate expectations.
Financial market experts see the August batch of Nonfarm Payrolls (NFP) and the Consumer Price Index (CPI) to drive Fed’s interest rate prospects significantly.
Fed hawkish tilt at Jackson Hole sets up data-driven September debate
Rabobank’s Elwin de Groot argues that Fed Chair Kevin Warsh’s Jackson Hole appearance was calibrated to shift expectations ahead of the September meeting. In his view, “Warsh’s prepared remarks seemed designed to lift rate-hike expectations, rebalance the September debate towards the hawks and rebuild his inflation-fighting credibility after July’s ‘all talk, no action’ criticism.” However, Rabobank cautions that this strategy “creates a difficult balancing act, as the White House may oppose a hike so close to November’s midterms.”
Even so, de Groot highlights that “Warsh delivered an important signal: the Fed is not relying on tighter financial conditions alone and remains willing to tighten further if underlying inflation stalls.” Against that backdrop, Rabobank judges that “the next round of data – especially the 4 September employment report and 11 September CPI – could therefore prove crucial for the Committee’s swing voters,” potentially determining whether the hawkish messaging translates into actual policy action.
On the geopolitical front, higher oil prices due to the restart of the Middle East war could act as a major headwind for the Silver price. The WTI Oil price jumped to near $85.85 in the Asian session on Tuesday, the highest level in over a week.
Higher energy prices prompt fears of accelerating global inflation expectations, a scenario that forces investors to ramp up hawkish central banks’ bets. This bodes poorly for non-yielding assets, such as Silver.
Silver Technical Analysis
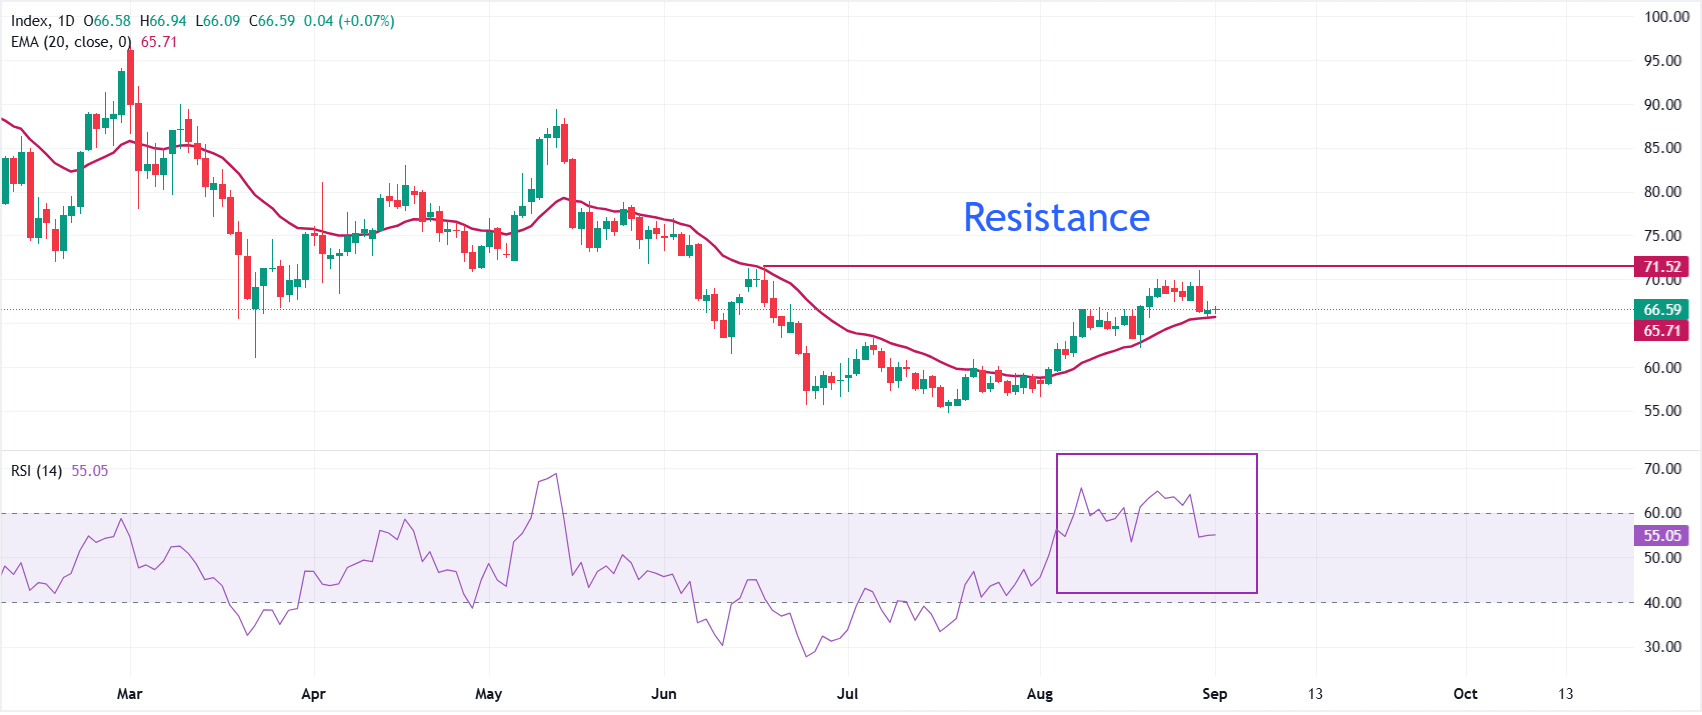
In the daily chart, XAG/USD trades at $66.59. The pair holds a bullish near-term bias as it advances above the 20-day exponential moving average (EMA), which comes in at $65.71 and now acts as underlying demand.
The Relative Strength Index (RSI) at 55.05 stays in neutral-to-positive territory, suggesting steady, rather than aggressive, buying pressure as price consolidates above its short-term trend marker.
On the downside, immediate support is located at the 20-day EMA at $65.71, with the August 9 low at $62.19 acting as the next major cushion. Looking up, the white metal needs a decisive breakout above the June 17 high at $71.56 to extend the advance.
(The technical analysis of this story was written with the help of an AI tool. Know more.)
Silver FAQs
Silver is a precious metal highly traded among investors. It has been historically used as a store of value and a medium of exchange. Although less popular than Gold, traders may turn to Silver to diversify their investment portfolio, for its intrinsic value or as a potential hedge during high-inflation periods. Investors can buy physical Silver, in coins or in bars, or trade it through vehicles such as Exchange Traded Funds, which track its price on international markets.
Silver prices can move due to a wide range of factors. Geopolitical instability or fears of a deep recession can make Silver price escalate due to its safe-haven status, although to a lesser extent than Gold's. As a yieldless asset, Silver tends to rise with lower interest rates. Its moves also depend on how the US Dollar (USD) behaves as the asset is priced in dollars (XAG/USD). A strong Dollar tends to keep the price of Silver at bay, whereas a weaker Dollar is likely to propel prices up. Other factors such as investment demand, mining supply – Silver is much more abundant than Gold – and recycling rates can also affect prices.
Silver is widely used in industry, particularly in sectors such as electronics or solar energy, as it has one of the highest electric conductivity of all metals – more than Copper and Gold. A surge in demand can increase prices, while a decline tends to lower them. Dynamics in the US, Chinese and Indian economies can also contribute to price swings: for the US and particularly China, their big industrial sectors use Silver in various processes; in India, consumers’ demand for the precious metal for jewellery also plays a key role in setting prices.
Silver prices tend to follow Gold's moves. When Gold prices rise, Silver typically follows suit, as their status as safe-haven assets is similar. The Gold/Silver ratio, which shows the number of ounces of Silver needed to equal the value of one ounce of Gold, may help to determine the relative valuation between both metals. Some investors may consider a high ratio as an indicator that Silver is undervalued, or Gold is overvalued. On the contrary, a low ratio might suggest that Gold is undervalued relative to Silver.
Recommended Articles


