

Micron Stock Price Forecast: Can Shares Rebound to $1,000 After Four-Week Drop? Watch Key $800 Support

Source Tradingkey

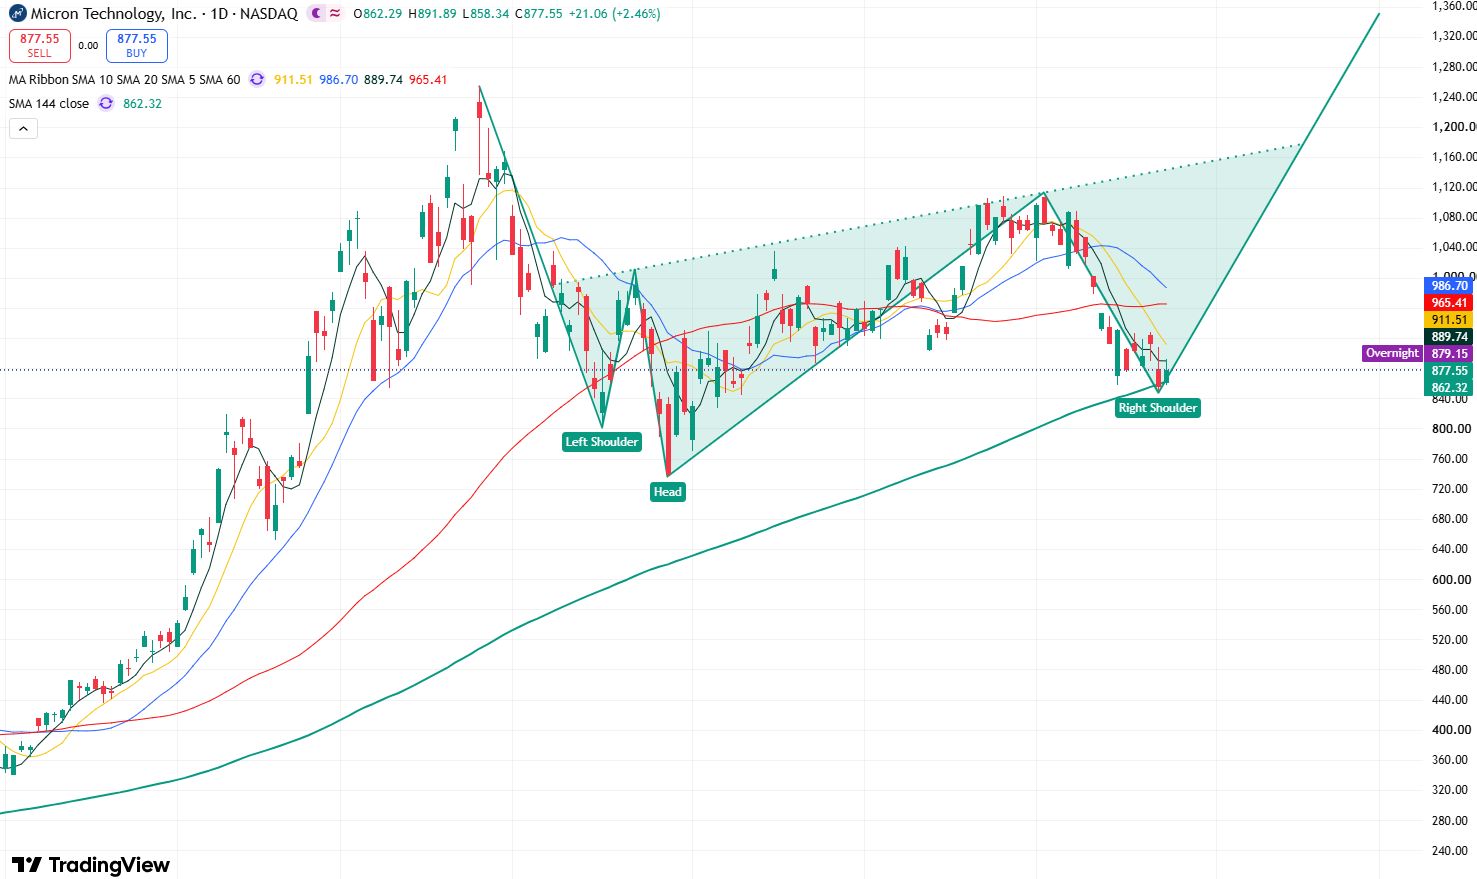
TradingKey - Micron (MU) shares rebounded last Friday (October 23) after recent continuous adjustments. As of the close that day, Micron's stock price closed at $877.55, up 2.46%, reaching an intraday high of $891.89, with trading volume reaching approximately 21.25 million shares, and rising further to around $880 in after-hours trading. Previously on October 22, the stock fell 6.26% in a single day, touching a low of $849.25; thus, the latest rebound has temporarily formed short-term support around $850.
mu-81aacb8f57374dbeb549cc1358e3a90a

Micron stock price daily chart, Source: TradingView

Looking at the daily chart of Micron's stock price, the stock has undergone a continuous pullback recently, at one point retesting above the 144-day moving average and forming a bullish candlestick above it last Friday. This indicates a higher likelihood that the stock has stopped falling, and a rebound trend may emerge in the short term. Notably, the overall stock trend continues to form a head-and-shoulders bottom technical pattern, which means the medium-to-long-term trend remains bullish.

In terms of technical indicators, the Relative Strength Index (RSI) is around 38.2, which is below the 50 midline but has not yet entered the traditional oversold territory below 30. Meanwhile, the MACD is in negative territory, showing that the technical weakness from the previous decline has not been fully repaired. However, the stochastic oscillator and StochRSI have turned up, reflecting an improvement in short-cycle momentum following the rebound near $850.

Currently, the stock has found support near the 144-day moving average ($850). If it confirms a bottom and stabilizes near this moving average in the short term, the stock will see a technical recovery rebound. The primary resistance level above is around $900. If it breaks through this level, the stock will further test resistance at the 60-day moving average ($960). Only when the stock firmly re-establishes itself above the 60-day moving average will upside room toward $1,000 be unlocked.

Conversely, if the stock breaks below the 144-day moving average, it will further probe downward toward $800, the left shoulder of the head-and-shoulders bottom pattern formed by the overall candlestick structure. If this level fails to hold, the stock will further test down to the low of $737.88. If it stays firmly above $800, the head-and-shoulders bottom pattern will remain intact, and the medium-to-long-term trend for the stock will stay bullish.

Disclaimer: For information purposes only. Past performance is not indicative of future results.
placeholder
The Fed will sit still on October 28 — but 100 of 100 economists now expect a December hikeA Reuters poll run October 16-20 found 94 of 100 economists expecting the Fed to hold at 3.75-4.00% on October 28 — and all 100 expecting a hike in December, against less than half a month earlier. The market is close to the same price, with CME FedWatch at roughly 17% for October and 82.8% for December. With the Fed in blackout since October 17, here are the five dates that decide the rest of the year, what each one is priced for, and the two directions each can take.
Author  Irene Q.
Oct 22, Thu
A Reuters poll run October 16-20 found 94 of 100 economists expecting the Fed to hold at 3.75-4.00% on October 28 — and all 100 expecting a hike in December, against less than half a month earlier. The market is close to the same price, with CME FedWatch at roughly 17% for October and 82.8% for December. With the Fed in blackout since October 17, here are the five dates that decide the rest of the year, what each one is priced for, and the two directions each can take.
placeholder
Gold Price Analysis Today | Forex Gold Analysis | XAU/USD Analysis - October 23, 2026Get the latest gold price analysis, forex gold insights, and XAU/USD analysis for October 23, 2026. Read on for the details.
Author  Mitrade
Oct 23, Fri
Get the latest gold price analysis, forex gold insights, and XAU/USD analysis for October 23, 2026. Read on for the details.
placeholder
Nasdaq closes at 26,008.86 — 8.9 points above 26,000, and the credit market never blinkedThe Nasdaq Composite fell 2.60% to 26,008.86 on October 22, its worst session since June, as Meta sank 6.98% on 2026 capex guidance of $135–145 billion. But the equal-weight S&P 500 rose 0.73%, high-yield credit was flat and 10-year yields fell 20 basis points. This was an AI de-rating, not a risk-off event — here is the transmission chain, the 29,000 / 28,200 levels and what would prove it wrong.
Author  Irene Q.
Oct 23, Fri
The Nasdaq Composite fell 2.60% to 26,008.86 on October 22, its worst session since June, as Meta sank 6.98% on 2026 capex guidance of $135–145 billion. But the equal-weight S&P 500 rose 0.73%, high-yield credit was flat and 10-year yields fell 20 basis points. This was an AI de-rating, not a risk-off event — here is the transmission chain, the 29,000 / 28,200 levels and what would prove it wrong.
placeholder
Brent tops $113 on Saudi supply risk — but the diesel line in the EIA report is the tellBrent's December contract settled at $113.17 on October 22, up 4.00% and the highest close since May 4, after Saudi Arabia restricted refined-product shipments. The same session's EIA report showed crude stocks down 3.06 million barrels and gasoline down 2.95 million — but distillates built 1.68 million. That single line decides whether $113 holds: here are the data, the 108.8 / 114.0 / 119.3 levels and the two scenarios.
Author  Irene Q.
Oct 23, Fri
Brent's December contract settled at $113.17 on October 22, up 4.00% and the highest close since May 4, after Saudi Arabia restricted refined-product shipments. The same session's EIA report showed crude stocks down 3.06 million barrels and gasoline down 2.95 million — but distillates built 1.68 million. That single line decides whether $113 holds: here are the data, the 108.8 / 114.0 / 119.3 levels and the two scenarios.
placeholder
Gold Price Analysis Today | Forex Gold Analysis | XAU/USD Analysis - October 26, 2026Get the latest gold price analysis, forex gold insights, and XAU/USD analysis for October 26, 2026. Read on for the details.
Author  Mitrade
6 hours ago
Get the latest gold price analysis, forex gold insights, and XAU/USD analysis for October 26, 2026. Read on for the details.
goTop
quote