


Housing starts fell to the second-lowest since the pandemic shutdown — with the 10-year at 5.12%, who is left to buy?


Mitrade Insights — US housing starts fell 5.2% to 1.221 million units in September, the second-lowest pace since the 2020 pandemic shutdown, and single-family starts dropped 4.6% to 859,000. Building permits sank to 1.400 million, a three-and-a-half-year low. And this is the version of the data that already looks best: July and August were both revised upward, so the September fall is a fall from a higher base. With the 10-year Treasury at 5.117% — still only 19 basis points below its October 5 peak — the arithmetic of who can afford a home has not changed, only the sentiment around it.
1. The three numbers that matter
| Metric | September | Change | Context |
|---|---|---|---|
| Housing starts | 1.221m | -5.2% m/m | Second-lowest since the 2020 shutdown; July and August revised up |
| Single-family starts | 859,000 | -4.6% | August revised to 900,000 |
| Building permits | 1.400m | 3.5-year low | The forward-looking line, and the weakest in the series |
| Completions | 1.192m | — | Work already in the ground |
| NAHB builder confidence | 2012 levels | — | "Affordability challenges persist" |
| 10-year Treasury | 5.117% | -2bp | 5.311% on October 5, the highest since 2002 |
Three points deserve emphasis. First, the permits number is the one to watch: permits are filed before work starts, so a 3.5-year low in permits is the pipeline telling you that builders expect weak demand to persist. Second, the revisions: because July and August were marked up, the September drop of 5.2% is measured against a higher prior base than the market had been using. Third, the NAHB index has fallen back to where it sat in 2012 — not a recession reading, but not a healthy one either.
2. The chain from the 10-year to the permit
Here is the mechanism, and it is not complicated.
Rates set the payment. At a 5.117% 10-year, the 30-year mortgage rate sits well above 6%, and the monthly payment on a typical loan is materially larger than it was when housing was last affordable. Affordability, not desire, is the binding constraint.
Affordability sets the permit. If the payment is too large, the buyer waits; if the buyer waits, the builder does not file. So permits lead, starts follow, and both follow the long end.
The long end is where the disconnect sits. Crude settled 5.64% lower on Tuesday, which took a slice of inflation pressure out and let the 10-year give back 2 basis points to 5.117%. But the 10-year only peaked at 5.311% on October 5, and it has given back 19 basis points of that 31 — a fifth. The rate that sets mortgages is still near multi-decade highs. Goldman Sachs' read is that US housing conditions are unlikely to change much as the calendar turns into 2027, with 2027 existing-home sales estimated at around 3.9 million, 26% below 2019 levels.
And the cost of building is not the only pressure. Multifamily starts fell in September amid high construction costs, with elevated fuel prices and tariffs feeding into building costs. The same tariff and energy impulse that made crude cheap in one corner of the market made construction expensive in another.
3. What it does to the rest of the market
The housing data is the cleanest read on the rate path, and the rate path is what the equity market is arguing about. The Fed raised rates 25bp to 3.75%–4.00% on September 16, and while markets price only about a 17% chance of an October hike and treat December as the live debate, the mortgage market does not wait for December. A 5.12% 10-year is the price of a home today, and it is set by the long end rather than by the next FOMC.
That is also why the long-end bond ETF has not delivered the relief the index rally implies. TLT closed at $80.13 on Tuesday, up 0.84%, and trades in the overnight session around $79.85 — but it is still 8.4% below its June high of $87.79, and it made its 52-week low of $76.43 on October 7, when the 10-year was at 5.311%. The bond rally since then has recovered roughly a third of the move, and the 50-day average at $80.63 is still overhead resistance.
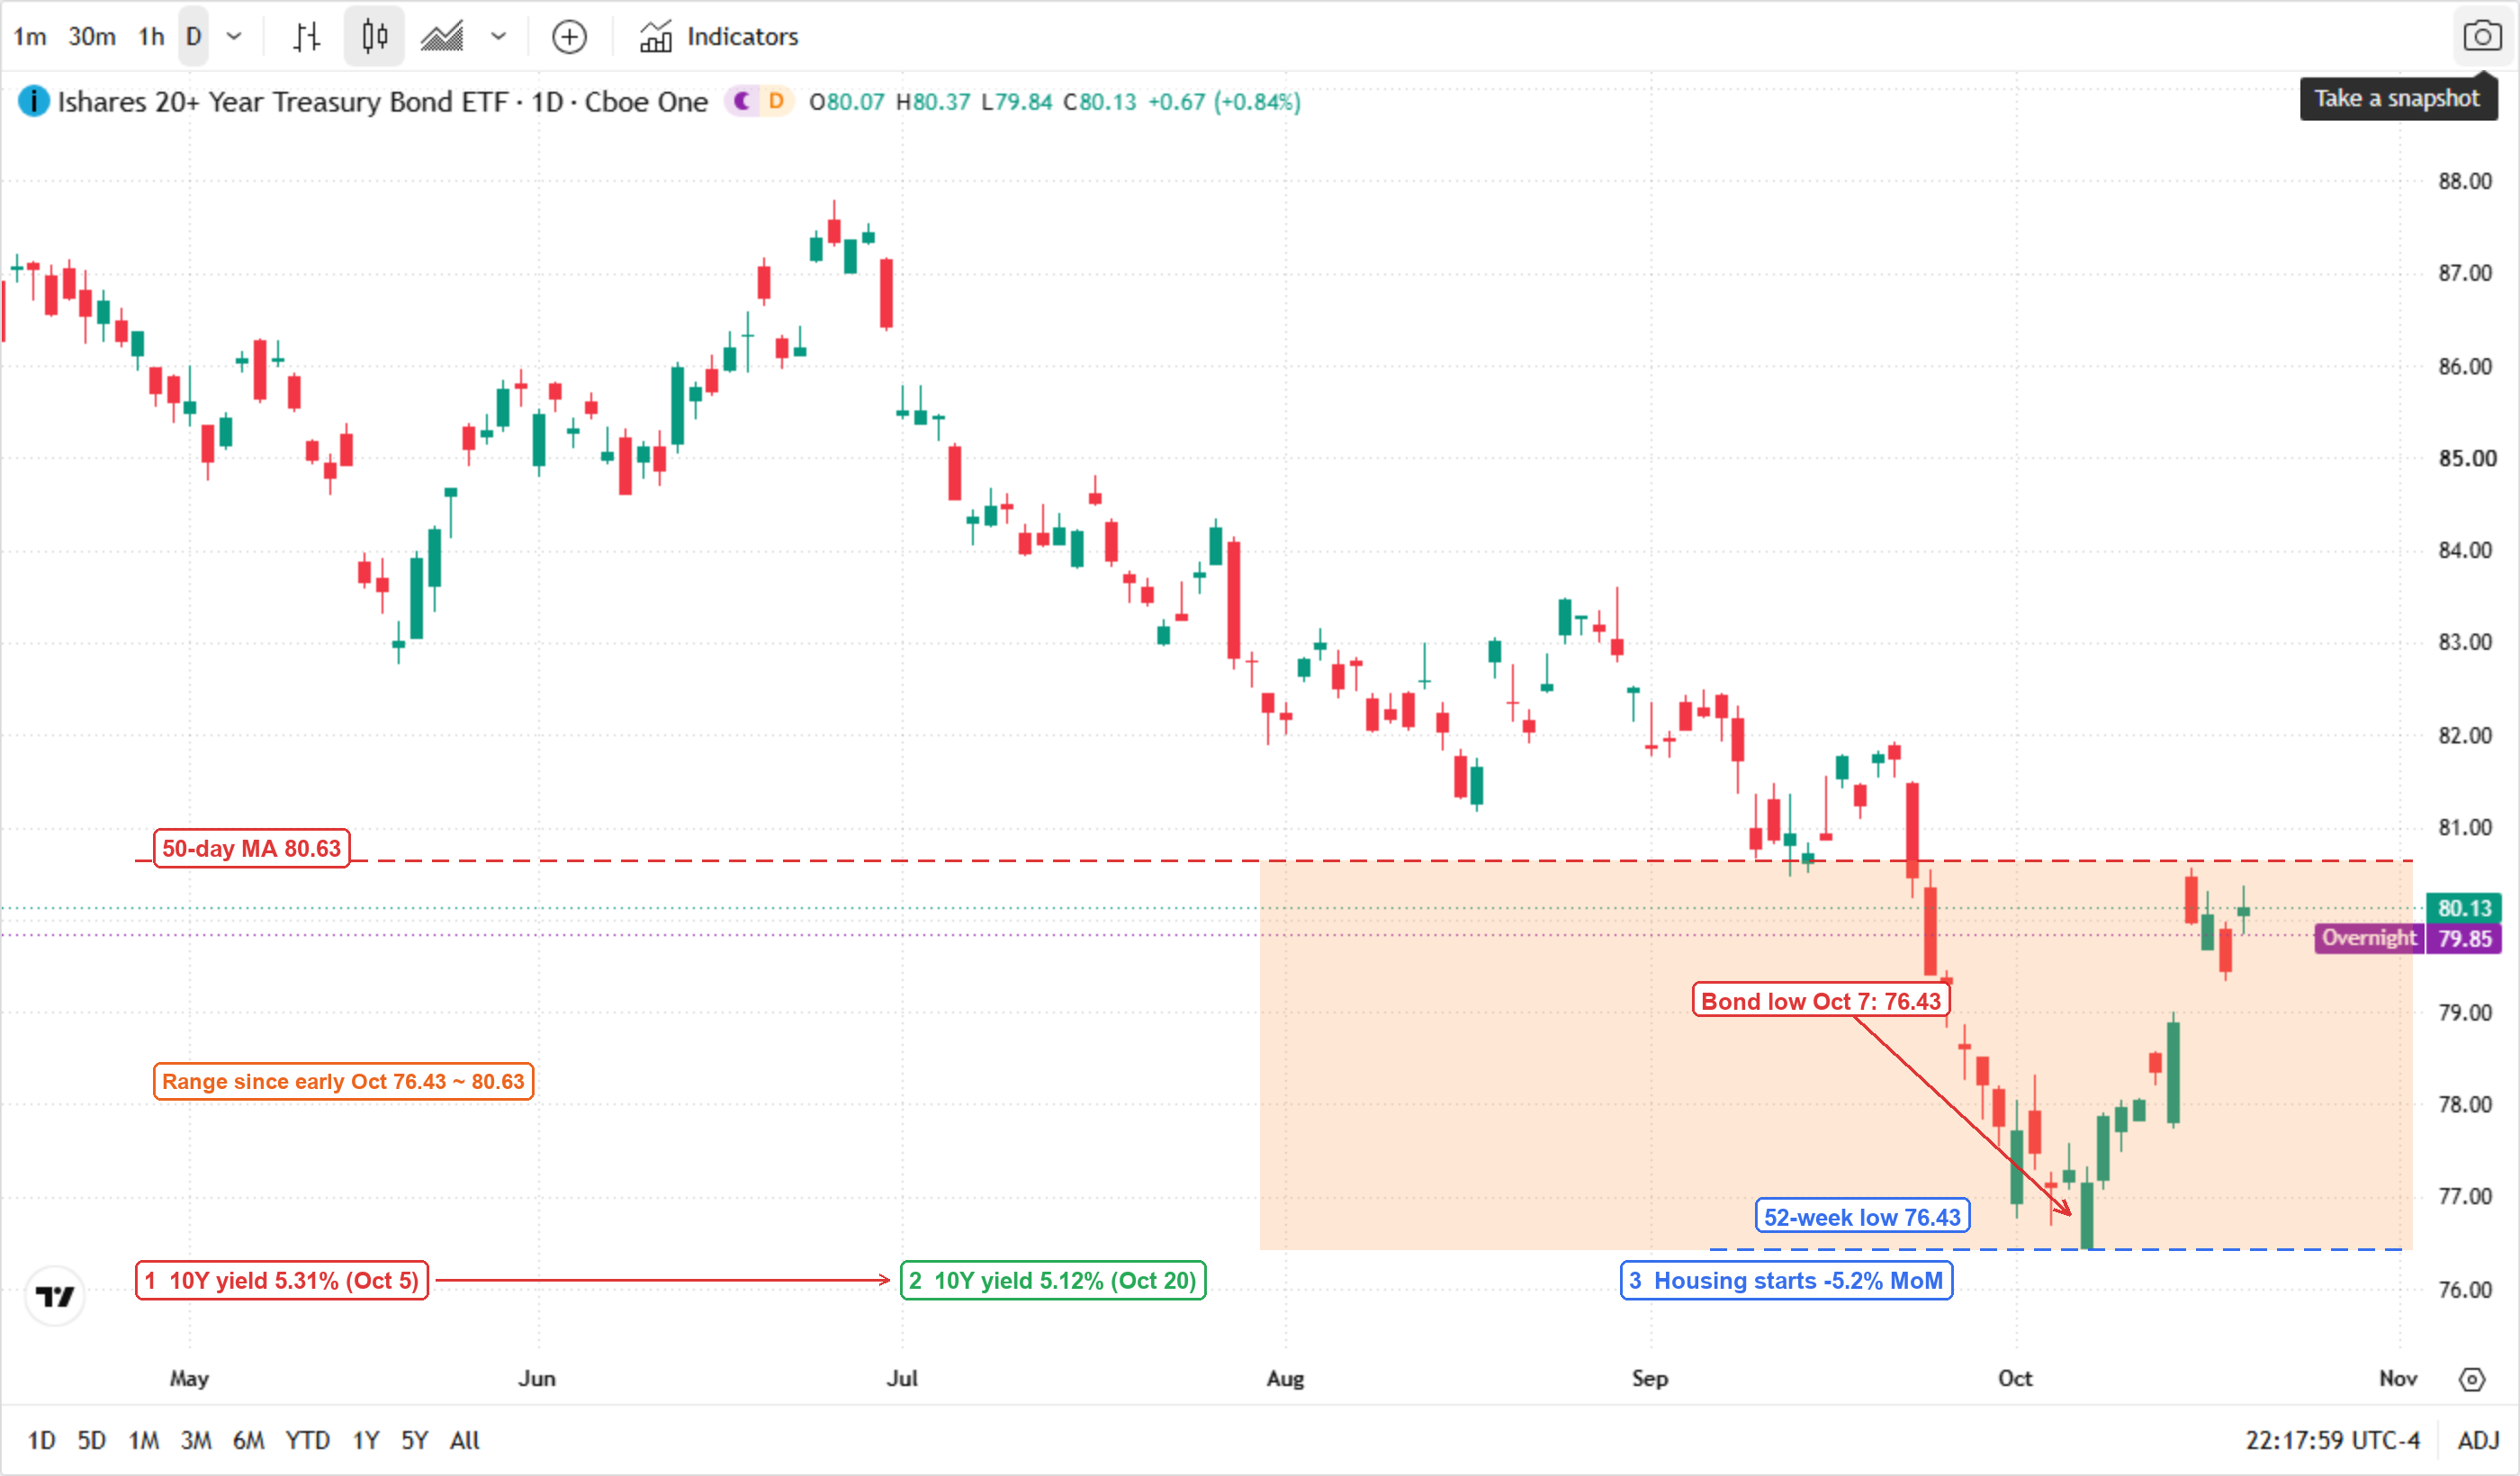
* Chart source: TradingView official chart screenshot, data source Cboe One (iShares 20+ Year Treasury Bond ETF).
4. The table, and the two scenarios
| Trigger | What it would mean | Where it points |
|---|---|---|
| 10-year holds below 5.10% | Mortgage rates ease, permits stabilise | Starts recover toward 1.3m; homebuilders re-rate |
| 10-year back above 5.20% | Affordability tightens again | New permits roll over; the 1.4m print becomes the ceiling, not the floor |
| October 28 FOMC signals a December pause | Front-end relief, but the long end sets mortgages | Limited help for housing; helps rate-sensitive equity multiples |
| Crude holds under $100 | Disinflation persists, breakevens ease | Slowly lowers the mortgage rate through the long end |
Scenario A: permits find a floor. If the 10-year grinds down through 5.10% and crude stays below $100, the disinflation impulse reaches the mortgage rate with a lag of one to two months. Permits, being the forward line, should stabilise before starts do, and the 1.400 million print becomes a low rather than a new normal. In equity terms this is the outcome that would let the rate-sensitive parts of the market participate in the Dow's move rather than just watch it.
Scenario B: the affordability wall holds. If the long end stays near 5.12% and the Fed's December hike odds keep rising, the payment on a home remains out of reach for the cohort that would have bought it at 4.5%. Permits break the 1.4 million line, builders cut prices and margins, and the NAHB confidence index has further to fall before it finds a bottom.
The bottom line: September's numbers are not a shock, they are a confirmation. The housing market is not repricing because of one weak month; it is repricing because a 5.12% 10-year has made the arithmetic impossible, and the 3.5-year low in permits says the pipeline has already adjusted. The next data point is the October 28 FOMC, but the number that decides housing is the long end, not the policy rate.
Read more
Before making any trading decisions, it is important to equip yourself with sufficient fundamental knowledge, have a comprehensive understanding of market trends, be aware of risks and hidden costs, carefully consider investment targets, level of experience, risk appetite, and seek professional advice if necessary.
Furthermore, the content of this article is solely the author's personal opinion and does not necessarily constitute investment advice. The content of this article is for reference purposes only, and readers should not use this article as a basis for any investment decisions.
Investors should not rely on this information as a substitute for independent judgment or make decisions solely based on this information. It does not constitute any trading activity and does not guarantee any profits in trading.
If you have any inquiries regarding the data, information, or content related to Mitrade in this article, please contact us via email: insights@mitrade.com. The Mitrade team will carefully review the content to continue improving the quality of the article.


