


Nasdaq closes at 26,008.86 — 8.9 points above 26,000, and the credit market never blinked

Mitrade Insights — The Nasdaq Composite closed at 26,008.86 on October 22, down 2.60% — its worst session since June and just 8.9 points above the 26,000 line. Meta fell 6.98% after guiding 2026 capital spending to $135 billion ~ $145 billion. What makes the session unusual is everything that did not happen: the equal-weight S&P 500 rose 0.73%, high-yield credit was flat, and 10-year Treasury yields fell 20 basis points. This was an AI de-rating, not a risk-off event.
Four divergences that do not fit a risk-off story
| Asset | 22 October close | Change |
|---|---|---|
| Nasdaq Composite | 26,008.86 | -2.60% |
| Nasdaq-100 | 28,958.69 | -2.90% |
| S&P 500 | 7,663.43 | -1.21% |
| S&P 500 equal weight (RSP) | 218.22 | +0.73% |
| VIX | 19.03 | +14.09% |
| US 10-year Treasury yield | 4.95% | -20 bp |
| High-yield credit (HYG) | 77.10 | +0.16% |
| Investment-grade credit (LQD) | 104.28 | +1.04% |
Read the table top to bottom and the contradiction is obvious. Money left the largest technology names and went somewhere — into the average stock, into Treasuries (TLT +1.87%), into investment-grade credit, and into defensives. The Dow finished up 0.02%. Only the VIX, up 14.09% to 19.03, looked like panic, and even that is a level that has been higher in calmer months this year. A genuine macro shock does not leave equal-weight equities up three-quarters of a percent.
Link one: Meta's capex line started the chain
Meta beat on revenue and still lost more than $100 billion of market value, because the market read the spending plan rather than the quarter. Full-year 2026 capex of $135 ~ 145 billion, with free cash flow turning negative, changes the question investors are asking. For two years the question was whether AI demand was real; on Thursday it became whether the cash to fund it is still cheap. Meta closed 6.98% lower.
Link two: capex needs capital, and capital is the constraint
The second link is financing. Nvidia's chief executive told CNBC that demand from neocloud providers was "off the charts" but that a lack of capital was limiting their growth — a remark traders read as confirmation that the bottleneck has moved from chips to balance sheets. The market repriced exactly that layer: CoreWeave fell 10.06%, AMD 8.10%, Micron 6.26%, Broadcom 4.31%, Nvidia 4.40%, and the semiconductor complex (SMH) 5.99%. Lam Research dropped 11.76% on supply-constrained guidance, and Tesla fell 3.08% after trimming its own capital-spending outlook. Oil above $110 a barrel added a cost line to the same spreadsheet.
Link three: the chain stopped at equities
Here is where the transmission chain broke, and why it matters. If AI capex were being funded by bank credit, a 6% semiconductor drawdown would show up in spreads. It did not. High-yield credit closed marginally higher, investment-grade credit gained 1.04%, and the 10-year yield fell 20 basis points to 4.95% — the bond market priced slower growth, not a funding accident. Much of the buildout is financed through equity, vendor financing and private credit, none of which marks to market intraday. That is precisely why the stress shows up first and hardest in the equity of the companies furthest from cash flow: CoreWeave at one end, Apple — up 1.23% — at the other.
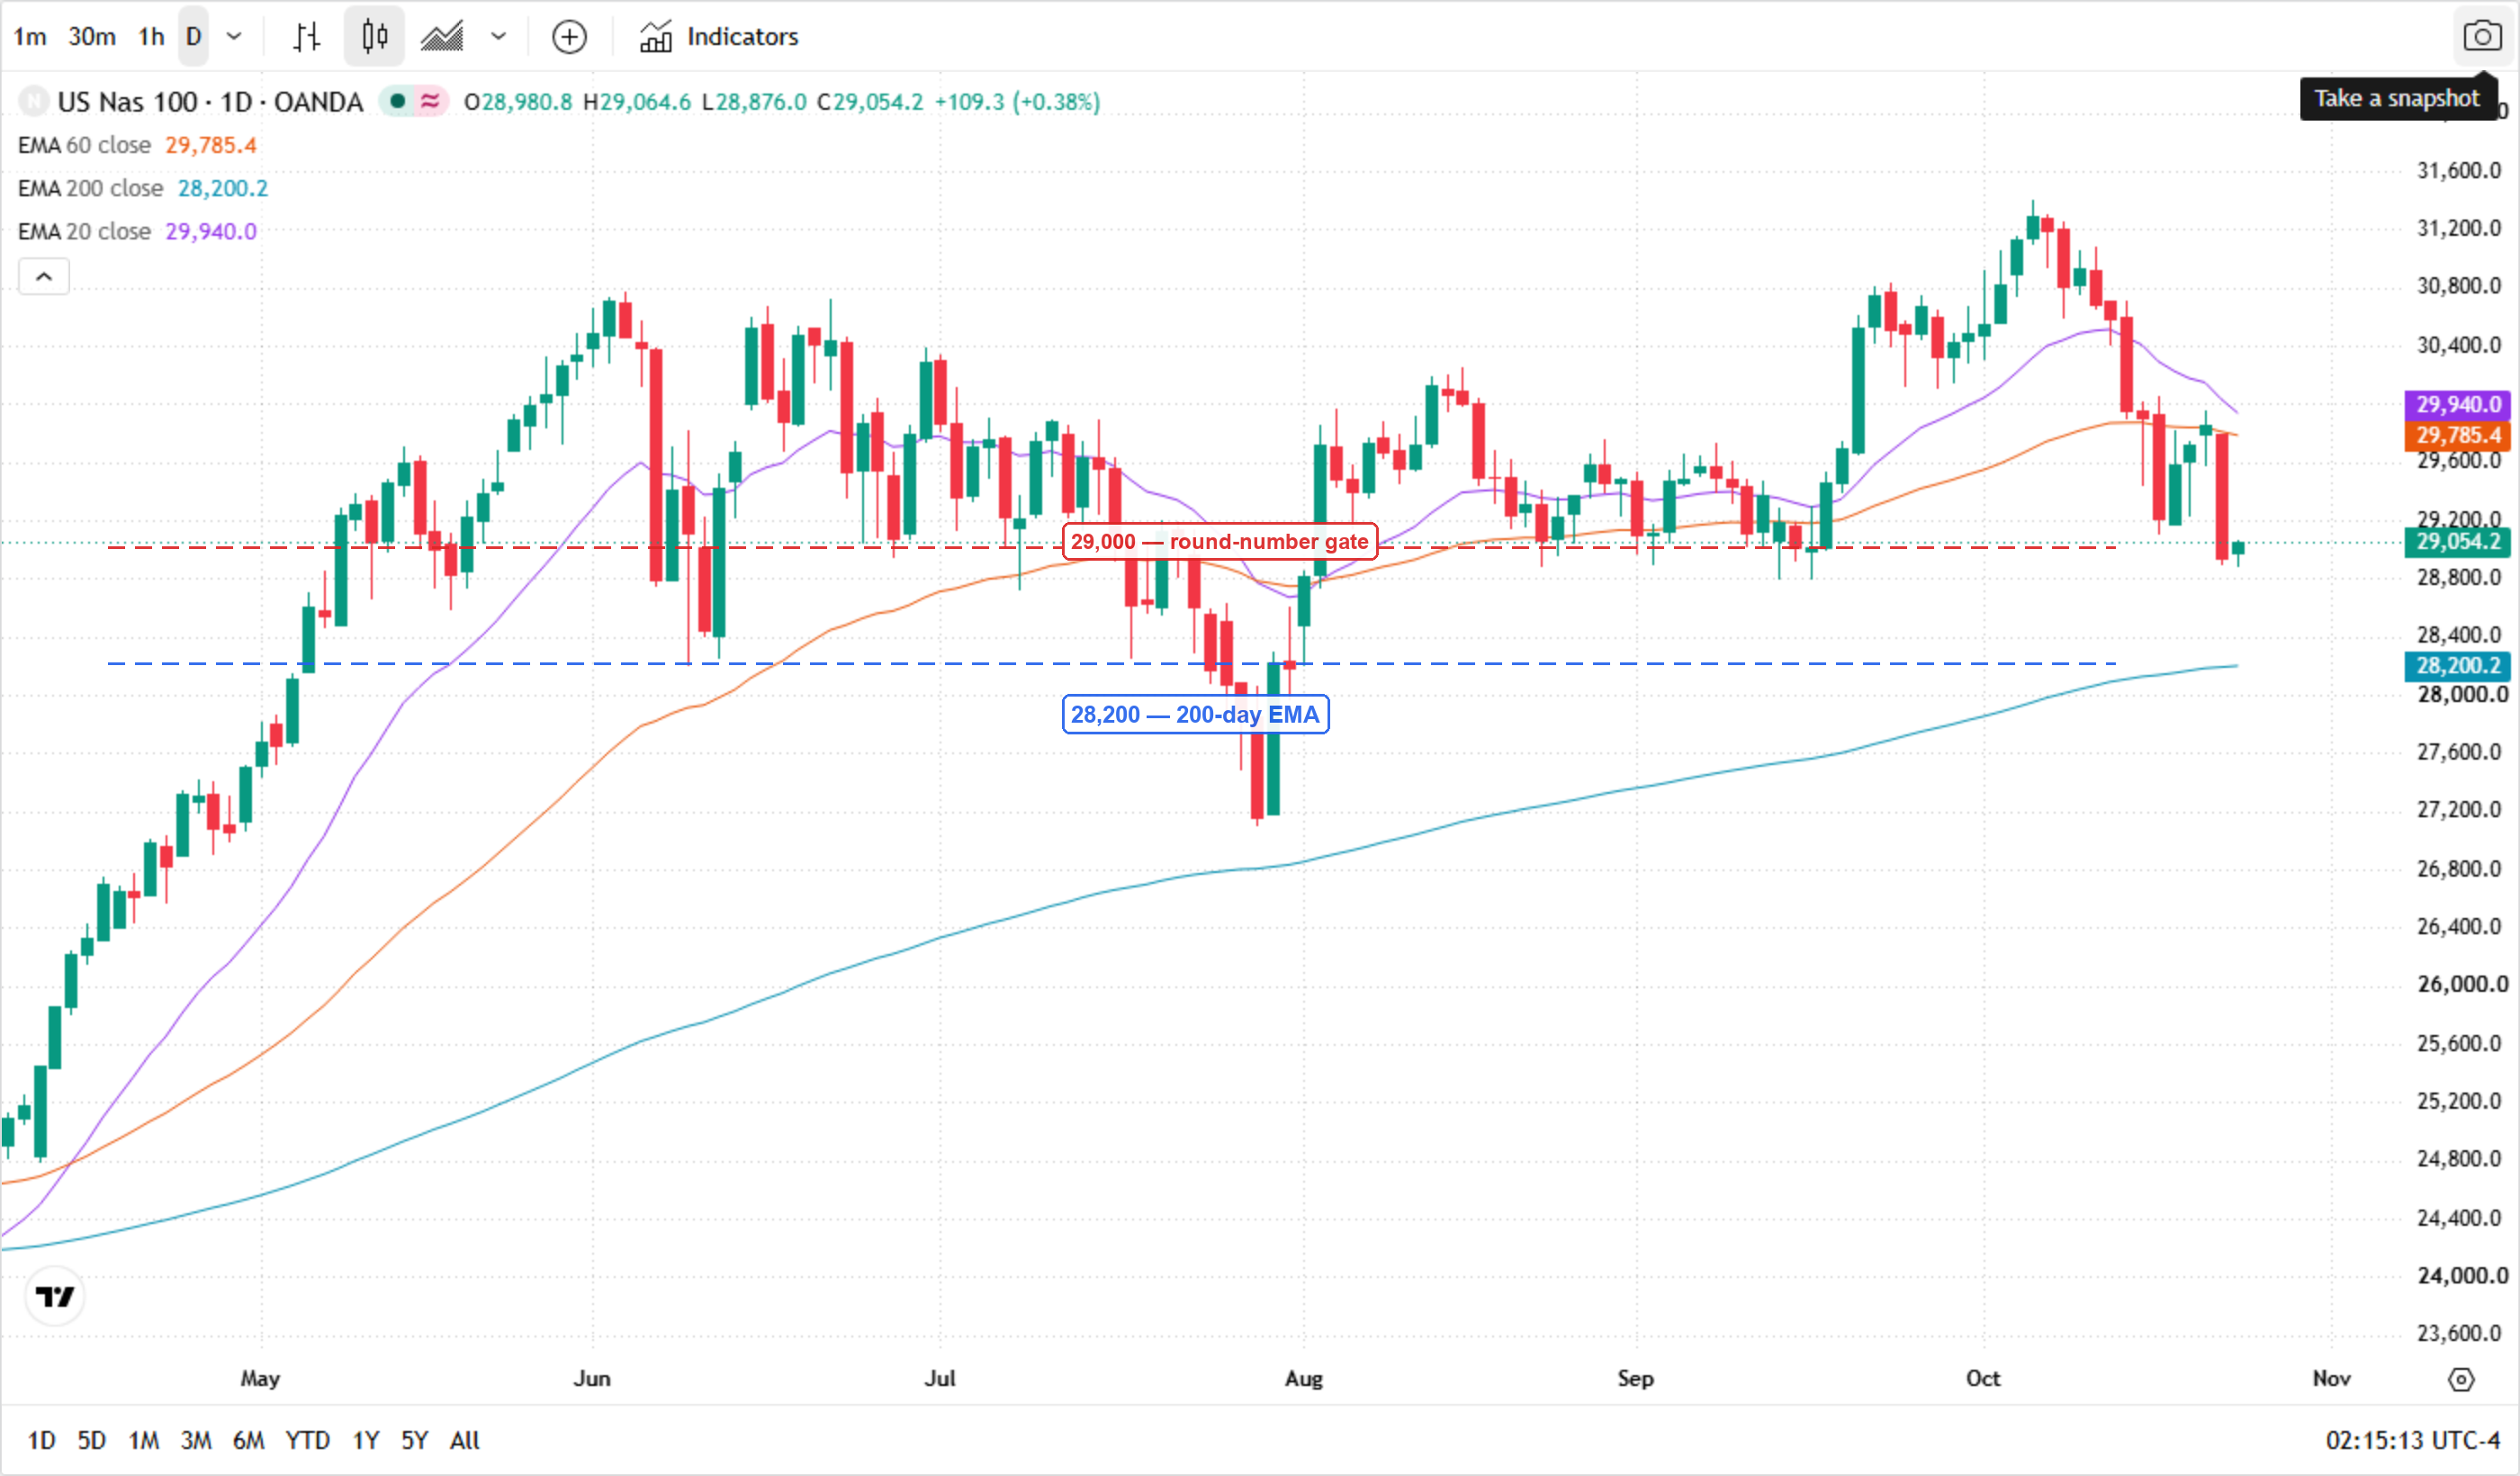
The chart: 29,000 is the gate, 28,200 is the floor
* Image source: TradingView (OANDA:NAS100USD, Nasdaq-100 CFD).
On the Nasdaq-100, the picture is a trend test rather than a trend break. The index is 7.66% below its 31,361 October high, 0.14% below the 29,000 round number, and still 2.62% above the 200-day EMA at 28,200 — a line it has not closed below since early April. The 20-day and 60-day averages, at 29,934 and 29,783, are now overhead resistance. A close back above 29,000 would put the index back in its October range; a weekly close below 28,200 would end the uptrend that began in the spring.
What to watch: five checks, two paths
Meta's capex hold. If the $135 ~ 145 billion guidance survives the Q3 call season, Thursday was a valuation reset. If any hyperscaler cuts, the chain reaches suppliers.
Credit, not equities. HYG has not moved more than 0.5% in either direction in any session this month. A week of outright high-yield weakness would say the funding channel is finally transmitting.
29,000 on the Nasdaq-100. Reclaiming it keeps the October range intact — a 0.14% move from Thursday's close.
26,000 on the Composite. The index closed 8.9 points above it; a break would confirm the deeper correction.
VIX holding above 20. A close above 20 would confirm that the stress is being expressed through equity volatility rather than credit — the one channel that has stayed closed.
Two paths: if credit stays firm and the Nasdaq-100 reclaims 29,000, this is a rotation inside an uptrend, and the equal-weight strength is the tell. If high yield turns and 28,200 fails on a weekly close, the AI trade has a funding problem rather than a price problem — and that is a different market.
Read more
* The content presented above, whether from a third party or not, is considered as general advice only. This article should not be construed as containing investment advice, investment recommendations, an offer of or solicitation for any transactions in financial instruments.


