Bitcoin's double top at $88,000: why $78,000 is the line that decides the next move

coverImg
Source: DepositPhotos

Mitrade Insights — Bitcoin is doing something that looks bearish on the chart but has not yet confirmed: it has twice failed near $88,000 and is now trading around $82,500 (+0.47%), roughly midway between that ceiling and the $78,000 neckline. That structure is a potential double top — a pattern that only becomes actionable once the neckline breaks. Until then, the market is holding two scenarios at once, and the level that separates them is clearly defined.

1. The setup: two failures at $88,000

The first peak formed in early September near $87,000. Price pulled back to the $78,000 area, then rallied again into early October, where the second peak stalled near $88,000 — a marginally higher high, but not a decisive breakout. The two peaks plus the intervening trough give the pattern its shape.

What matters now is not the shape itself but the confirmation rule: a double top is only complete when price closes below the trough between the peaks. That trough is the neckline at $78,000. As long as Bitcoin holds above it, the pattern remains a warning, not a signal.

2. Why $78,000 matters more than $88,000

The $78,000 neckline sits just above two other supports that reinforce it:

LevelWhat it isWhy it matters
$80,000Round-number supportThe first line of defence; buyers defended it in early October
$78,000Double-top necklineThe pattern's confirmation line — a daily close below completes the top
$75,975200-day EMAThe trend line that has underpinned the rally since July

If $78,000 breaks, the measured target is straightforward: the height of the pattern (roughly $9,800 from $88,000 to $78,000) projected downward from the neckline gives about $68,200. That target is not a forecast — it is the standard double-top measurement, and it only becomes relevant after a confirmed break.

3. The bull case that keeps the pattern unconfirmed

The reason Bitcoin has not broken down is that the broader structure is still constructive. The July low near $58,000 and the higher lows since then — including the September trough at $78,000 — form a rising trendline. The 200-day EMA at $75,975 is rising, not falling. And the macro backdrop has not turned hostile: the dollar slipped to 101.76 on Friday and 10-year yields eased from their highs, even as the Fed's October 27–28 meeting approaches with hike odds near 52%.

That combination — a bearish chart pattern sitting on top of a rising trend — is exactly why the market is range-bound rather than trending. The pattern needs a break to matter; the trend needs a break to die.
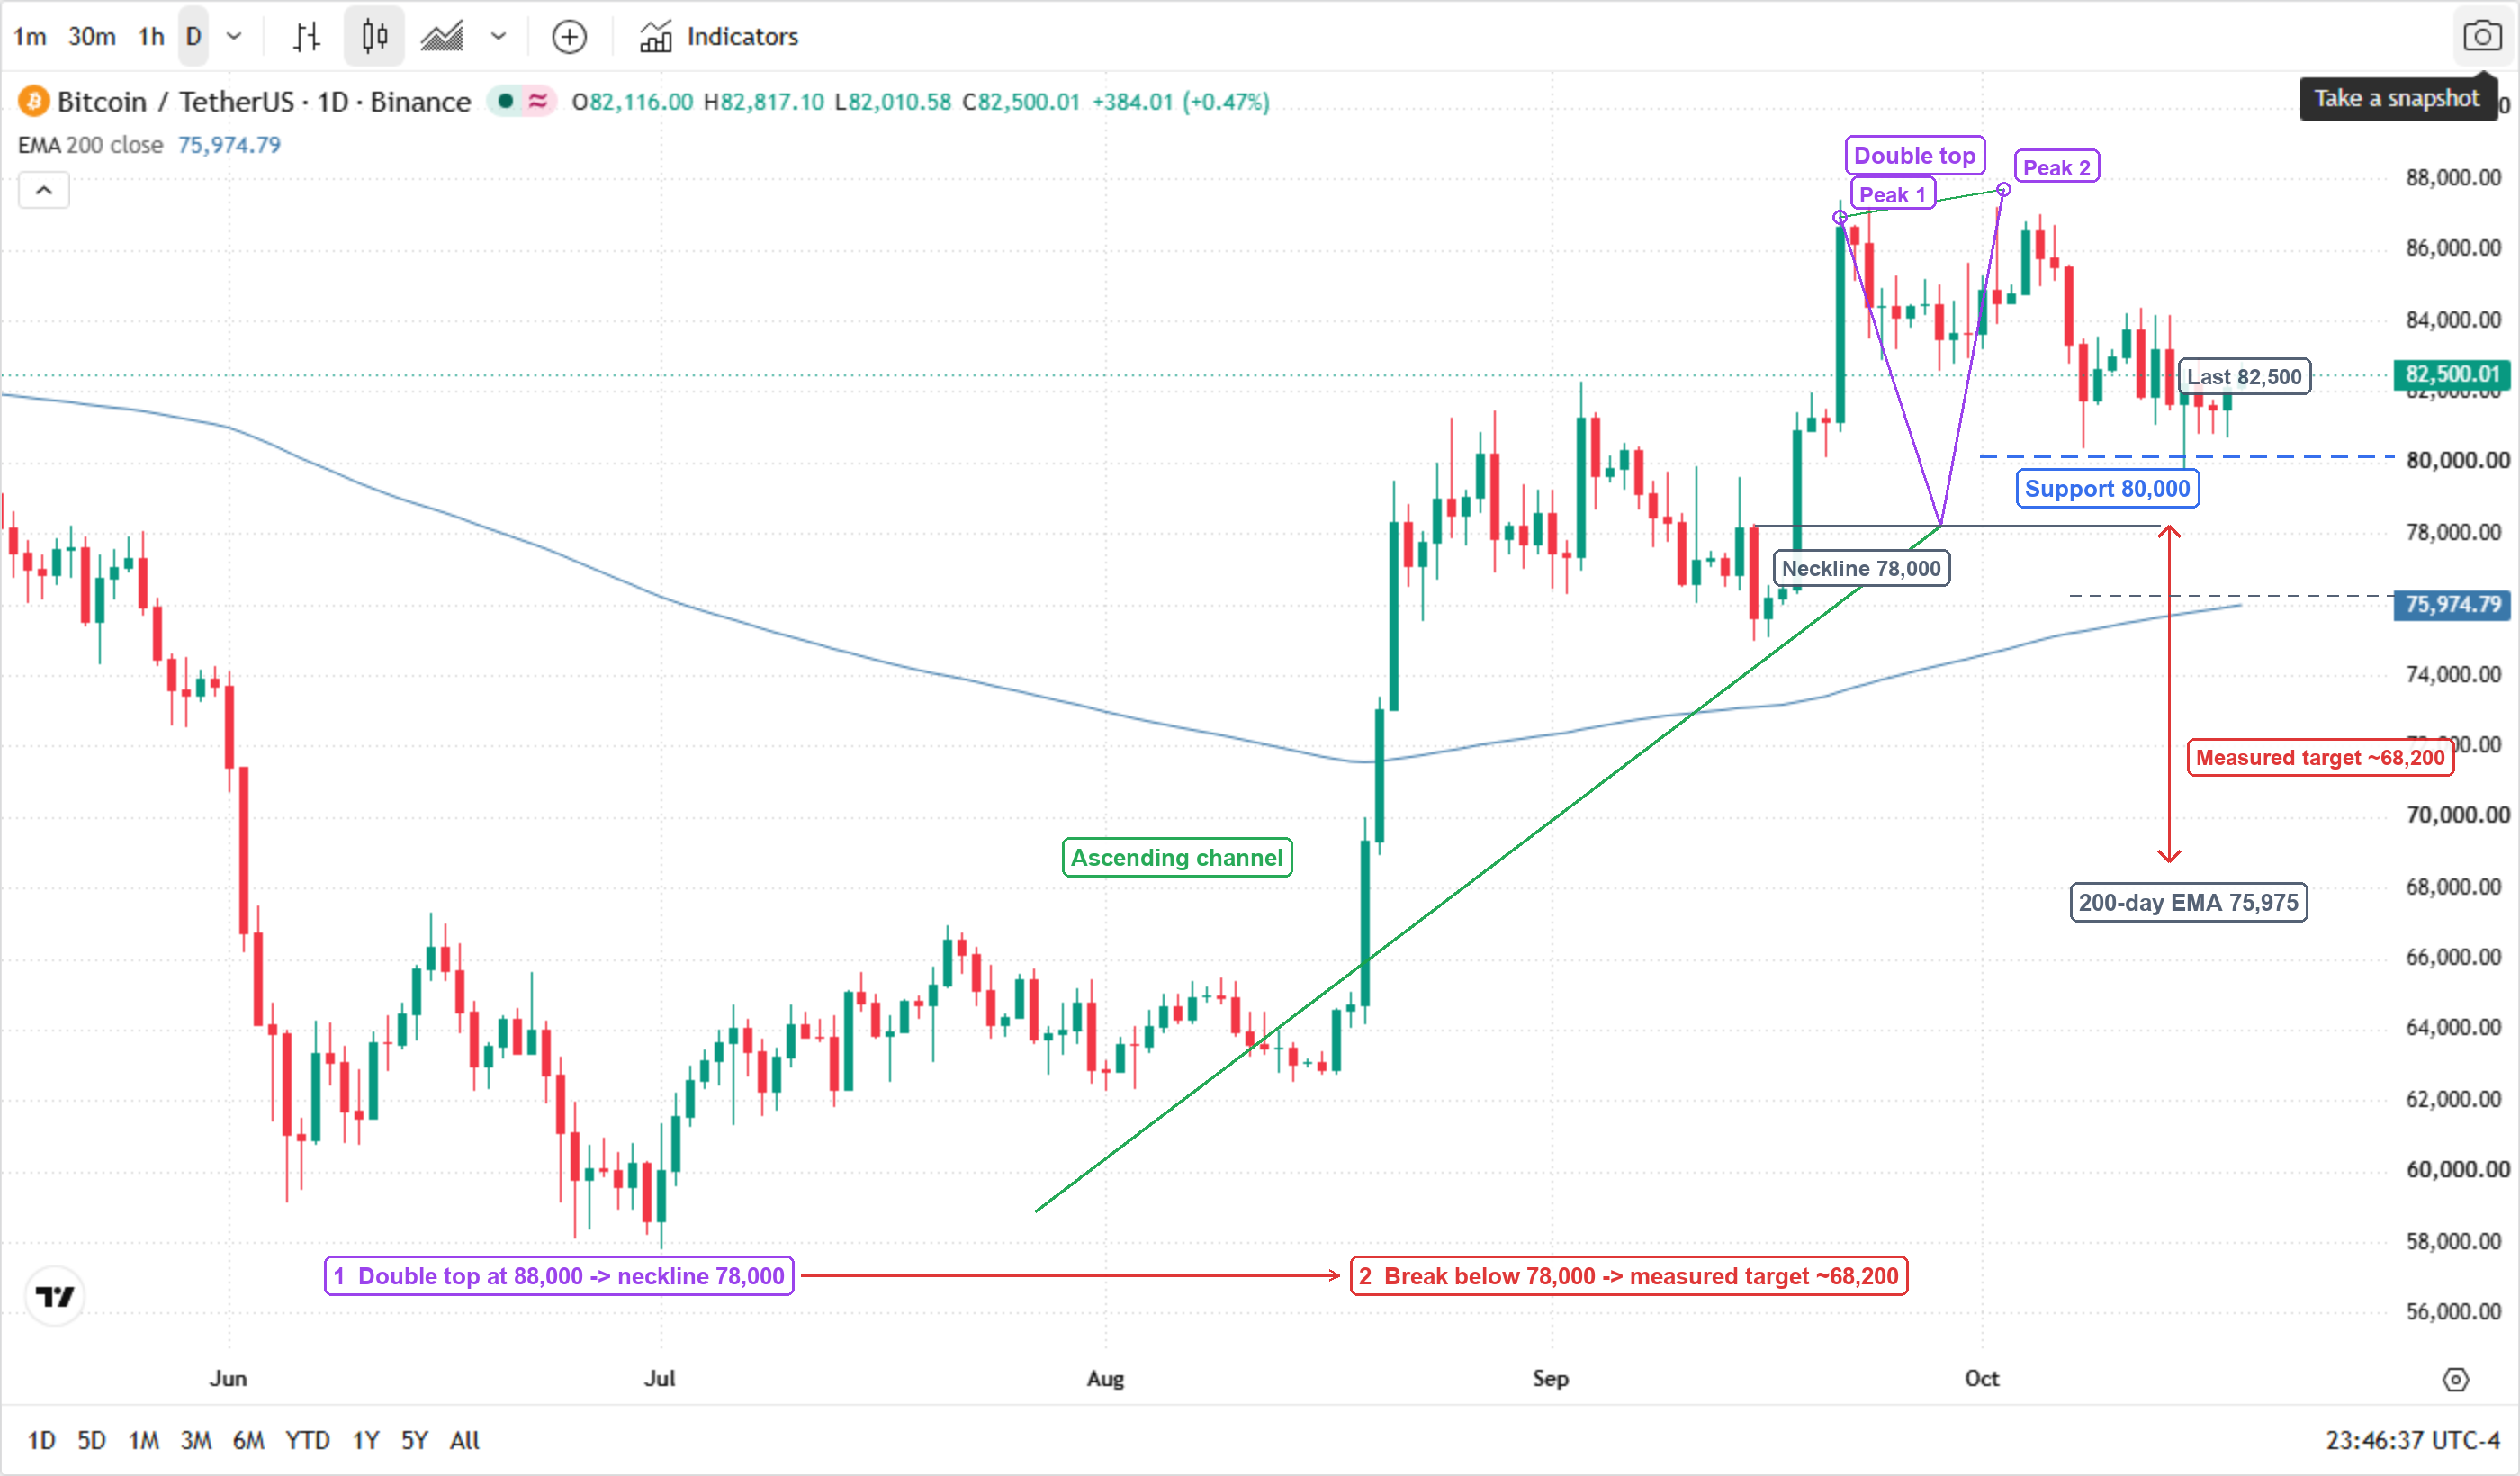
Bitcoin / TetherUS (BINANCE:BTCUSDT) daily candlestick chart with the 200-day EMA, June to October 2026: June's slide to the high 50,000s; a July low near 58,000; a recovery through August; an early-September peak near 87,000; a pullback to the 78,000 neckline; a second peak near 88,000 in early October; and a current price near 82,500. The chart is annotated with a purple double-top outline (Peak 1, Peak 2), a grey neckline at 78,000, a red measured-target arrow from 78,000 to about 68,200, a green ascending channel (lower rail from the July low, upper rail connecting the August–October highs), support at 80,000, the 200-day EMA at 75,975, and two numbered flow boxes.

* Chart source: TradingView official chart screenshot (BINANCE:BTCUSDT).

4. What confirms which side

  • Bearish confirmation: a daily close below $78,000. That completes the double top and opens the $68,200 measured target. A close below $75,975 (the 200-day EMA) would strengthen the case.

  • Bullish invalidation: a daily close above $88,000. That would turn the double top into a failed pattern and shift focus back to the September high area.

  • Neutral zone: between $78,000 and $88,000, the market is trading structure, not trend. Breakouts inside this range have repeatedly failed; waiting for a daily close is the discipline the pattern demands.

Bottom line: Bitcoin's chart is flashing a warning, not a verdict. The double top at $88,000 is real; the neckline at $78,000 is the line that decides whether it becomes a trade.

Related reads: Gold retests $4,200 as dollar and yields retreat — can bullion clear its hardest level? · Bitcoin's V-shaped rebound: from $80,953 back above $83,000 — spot buyers step in as the Fed softens, but ETF outflows linger

Read more

  • Gold Price Forecast: Gold Falls Below $4,100, Can October Nonfarm Payrolls Fuel Another Rally?
  • Note: If you want to share the article 《Bitcoin's double top at $88,000: why $78,000 is the line that decides the next move》, make sure you retain the original link. For more information, please visit Insights or browse www.mitrade.com.

    * The content presented above, whether from a third party or not, is considered as general advice only.  This article should not be construed as containing investment advice, investment recommendations, an offer of or solicitation for any transactions in financial instruments.

    goTop
    quote
    Related Articles
    placeholder
    Micron's $4.5 billion Taiwan fab won't make a chip until 2028 — the market sold it as a 2026 problemMicron fell 17.46% to $656.39 after Bloomberg reported construction at its $4.5 billion Taoyuan Fab 11E had all but halted over a labor dispute. The plant was not due online until 2028, so no 2026 output is lost. With FY27 EPS consensus near $160 and 2027 HBM sold out, the selloff is a peak-cycle multiple reset, not a demand collapse — and $650 is the line that separates the two.
    Author  Irene Q.
    Nov 06, Fri
    Micron fell 17.46% to $656.39 after Bloomberg reported construction at its $4.5 billion Taoyuan Fab 11E had all but halted over a labor dispute. The plant was not due online until 2028, so no 2026 output is lost. With FY27 EPS consensus near $160 and 2027 HBM sold out, the selloff is a peak-cycle multiple reset, not a demand collapse — and $650 is the line that separates the two.
    placeholder
    Gold's $250 week runs into the last payrolls before DecemberSpot gold traded at $4,080.79 after a roughly 6% weekly rally from the Oct 30 low of $3,869.85, touching $4,146.63 on Nov 5. Three bids are stacked into the move: real-rate relief, record official-sector buying, and a geopolitical premium. Tonight's October payrolls (+65K consensus, 4.2% unemployment) decide which bid survives, with $4,000 and $4,200 as the two lines.
    Author  Irene Q.
    Nov 06, Fri
    Spot gold traded at $4,080.79 after a roughly 6% weekly rally from the Oct 30 low of $3,869.85, touching $4,146.63 on Nov 5. Three bids are stacked into the move: real-rate relief, record official-sector buying, and a geopolitical premium. Tonight's October payrolls (+65K consensus, 4.2% unemployment) decide which bid survives, with $4,000 and $4,200 as the two lines.
    placeholder
    Brent at $103.60: the peace trade is selling paper, but the physical market just drew 5.3 million barrelsBrent settled at $103.60, its lowest close since October 7 and an 8% weekly drop on US-Iran talks. Yet API crude stocks fell 5.267 million barrels versus a 2.1 million build expected.
    Author  Irene Q.
    Nov 04, Wed
    Brent settled at $103.60, its lowest close since October 7 and an 8% weekly drop on US-Iran talks. Yet API crude stocks fell 5.267 million barrels versus a 2.1 million build expected.
    placeholder
    Bitcoin is back above $80,000 — but 75% of the bounce was shorts, not buyersBitcoin trades at $80,669, back above the $80,000 line after touching $79,145 on October 24. But 75.4% of the last 24 hours of futures liquidations were shorts, CME open interest fell 36,545 BTC in October, and spot ETFs lost $773.5 million on October 22-23. Price is up; positioning is down. Here is why the bounce is a squeeze, and the four things that would make it real.
    Author  Suzie
    Oct 28, Wed
    Bitcoin trades at $80,669, back above the $80,000 line after touching $79,145 on October 24. But 75.4% of the last 24 hours of futures liquidations were shorts, CME open interest fell 36,545 BTC in October, and spot ETFs lost $773.5 million on October 22-23. Price is up; positioning is down. Here is why the bounce is a squeeze, and the four things that would make it real.
    placeholder
    Tesla jumps 5% as Barclays puts a $450 target on the SpaceX merger — the chart was already pointing to 431Tesla closed at $391.62 on October 26, up 5.21%, after Barclays upgraded the stock to Overweight and lifted its target to $450 from $370, citing a sharp inflection in Robotaxi miles and a potential SpaceX merger. The move also completed a double bottom at $345.88 and $349.33, with a neckline at $388.56 and a measured target of $431.24. Here is what the upgrade actually says, why the chart and the analyst now point the same way, and what would break the target.
    Author  Irene Q.
    Oct 27, Tue
    Tesla closed at $391.62 on October 26, up 5.21%, after Barclays upgraded the stock to Overweight and lifted its target to $450 from $370, citing a sharp inflection in Robotaxi miles and a potential SpaceX merger. The move also completed a double bottom at $345.88 and $349.33, with a neckline at $388.56 and a measured target of $431.24. Here is what the upgrade actually says, why the chart and the analyst now point the same way, and what would break the target.

    Price Prediction Related Articles

    • Stop Loss: Your Savior In The Market

    Click to view more