Gold breaks $4,000 as oil becomes the inflation problem — $3,943 is the line that matters

coverImg
Source: DepositPhotos

Mitrade Insights — Spot gold closed at $3,995.6 on October 23, down about 4.1% for the week, after touching $3,975 — its lowest since mid-July. On October 26 it traded near $3,988. The unusual part is what happened around it: Brent crude settled at $116.72, up about 6% on the week and near a six-month high, while Middle East supply risk remained elevated. Gold usually catches a bid when oil and geopolitics flare together. This time it did not.

Three numbers: $4,008, $3,943, 4.99%

The first number is the price: $4,008 on the COMEX December contract and $3,988 on spot, just below the $4,000 line. The second is $3,943, the July low that Bank of America's Paul Ciana calls the more important level. The third is 4.99%, the 10-year Treasury yield.

Put them together and the story is not “gold lost its haven status.” It is that the haven bid was outbid by the discount rate.
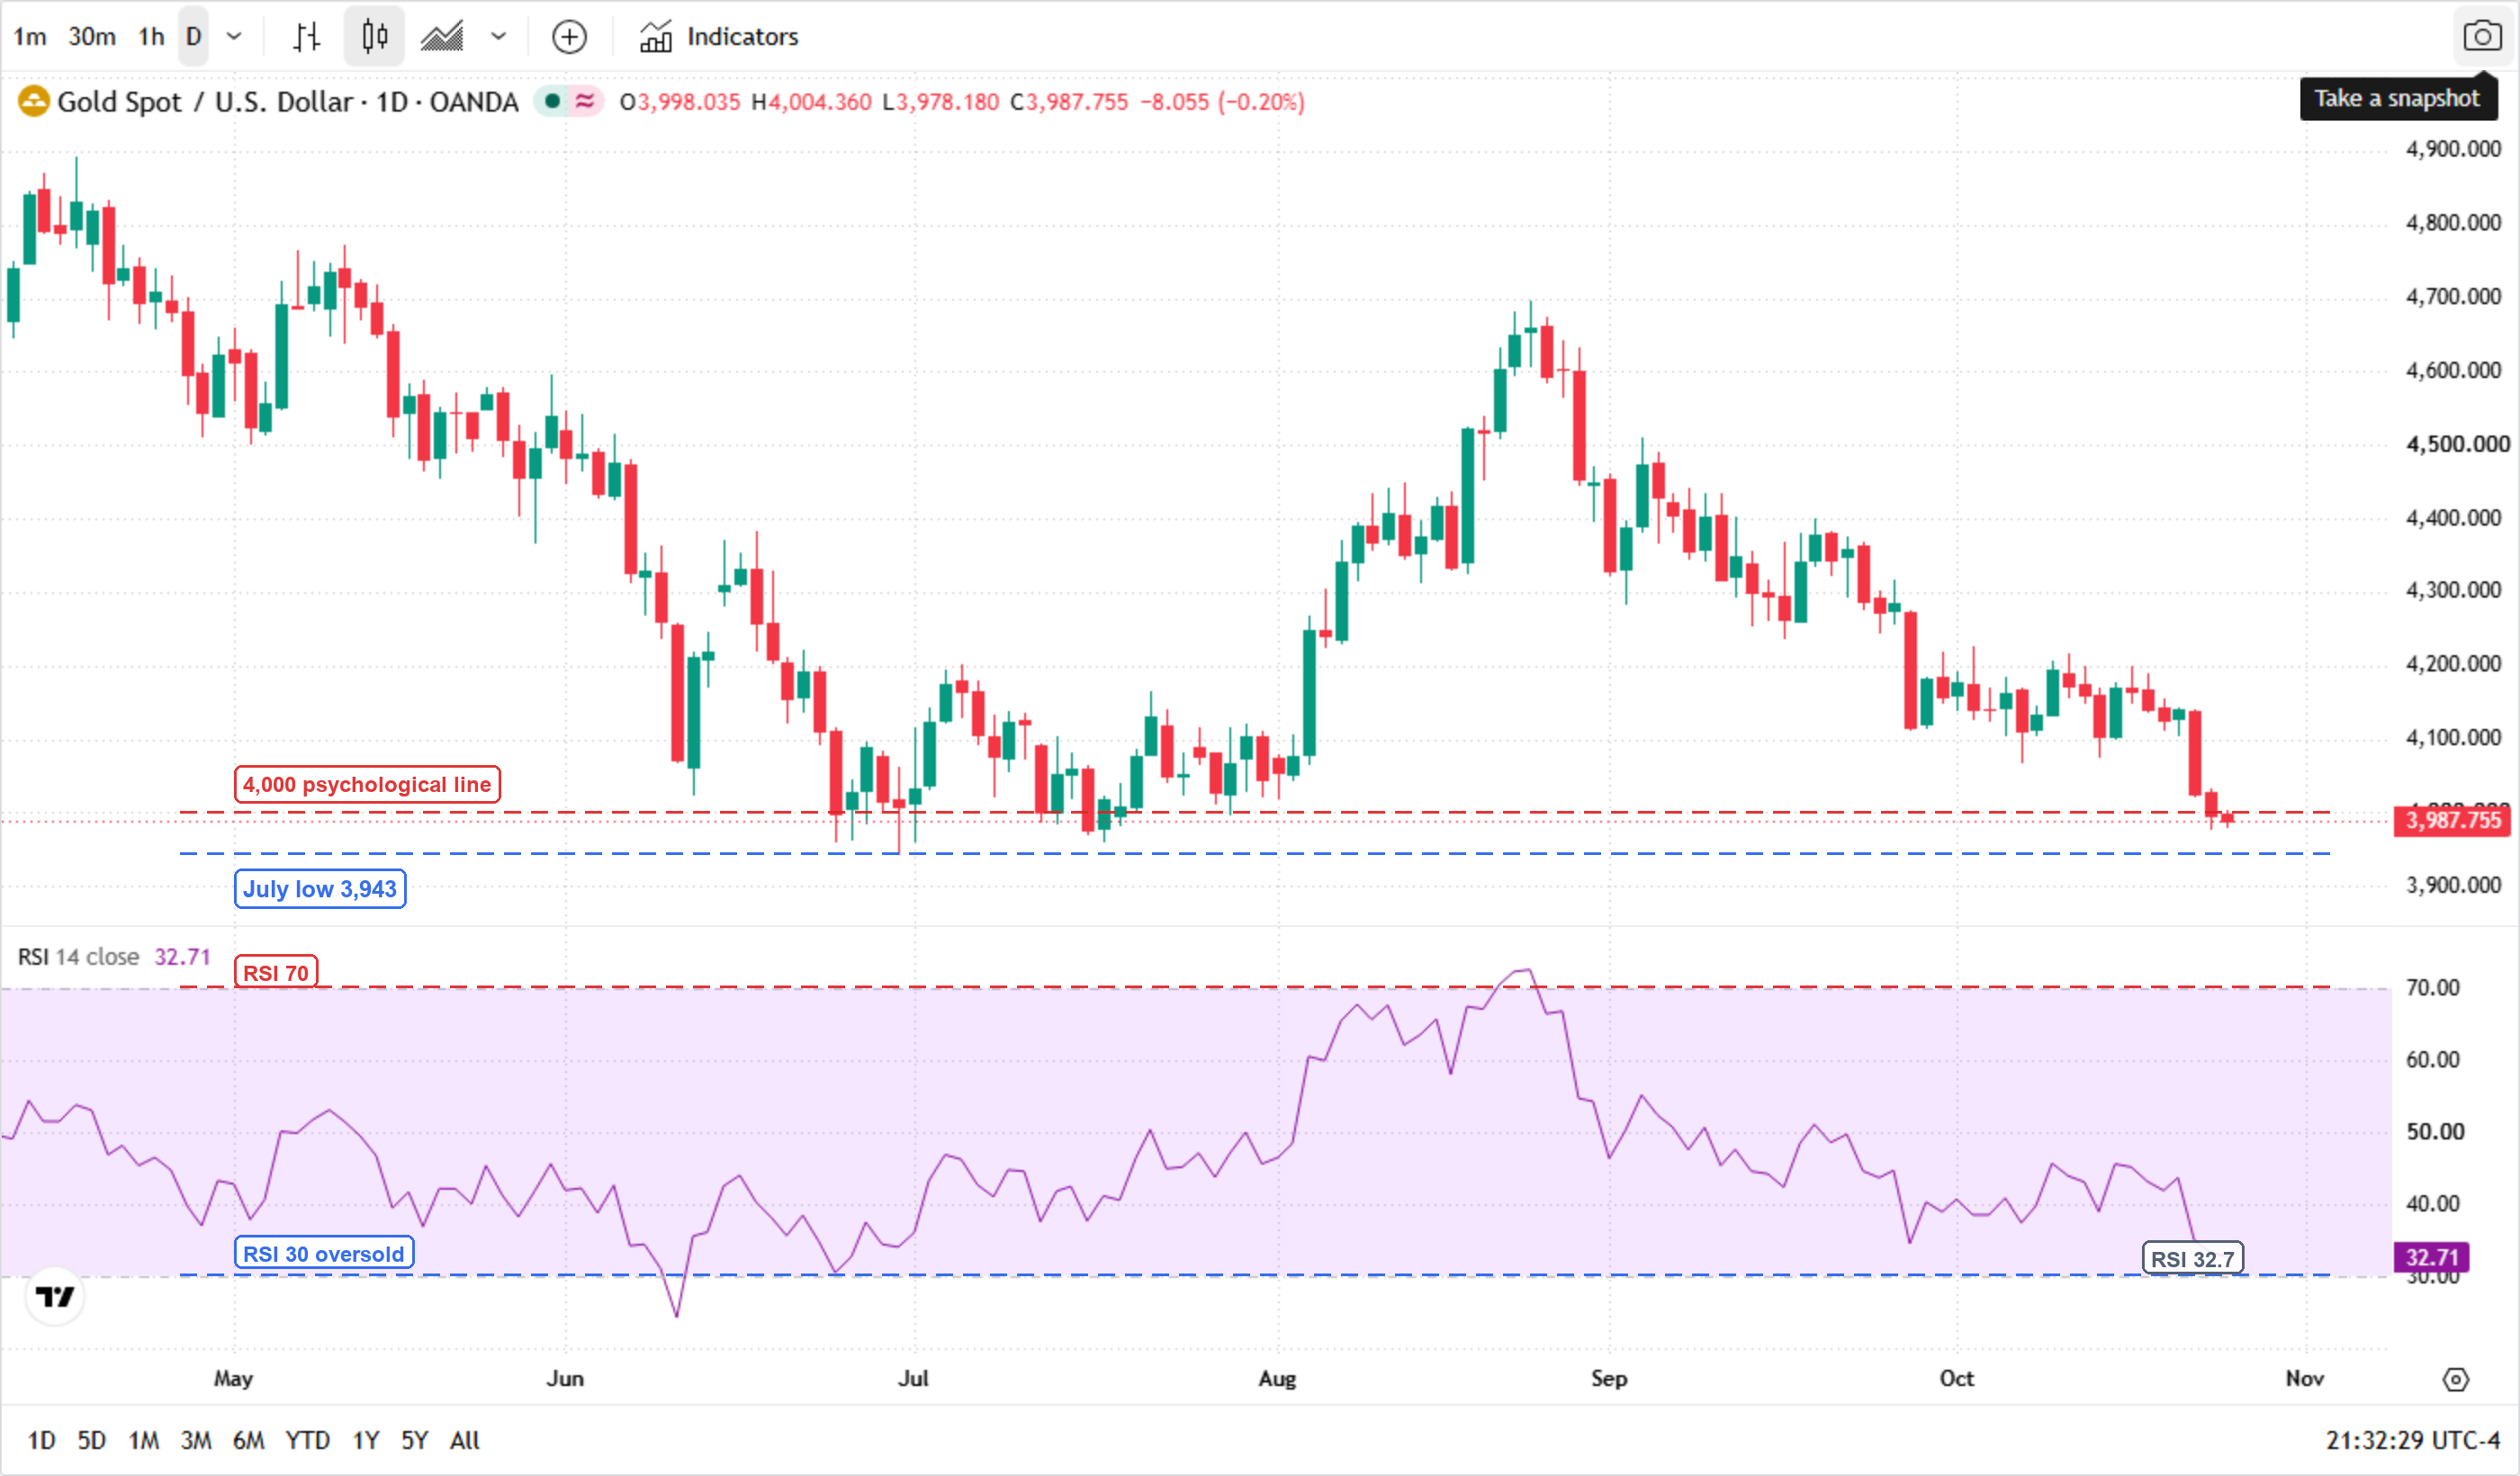
Gold spot / US dollar (XAUUSD) daily chart, May to late October 2026, with a 14-day RSI panel. The main panel marks the $4,000 psychological line (red dashed) and the July low at $3,943 (blue dashed); price is $3,987.755 — below the $4,000 line but above the $3,943 July low. The RSI panel marks the 70 overbought and 30 oversold lines, with the latest reading at 32.7.

* Image source: TradingView (OANDA:XAUUSD, gold spot CFD).

Why the war premium stopped working

Oil is now the inflation trade

Brent's move from roughly $110 to $116.72 in a week is not a demand story. It is a supply-risk premium: attacks on Saudi energy infrastructure and shipping, plus the threat around the Strait of Hormuz. For most of the past two years, that would have been a straightforward gold bid. This time the same barrel of oil feeds directly into the inflation expectations that drive Fed pricing.

CME FedWatch shows a 90% chance the Fed holds at 3.75%–4.00% on October 28, but a 68.9% chance of a 25bp hike by December, and 76.2% odds of at least one hike by year-end. Higher oil pushes the hike path further out, not away.

The dollar and the real yield

The 10-year nominal yield actually fell about 16 basis points on the week, to 4.988%. If gold were trading off nominal yields alone, it should have held. It did not, because the relevant rate is the real yield: when oil lifts inflation expectations faster than nominal yields, the real yield rises even with the nominal yield flat. The dollar added a second pressure point, with DXY at 101.81.

AssetOct 23 closeWeekly changeWhat it says
Spot gold$3,995.6-4.1%Lowest since mid-July
COMEX silver$53.71about -6%2026 low; industrial beta cut both ways
Brent crude$116.72+6%Supply-risk premium, not demand
US 10-year yield4.988%-16 bpNominal yields fell; gold still fell
Dollar index (DXY)101.81small gainA second headwind

The July low is the line

The technical map is unusually clean. Support sits at $3,985, $3,970, $3,943 (the July low), then $3,886 and $3,700. Resistance is $4,015, $4,035, $4,065–$4,075 and $4,230. The 14-day RSI is 30.7, just into oversold territory, and price is below the 20-, 60- and 200-day averages shown on the chart.

LevelPriceWhy it matters
Support 1$3,985Near-term gamma support
Support 2$3,943July low; BofA's double-bottom line
Support 3$3,886 / $3,700Next targets if $3,943 breaks
Resistance 1$4,035Base case stays bearish below it
Resistance 2$4,065–$4,075First real recovery test
Resistance 3$4,230Would signal the correction is over

The Kitco weekly survey is split: 41% of Wall Street analysts expect further declines, 24% expect a rise and 35% expect sideways. UBS still sees $5,400 by September 2027; BofA's near-term map is $3,886 then $3,700.

What would make this a bottom

The strongest historical analogy comes from the July low itself. Gold bottomed near $3,943 — BofA's level — then rallied to about $4,753 by late August, a 20% move. BCA Research notes that the gap between the current price and its 200-day average resembles that late-July short-term bottom. If the same setup is repeating, $3,943 is where buyers should appear again, and a reclaim of $4,065–$4,075 would confirm it.

The counter-case is equally specific. If $3,943 breaks on a daily close, the July analogy fails and the measured move opens $3,886 and then $3,700. That would not be a haven story at all; it would be a repricing of gold's discount rate in a world where oil keeps the Fed hiking.

Read more

  • Today’s Market Recap: Nvidia Drops Over 4% After Jensen Huang Resigns, AMD and Broadcom Both Rise Over 5%
  • Gold hit a one-year low while central banks bought 321 tonnes — the sellers were never the ones you think
  • Note: If you want to share the article 《Gold breaks $4,000 as oil becomes the inflation problem — $3,943 is the line that matters》, make sure you retain the original link. For more information, please visit Insights or browse www.mitrade.com.

    * The content presented above, whether from a third party or not, is considered as general advice only.  This article should not be construed as containing investment advice, investment recommendations, an offer of or solicitation for any transactions in financial instruments.

    goTop
    quote
    Related Articles
    placeholder
    Weekly Report: DXY 103.41, 10-year 5.15%, AUD carry 3bp — three FX regimes flipped in one weekThe dollar index rose 1.09% to 103.41, a 19-month high, while the US 10-year closed at 5.154% and the Australia-US two-year spread collapsed to about 3 basis points from 36. EURUSD fell 1.59% to 1.1024, USDJPY rose 1.51% to 159.78 and AUDUSD fell 1.79% to 0.6764, a 10-month low. Three FX regimes — the broad dollar, the US rate level and the Australian carry premium — flipped in the same week. This report marks the thresholds, ranks which one can flip back first, and lists the week's calendar.
    Author  Irene Q.
    4 hours ago
    The dollar index rose 1.09% to 103.41, a 19-month high, while the US 10-year closed at 5.154% and the Australia-US two-year spread collapsed to about 3 basis points from 36. EURUSD fell 1.59% to 1.1024, USDJPY rose 1.51% to 159.78 and AUDUSD fell 1.79% to 0.6764, a 10-month low. Three FX regimes — the broad dollar, the US rate level and the Australian carry premium — flipped in the same week. This report marks the thresholds, ranks which one can flip back first, and lists the week's calendar.
    placeholder
    US October PPI Preview: Fed Rate Hike Expectations Rise, PPI May Be Key Variable; How Will US Stocks, Dollar, and Gold Move?On Friday (Nov. 13) Eastern Time, the U.S. will release the October Producer Price Index (PPI). Following the October CPI once again exceeding expectations, the market will look to the PP
    Author  TradingKey
    Nov 12, Thu
    On Friday (Nov. 13) Eastern Time, the U.S. will release the October Producer Price Index (PPI). Following the October CPI once again exceeding expectations, the market will look to the PP
    placeholder
    US October CPI Preview: Inflation Growth May Slow, How Will US Stocks, Dollar and Gold React? On Tuesday (Nov. 10) Eastern Time, the U.S. will release the October Consumer Price Index (CPI), a key inflation reading ahead of the Federal Reserve's December interest rate decision. Th
    Author  TradingKey
    Nov 09, Mon
    On Tuesday (Nov. 10) Eastern Time, the U.S. will release the October Consumer Price Index (CPI), a key inflation reading ahead of the Federal Reserve's December interest rate decision. Th
    placeholder
    Weekly Report: The dollar rose and the euro rose with it — three FX divergences, one should convergeDXY added 0.41% last week and EURUSD added 0.41% in the same five sessions, despite a 60-day correlation of -0.73. AUDUSD fell 1.36% after the RBA's sixth hike of the year, and USDJPY barely moved 0.19% even as markets priced a December BOJ hike. Three divergences, one of which the mechanism forces to close.
    Author  Irene Q.
    Nov 09, Mon
    DXY added 0.41% last week and EURUSD added 0.41% in the same five sessions, despite a 60-day correlation of -0.73. AUDUSD fell 1.36% after the RBA's sixth hike of the year, and USDJPY barely moved 0.19% even as markets priced a December BOJ hike. Three divergences, one of which the mechanism forces to close.
    placeholder
    Breaking: US Dollar falls below 101.50 as early midterm results point to Democratic gainsUS Dollar Index (DXY) faces some selling pressure near 101.25 during the early Asian session on Wednesday. Traders will closely monitor the US midterm election outcomes later in the day for fresh impetus.
    Author  FXStreet
    Nov 04, Wed
    US Dollar Index (DXY) faces some selling pressure near 101.25 during the early Asian session on Wednesday. Traders will closely monitor the US midterm election outcomes later in the day for fresh impetus.
    Live Quotes
    Name / SymbolChart% Change / Price
    XAUUSD
    XAUUSD
    0.00%0.00
    XAGUSD
    XAGUSD
    0.00%0.00

    USD Related Articles

    • Financial Markets 2026: Volatility Catalysts in Gold, Silver, Oil, and Blue-Chip Stocks—A CFD Trader's Outlook
    • Best Currency Pairs To Trade 2026: Guide to Choosing Currency Pairs
    • Trading Chart Patterns:Ultimate Guide to Price Action
    • Australian Dollar Forecast In 2024/2025/2026: Should I Buy AUD/USD Or Other AUD Currency Pairs?
    • AUD/USD holds above 0.6500, eyes on RBA Minutes

    Click to view more