

Decoding Trumponomics: Trading Volatility in 2026 Ebook
Enter your email address
Create a password
Download instantly
Trumponomics & The Volatility Regime
This excerpt provides a peek into some of the topics covered in the ebook, "Decoding Trumponomics: Trading Volatility in 2026."
Global markets went into 2026 caught in a vice. Trumponomics — the mix of aggressive import tariffs, tax cuts and deregulation that defined Donald Trump's second term — did not merely reset US economic policy. It rewired how prices move across equities, currencies and commodities.
For anyone learning how to trade CFDs, the starting point is often the force driving price movements: volatility itself. What follows is the shape of the regime, the pressures behind it, and an examination of why oil price volatility in 2026 did not behave like any recent historical patterns.
Why 2026 Changed the Rules for Traders
When the Cboe Volatility Index (VIX) — Wall Street's so-called fear gauge — surged past 31 in March 2026, it did not simply register a number. It reflected what traders across asset classes had already been observing: market conditions were shifting.
Three forces are converging behind this:
Trumponomics caused by tariff escalation
Central banks gridlocked between inflation and slowing growth
Widening Middle East war disrupting global supply chains
Taken together, these forces have created a market environment in which understanding what drives price movement is no longer a background exercise, but is becoming increasingly important.
Why US Decisions Matter to Global Traders
How Tariffs Reshaped Global Stock Markets
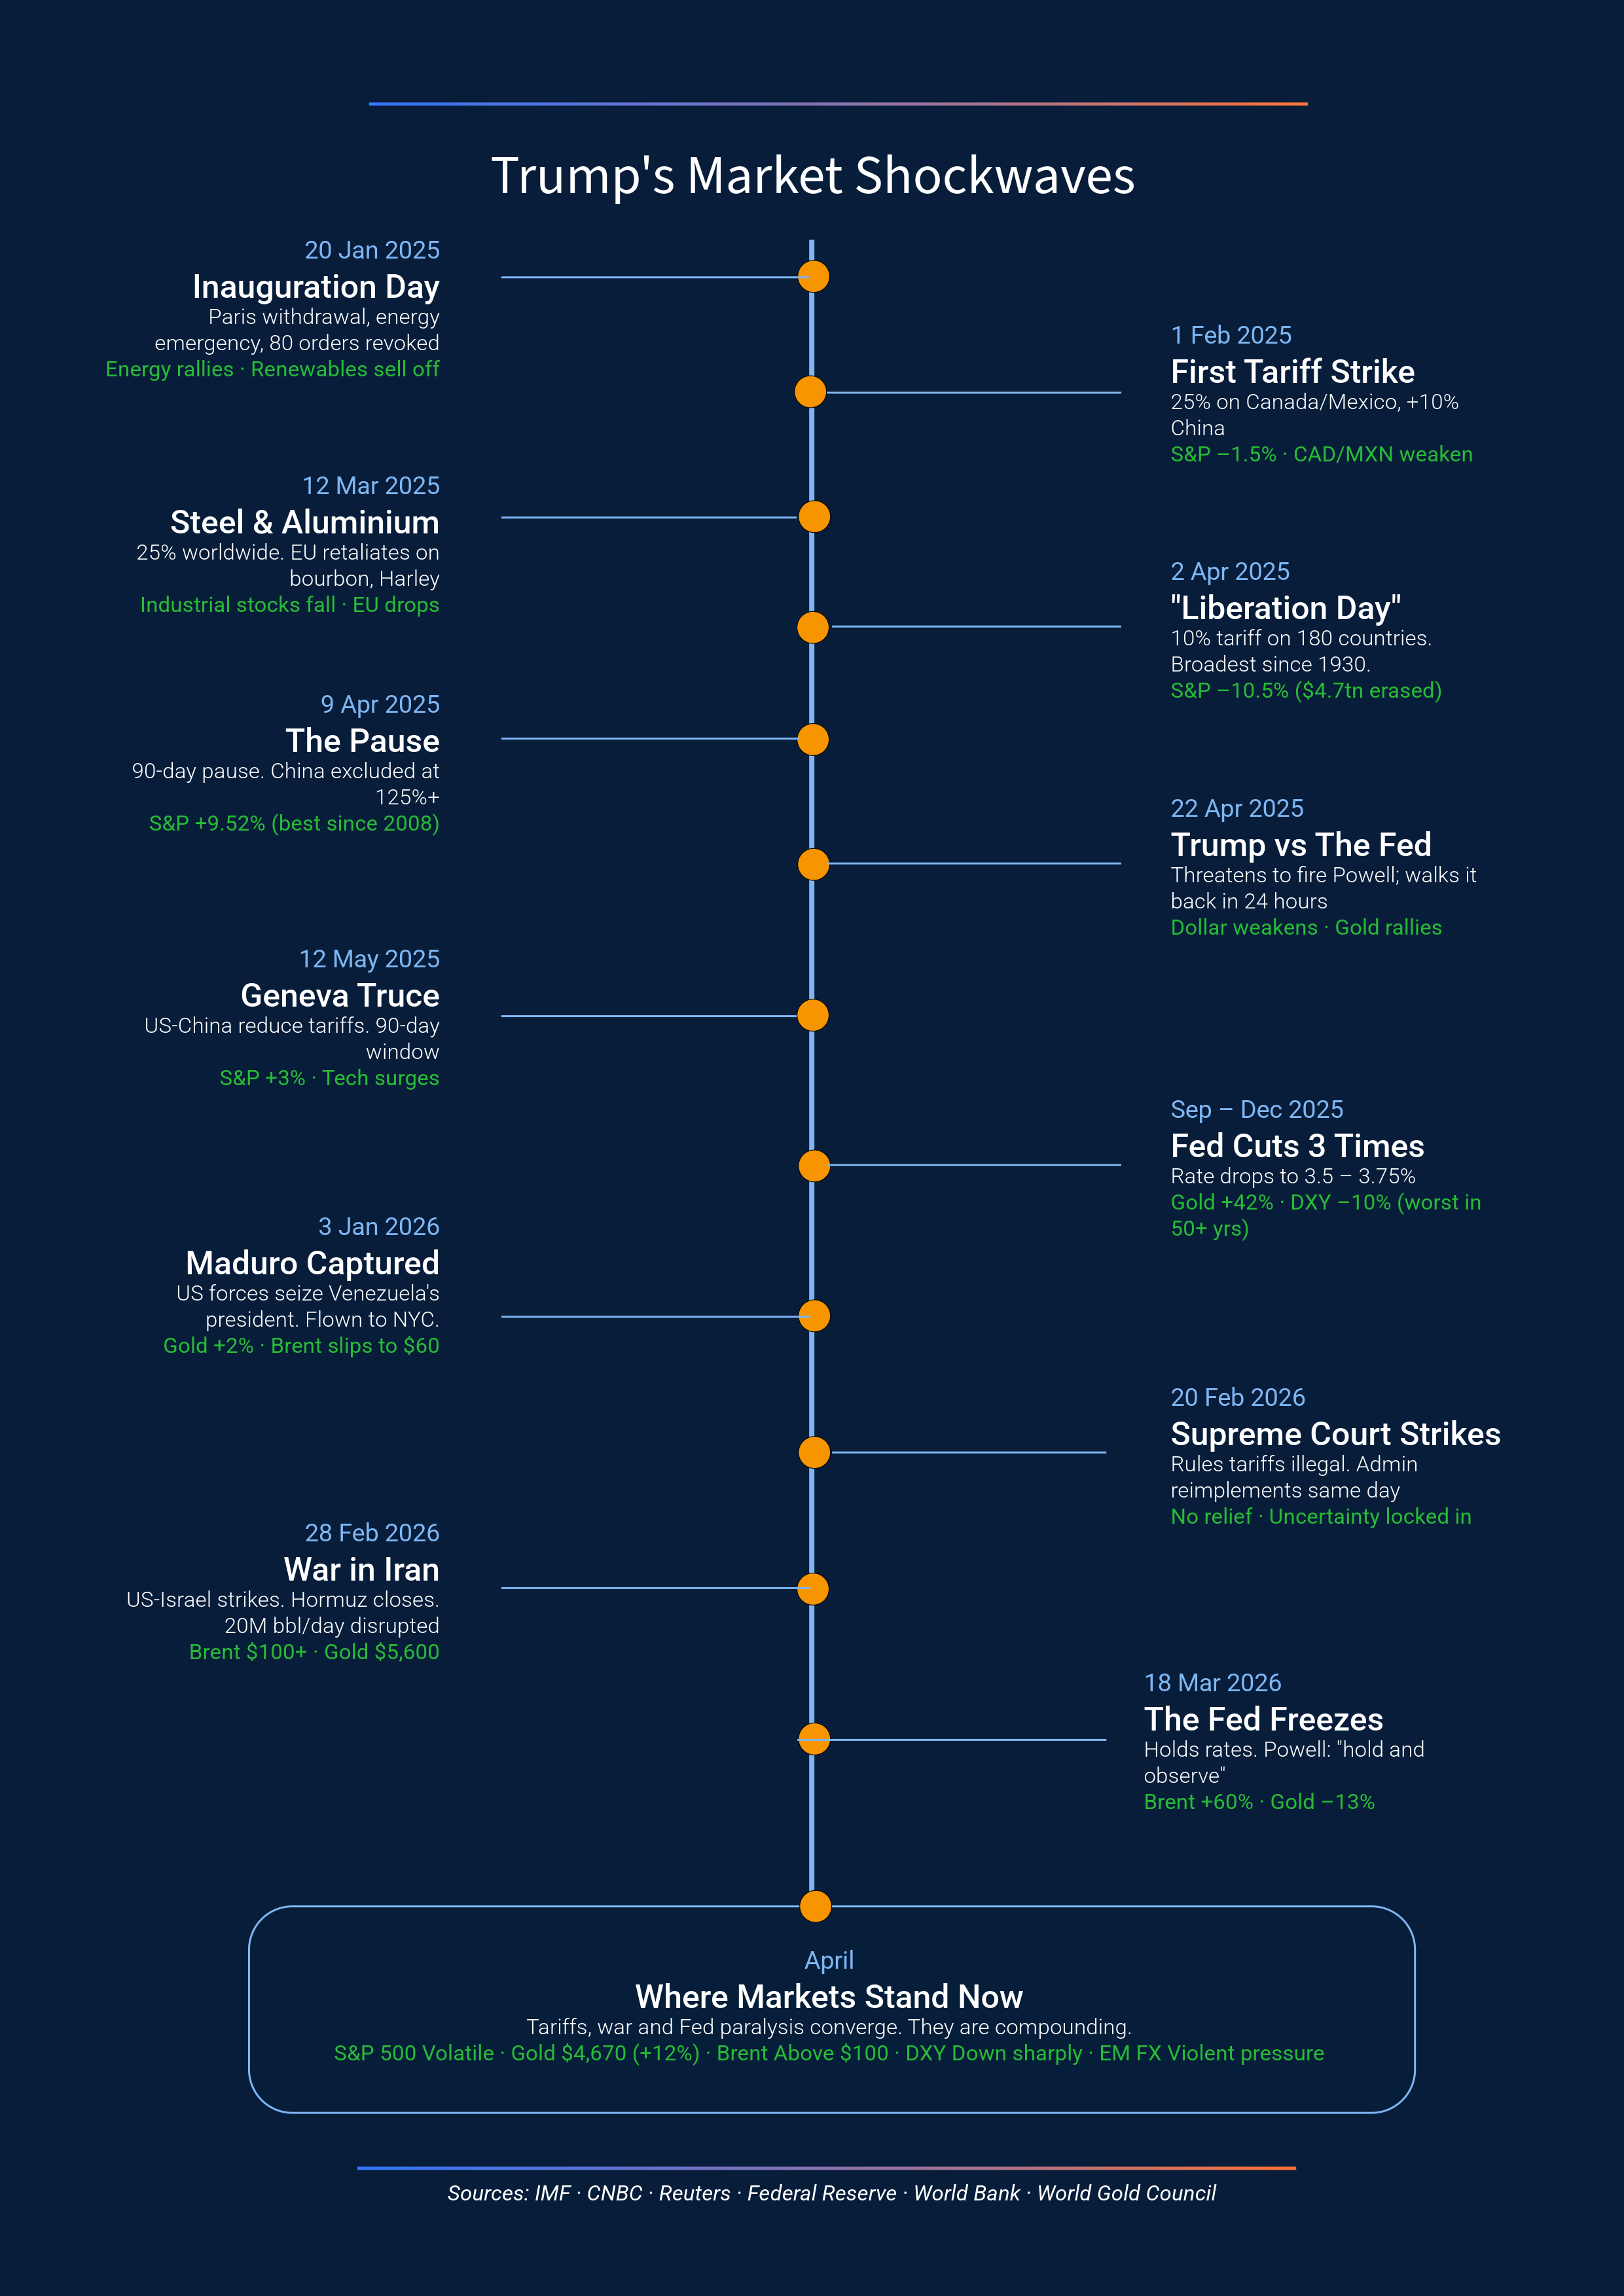
The first concrete shockwave of Trump's second term arrived in April 2025, when the administration imposed a universal 10% tariff on imports from 180 countries — the broadest US escalation since the Smoot-Hawley Tariff Act of 1930, according to the International Monetary Fund. Tariffs change the cost of doing business across entire supply chains, and modern supply chains are global:
Germany's DAX Index plunged roughly 10% at market opening on 7 April 2025
Australia's ASX 200 lost more than 7% across three sessions
The Indian rupee tumbled against the dollar, driven by tariffs, capital outflows and weak trade momentum.
The Turkish lira lost 17% of its value against the US dollar across 2025
A single policy decision in Washington reshaped how money moves around the world. That reflects the interconnected nature of a globalised economy.
How US Interest Rates Affect Global Markets
Through the second half of 2025, the Fed cut its benchmark rate three times, bringing it down to a target range of 3.5%–3.75%. Inflation had cooled. Unemployment sat between 4.3% and 4.4%.
The Fed's reach extends far beyond America. When it raises rates, global investors may shift capital into US assets seeking potentially higher returns, which can draw capital away from other markets. When it cuts, those flows may reverse. A single rate decision in Washington directly affects how much capital is available in global financial centres.
How the US-Led War in Iran Disrupted the Strait of Hormuz
In late February 2026, conflict erupted in the Middle East. Within days, the Strait of Hormuz became the centre of a global energy crisis. About 20 million barrels of oil pass through it every day, along with roughly one-fifth of the world's liquefied natural gas trade, according to the US Energy Information Administration. In early March 2026, the strait was effectively closed.
The closure turned it into a case study: oil prices surged, energy supply chains fractured, and the cost of everything connected to fuel — shipping, manufacturing, farming, fertiliser — began climbing simultaneously.
US Policies' Influence On Global Markets
The thread running through those three forces is the same: it is possible to avoid US markets, but not the ripple effect of US policies on global markets. Three structural links tie every market back to Washington. The dollar is the world's reserve currency. Commodities, cross-border trade and emerging-market debt are priced in it — so any position on gold, oil or an emerging-market currency carries dollar exposure by default.
The Federal Reserve sets borrowing costs for the world's largest economy, and other central banks follow — one Fed decision can influence capital flows across global markets
US trade policy can reshape rules for dozens of economies with a single signature, making Washington announcements a fkey factor influencing global market conditions.
With this landscape laid out, we explore how oil prices affect the global economy.
A single policy decision in Washington reshaped how money moves around the world. That reflects the interconnected nature of a globalised economy.
Case Study on Oil Price Volatility
The March 2026 oil shock had two causes; the first one made the second one worse.
Cause one: Venezuela was already blocked. In February 2025, the Trump administration revoked Chevron's licence to export Venezuelan crude. Further enforcement through 2025 shut Venezuela out of global markets. At the time, this just meant a tighter supply. Its real significance came later.
Cause two: The Gulf was cut off. On 28 February 2026, joint US–Israeli strikes on Iran shut down shipping through the Strait of Hormuz. Gulf oil — the world's largest supply — was suddenly stuck.
Why it mattered that both happened: Under normal circumstances, a disruption in the Gulf is cushioned by two key backup sources. The first is non-Gulf supply, such as Venezuela. The second is OPEC+ spare capacity, largely held by Saudi Arabia and the UAE. This time, both failed at once. Sanctions had already pushed Venezuela out of the market. Saudi and UAE spare capacity sat inside the Gulf, behind the same chokepoint. When the Strait of Hormuz closed, neither could compensate. Because the shortage was physical — not just fear or speculation — prices did not reverse. The oil was not just more expensive. It was also physically stuck.

In 2025 and early 2026, oil markets demonstrated how headline-driven volatility can temporarily overshadow traditional fundamental analysis. As the chart illustrates, prices frequently reacted rapidly to news events: such as tariff announcements, military escalations, and sanction shifts-often before physical supply and demand data could be fully assessed. This period highlights how geopolitical developments can trigger sudden and unpredictable price movements in either direction.

When news is driving the market, prices move on headlines before they move on supply and demand. Watching the news matters as much as watching the numbers. Here's how the shock hit different parts of the world.
The Oil Price Volatility that Hit Everywhere at Once
Most Asian oil imports from the Middle East price against Dubai crude, so when Dubai hit a record high in mid-March — well above Brent's peak — the cost flowed into the real economy, and some Asian refiners switched to pricing US imports against Brent. The impact was observed through four channels: import bills, manufacturing costs, inflation fears and currency pressure.
South Korea imports almost all its energy, and with recession fears landing at the same time, the KOSPI fell 12% on 4 March — its biggest single-day drop ever, triggering an automatic trading halt.
Japan took the sharpest cross-asset hit. The Nikkei 225 fell 13% in March — its worst month since October 2008 — the yen weakened past USD/JPY 160, and on 11 March Japan tapped 80 million barrels from its emergency reserves. and on 11 March Japan tapped 80 million barrels from its emergency reserves.
Thailand's SET fell 8% the same morning, triggering a twelve-minute halt. Power companies led the fall as fuel costs rose faster than electricity prices. The baht weakened too: higher jet fuel forced airlines to cut flights, thinning tourist dollar inflows, and Bank of America cut its baht forecast to 33 per dollar.
India imports about 88% of its oil, and sold rupees for dollars to pay the larger bill — pushing the rupee to a record low of 93.94 on 23 March and past 94 by month-end.
What this means for CFD traders:
During an oil shock, Asian stocks and currencies often move on oil — not earnings or economic data. The most oil-dependent countries show the biggest moves.
Multiple pressures hit at once — import bills, manufacturing costs, inflation fears and currency weakness all land together.
Observing the oil prices, the currency pairs (USD/KRW, USD/JPY, USD/INR, USD/THB) and the stock indexes together may provide broader context for market movements.
Get a Deeper Dive
This excerpt is just the beginning. Sign up below with just your email to unlock the full ebook and gain deeper insights into the forces shaping today's markets. No deposit or commitment is required.
You'll also receive access to a free demo account, allowing you to explore Mitrade's trading platform and put these insights into practice in a risk-free environment—without using any real capital.
Click on the button below to gain full access.

Unlock the Complete Ebook Now
Inside the ebook:
Three commodity cascades, region by region
Markets carrying the highest levels of exposure
Understanding price movements beyond the charts
The role of traders' psychology in price movements
A practical introduction to how CFD markets operate
* The content presented above, whether from a third party or not, is considered as general advice only. This article should not be construed as containing investment advice, investment recommendations, an offer of or solicitation for any transactions in financial instruments.


