Trading Chart Patterns:Ultimate Guide to Price Action

Trading can be profitable for the informed trader, like how you will be after reading this book. This book is written for anyone new to trading Stocks, Crypto, or Forex. Any prior knowledge in these financial markets is a plus.
Chart patterns are visual formations that appear on price charts (like forex, commodities, or cryptocurrencies). They are created by the movement of an asset's price over time and are a core tool in technical analysis, representing recurring formations that signal potential future price direction.
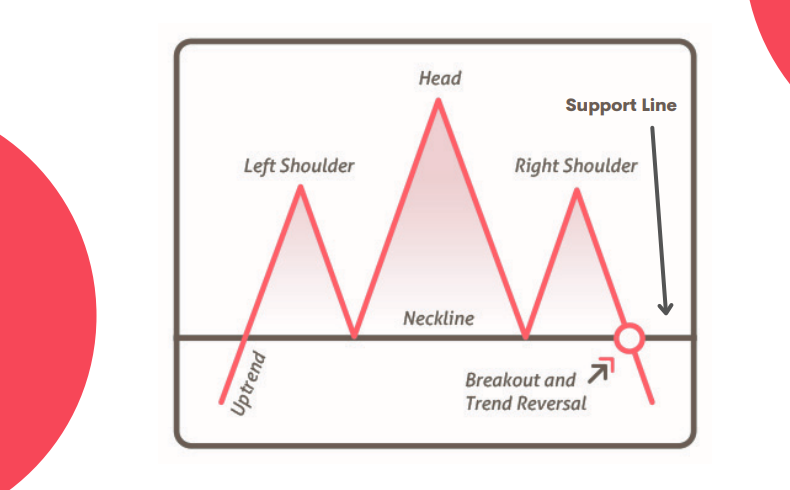
1. Head and Shoulders (Reversal)
*The Head and Shoulders pattern visually presents three peaks above a baseline (neckline), with the central peak being the tallest and the two outer peaks (shoulders) reaching similar, lower heights.
*Traders typically analyze the Head and Shoulders pattern using hourly charts, though daily charts are also commonly used.
*Traders should be aware that Head and Shoulders patterns found on live charts are seldom perfectly symmetrical or proportioned.
*The key trading signal occurs when the price decisively closes below the neckline; this breakdown prompts traders to enter short positions.
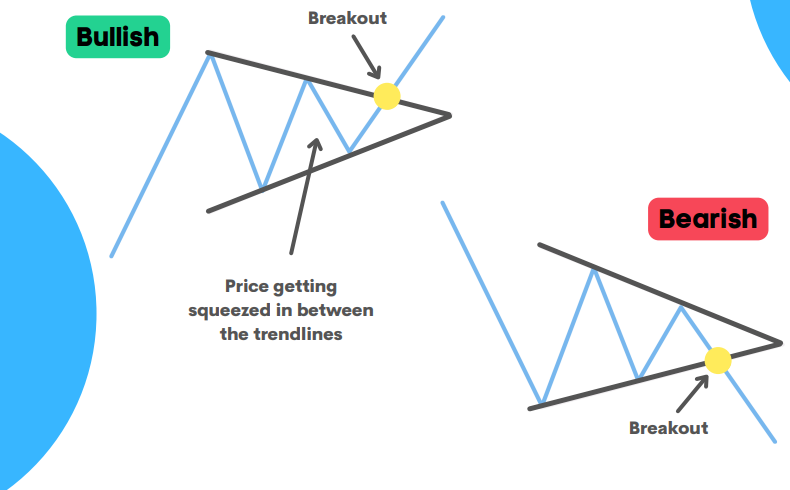
2. Symmetrical Triangle (Continuation)
*The pattern visually forms a triangle, much like the angle bracket (>) used in math.
*The trendlines gradually converge and pinch the price action tighter near the apex, indicating that a significant move up or down is becoming more probable.
*A Symmetrical Triangle pattern can develop quickly within a few hours or unfold gradually over multiple days.
*Traders typically wait for the price to decisively break above the upper trendline (breakout) or below the lower trendline (breakdown) and then enter a long position or short position accordingly.
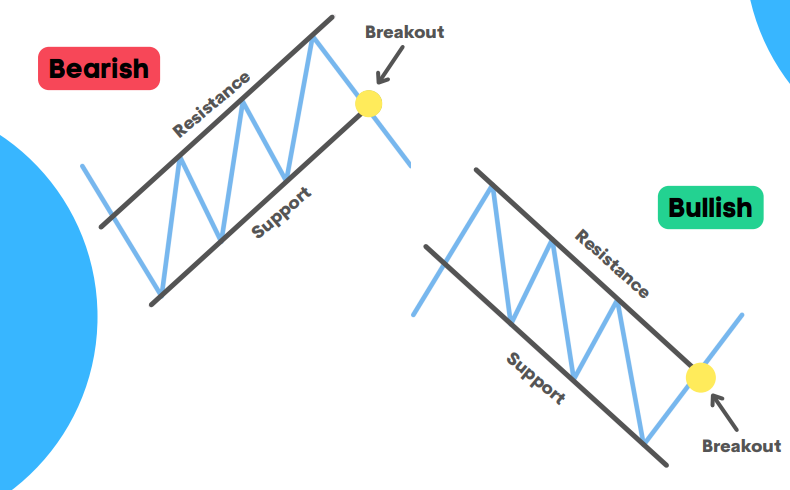
3. Price Channel (Reversal)
*This pattern consists of two parallel trendlines establishing a channel; the top line signifies resistance, the bottom signifies support, and the entire channel inclines upwards or downwards.
*Price typically remains confined within these support and resistance boundaries until a decisive breakout occurs.
*Occasionally, after breaking out, the price will pull back to test the validity of the breakout point (the former support or resistance level).
*A common trading strategy involves selling as price nears the channel's resistance (upper line) and buying when it approaches support (lower line).
Mastering the patterns discussed here is just the beginning of your technical analysis journey. There are more FREE study materials in my Discord community which would help you systematically build this critical skill set!
Join Discord for FREE study books/materials👇:
https://discord.com/invite/uC3CadmMA2
* The content presented above, whether from a third party or not, is considered as general advice only. This article should not be construed as containing investment advice, investment recommendations, an offer of or solicitation for any transactions in financial instruments.


