

USD/MXN (USDMXN) Surges on Oct 26: What Are the Key Reasons?

Source Tradingkey

USD/MXN (USDMXN) is up 0.50% at Oct 26 04:05(ET), now at $18.74655, with a 7-day up of 1.79%.
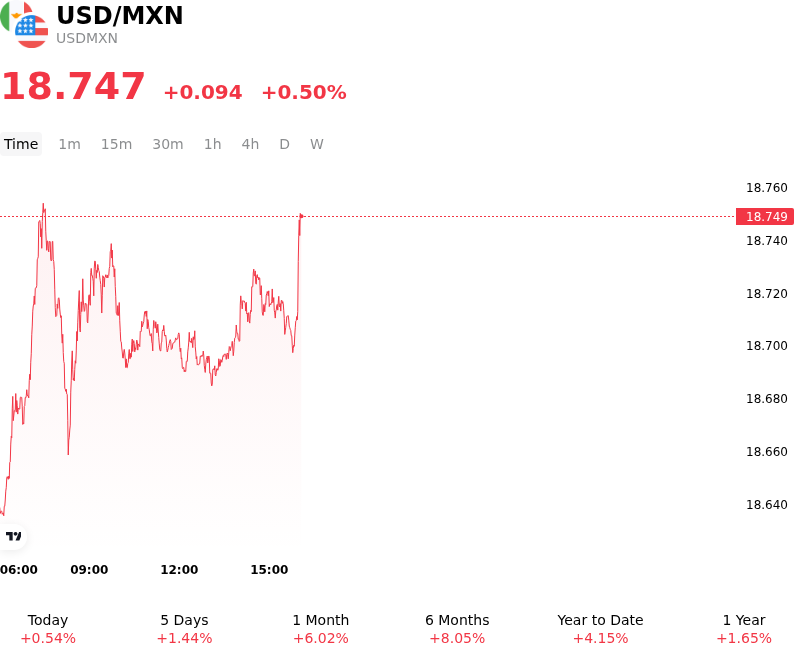
SummaryOverview

What is driving USD/MXN (USDMXN)’s stock price up today?

The upward momentum in USDMXN was primarily driven by a convergence of persistent U.S. Dollar demand and shrinking carry-trade incentives for the Mexican Peso. Resilient U.S. economic data and sticky inflation readings have reinforced expectations that the Federal Reserve will maintain an elevated policy rate structure, keeping benchmark U.S. Treasury yields firm. In contrast, Banco de México's policy stance has kept domestic rates stationary following the conclusion of its earlier easing cycle. The resulting compression in the U.S.-Mexico interest-rate differential has eroded the Peso's traditional yield advantage, prompting institutional investors to unwind long carry positions and reallocate capital into U.S. dollar-denominated assets.

Broader macro conditions further reinforced safe-haven demand for the greenback at the expense of high-beta emerging market currencies. Geopolitical tensions and elevated global borrowing costs triggered a shift toward broad risk aversion, dampening market appetite for local-currency emerging market debt. Simultaneously, persistent uncertainty regarding bilateral trade discussions and upcoming USMCA renegotiations has injected an additional risk premium into Mexican financial assets. This structural trade ambiguity, alongside cautious sentiment surrounding Mexican state energy finances, has constrained domestic asset inflows and amplified upside volatility across the currency pair.

From a macro perspective, the advance in USDMXN reflects underlying monetary divergence and risk-off capital flows rather than a short-lived technical dislocation. Technical momentum and institutional order flow indicate sustained buyer control as the pair tests key moving averages. Going forward, institutional market participants continue to monitor upcoming Federal Reserve communications, U.S. inflation data, and domestic Mexican growth trajectory to evaluate whether compressed yield spreads will sustain further upside in the exchange rate.

Technical Analysis of USD/MXN (USDMXN)

Technically, USD/MXN (USDMXN) shows a MACD (12,26,9) value of 0.018, indicating a buy signal. The RSI at 72.527 suggests buy condition and the Williams %R at 11.703 suggests overbought condition. Please monitor closely.
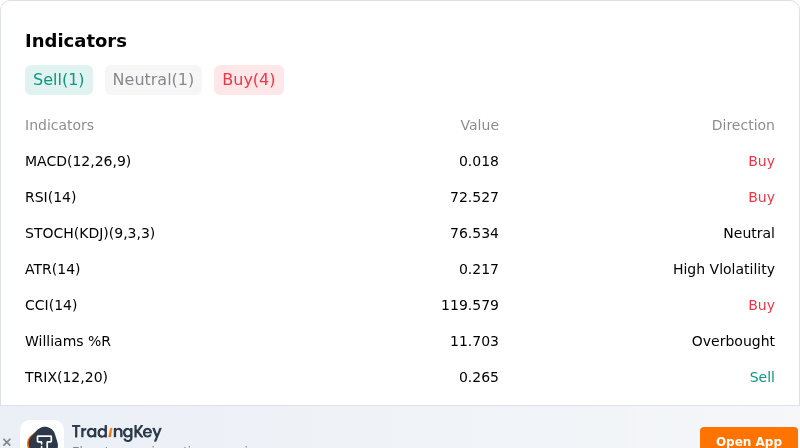
IndicatorAnalysis

More details about USD/MXN (USDMXN)

Recent Events and Risks:

  • Banxico-Fed Policy Divergence and Carry Unwind: Dovish communication from Banco de México alongside persistent Federal Reserve rate expectations has compressed the U.S.-Mexico yield differential to roughly 250 basis points, eroding the Mexican peso's carry-trade advantage and triggering institutional position unwinds.
  • Mexican Bond Yield Compression and Portfolio Outflows: Falling Mexican government bond yields, reinforced by Banxico minutes indicating board openness to future rate cuts and lingering sovereign debt concerns, have reduced institutional demand for local fixed-income assets, prompting capital reallocation into U.S. Dollar assets.
  • USMCA Frictions and Trade Policy Uncertainty: Stalled bilateral trade negotiations between the U.S. and Mexico, ongoing tariff uncertainty, and diplomatic friction regarding state-owned energy enterprise Pemex continue to add risk premiums to Mexican assets, generating abrupt intraday liquidity shocks.
  • Global Risk Aversion and Safe-Haven USD Inflows: Escalating Middle East geopolitical conflict and elevated benchmark U.S. Treasury yields have sparked broad market risk aversion, disproportionately weighing on high-beta emerging market currencies like the peso and driving defensive safe-haven demand into the U.S. Dollar.
Disclaimer: For information purposes only. Past performance is not indicative of future results.
placeholder
The Fed will sit still on October 28 — but 100 of 100 economists now expect a December hikeA Reuters poll run October 16-20 found 94 of 100 economists expecting the Fed to hold at 3.75-4.00% on October 28 — and all 100 expecting a hike in December, against less than half a month earlier. The market is close to the same price, with CME FedWatch at roughly 17% for October and 82.8% for December. With the Fed in blackout since October 17, here are the five dates that decide the rest of the year, what each one is priced for, and the two directions each can take.
Author  Irene Q.
Oct 22, Thu
A Reuters poll run October 16-20 found 94 of 100 economists expecting the Fed to hold at 3.75-4.00% on October 28 — and all 100 expecting a hike in December, against less than half a month earlier. The market is close to the same price, with CME FedWatch at roughly 17% for October and 82.8% for December. With the Fed in blackout since October 17, here are the five dates that decide the rest of the year, what each one is priced for, and the two directions each can take.
placeholder
Nasdaq closes at 26,008.86 — 8.9 points above 26,000, and the credit market never blinkedThe Nasdaq Composite fell 2.60% to 26,008.86 on October 22, its worst session since June, as Meta sank 6.98% on 2026 capex guidance of $135–145 billion. But the equal-weight S&P 500 rose 0.73%, high-yield credit was flat and 10-year yields fell 20 basis points. This was an AI de-rating, not a risk-off event — here is the transmission chain, the 29,000 / 28,200 levels and what would prove it wrong.
Author  Irene Q.
Oct 23, Fri
The Nasdaq Composite fell 2.60% to 26,008.86 on October 22, its worst session since June, as Meta sank 6.98% on 2026 capex guidance of $135–145 billion. But the equal-weight S&P 500 rose 0.73%, high-yield credit was flat and 10-year yields fell 20 basis points. This was an AI de-rating, not a risk-off event — here is the transmission chain, the 29,000 / 28,200 levels and what would prove it wrong.
placeholder
Brent tops $113 on Saudi supply risk — but the diesel line in the EIA report is the tellBrent's December contract settled at $113.17 on October 22, up 4.00% and the highest close since May 4, after Saudi Arabia restricted refined-product shipments. The same session's EIA report showed crude stocks down 3.06 million barrels and gasoline down 2.95 million — but distillates built 1.68 million. That single line decides whether $113 holds: here are the data, the 108.8 / 114.0 / 119.3 levels and the two scenarios.
Author  Irene Q.
Oct 23, Fri
Brent's December contract settled at $113.17 on October 22, up 4.00% and the highest close since May 4, after Saudi Arabia restricted refined-product shipments. The same session's EIA report showed crude stocks down 3.06 million barrels and gasoline down 2.95 million — but distillates built 1.68 million. That single line decides whether $113 holds: here are the data, the 108.8 / 114.0 / 119.3 levels and the two scenarios.
placeholder
Gold Price Analysis Today | Forex Gold Analysis | XAU/USD Analysis - October 26, 2026Get the latest gold price analysis, forex gold insights, and XAU/USD analysis for October 26, 2026. Read on for the details.
Author  Mitrade
7 hours ago
Get the latest gold price analysis, forex gold insights, and XAU/USD analysis for October 26, 2026. Read on for the details.
placeholder
Gold breaks $4,000 as oil becomes the inflation problem — $3,943 is the line that mattersSpot gold closed at $3,995.6 on October 23, down about 4.1% for the week and at its lowest since mid-July, and traded near $3,988 on October 26 even as Brent crude settled at $116.72 and Middle East supply risk stayed elevated. The war premium stopped working because oil is now the inflation trade: December Fed hike odds are 68.9% and the 10-year yield is 4.988%. Here are the three numbers, the transmission chain, and the July low at $3,943 that decides whether this is a bottom or a bigger correction.
Author  Irene Q.
2 hours ago
Spot gold closed at $3,995.6 on October 23, down about 4.1% for the week and at its lowest since mid-July, and traded near $3,988 on October 26 even as Brent crude settled at $116.72 and Middle East supply risk stayed elevated. The war premium stopped working because oil is now the inflation trade: December Fed hike odds are 68.9% and the 10-year yield is 4.988%. Here are the three numbers, the transmission chain, and the July low at $3,943 that decides whether this is a bottom or a bigger correction.
goTop
quote