


The S&P 500 May Depend on the Fortunes of These 3 Companies Right Now. Here’s the Good News and the Bad News for Investors.
Key Points
The type of company leading the S&P 500 has changed over the years, from energy and manufacturing to technology.
Tech stocks have offered the market direction in recent years.
- Motley Fool Issues Rare "Total Conviction" Buy Alert ›
The S&P 500 has always been an index offering a clear picture of the companies driving the U.S. economy, and in its earlier days, energy and manufacturing companies found themselves at the top. But this picture rapidly changed over the past decade as technology players gained momentum in earnings growth and stock performance.
A company's position leading the famous index depends on its market capitalization, and it also must be primarily owned by the public, rather than by founders, for example. Today, this puts three tech giants in the top spot -- and they are followed by several other tech powerhouses. In fact, we only start seeing companies from other industries around the 10th position. At this point, companies including Eli Lilly, Berkshire Hathaway, and Walmart broaden the index's exposure into other industries.
Missed AI’s "Act 1"? Act 2 Could Be 15x Bigger. Most investors think they missed the AI boat because they didn't buy Nvidia in 2005. But according to our analysts, we’re only at the end of "Act 1"—the R&D phase. "Act 2" is the global rollout. Continue »
Considering all of this, the S&P 500 may depend on the fortunes of the following three companies right now. Let's consider the good news and the bad news for investors.

Image source: Getty Images.
A transition at the top of the S&P 500
So, first, let's consider how this transition from energy, manufacturing, and even consumer-related companies to tech stocks dominating the S&P 500 took place. As mentioned, the index is a reflection of the businesses leading the economy, and the fast growth of tech companies, from Internet and e-commerce players to chip designers and cloud service providers, catapulted them into the driver's seat.
The last time a non-tech player was in the top three of the S&P 500 was back in 2014, and that was ExxonMobil, according to FinHacker data. The energy company was No. 2 after Apple, and these top companies' market values were in the hundreds of billions of dollars -- not in the trillions as leading S&P 500 companies are today.
As tech companies' earnings soared, investors piled in, market cap advanced, and the rest is history. This brings us to the subject of today's biggest S&P 500 companies, and they are Nvidia, Apple, and Microsoft, with weightings of about 8%, 7%, and 5%, respectively. That means that, together, they carry a weight of about 20%. Considering that fellow tech giants follow in the top 10 positions, the S&P 500 depends heavily on the fortunes of tech companies today, particularly Nvidia, Apple, and Microsoft.
Tech giants' explosive growth
This worked out well for the index and investors in recent years as tech companies delivered explosive earnings growth and the promise of more ahead thanks to their position in the artificial intelligence (AI) story. The S&P 500 has climbed nearly 100% since the start of 2023, led by tech companies.
Now, let's consider the good and bad news for investors. I'll start with the bad. This heavy weighting in tech worked to the index's advantage in recent years, but any slowdown in the AI story could do just the opposite -- and result in declines for the benchmark. As a result, investors holding S&P 500 trackers or who have heavily invested in tech stocks could face declines.
Valuations reach record highs
Some investors have worried that such a movement might be right around the corner. That's as companies' valuations have reached record levels, as we can see in the S&P 500 Shiller CAPE ratio. This is an inflation-adjusted look at stock prices in relation to earnings per share.
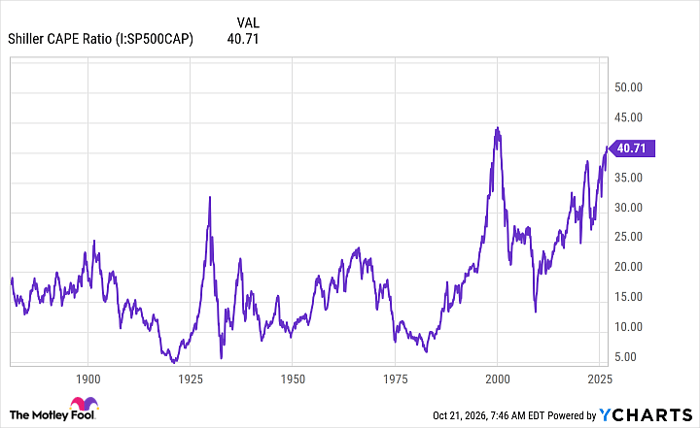
Shiller CAPE Ratio data by YCharts
Meanwhile, investors also have questioned whether the AI revenue opportunity will justify today's spending levels -- these concerns may lead to weakness in tech stock performance.
Now, let's consider the good news, and it has two parts. First, any slowdown won't necessarily be long-lasting. The S&P 500 never climbs forever uninterrupted, so a pullback would be a natural part of the market cycle, and it could last a few weeks or months. Second -- and this is the most important point of all -- the S&P 500, after every past decline, including the worst crashes, has always recovered and gone on to win. This is fantastic news for long-term investors, signaling that you, too, could score a win if you choose quality companies or an S&P 500 tracker and hold on for the long term.
Should you buy stock in S&P 500 Index right now?
Before you buy stock in S&P 500 Index, consider this:
The Motley Fool Stock Advisor analyst team just identified what they believe are the 10 best stocks for investors to buy now… and S&P 500 Index wasn’t one of them. The 10 stocks that made the cut could produce monster returns in the coming years.
Consider when Netflix made this list on December 17, 2004... if you invested $1,000 at the time of our recommendation, you’d have $350,756!* Or when Nvidia made this list on April 15, 2005... if you invested $1,000 at the time of our recommendation, you’d have $1,363,905!*
Now, it’s worth noting Stock Advisor’s total average return is 922% — a market-crushing outperformance compared to 213% for the S&P 500. Don't miss the latest top 10 list, available with Stock Advisor, and join an investing community built by individual investors for individual investors.
See the 10 stocks »
*Stock Advisor returns as of October 23, 2026.
Adria Cimino has no position in any of the stocks mentioned. The Motley Fool has positions in and recommends Apple, Berkshire Hathaway, Eli Lilly, Microsoft, Nvidia, and Walmart. The Motley Fool has a disclosure policy.
Recommended Articles


