


Gold Price Analysis Today | Forex Gold Analysis | XAU/USD Analysis - October 22, 2026


Today's Gold Price
Gold price chart for today
*0% Commission and Low Spreads 0️⃣
*$50,000 in Free Virtual Funds 💰
*$100 New Customer Bonus 🎁
Gold (XAU/USD) traded around $4,125 on the morning of October 22, 2026, attempting to rebound and build a base above key support after Brent crude pulled back to $108.82 and U.S. Treasury yields began to slow their rise. But surging U.S. equities and the Fed-rate outlook continue to cap the rebound. The key question is whether gold can hold above $4,104–4,113 and break through first resistance at $4,150–4,159.
Today's Key Points
| Key Points |
|
|
|
Lower crude prices support a gold rebound, but surging U.S. stocks and Fed rates still cap gains
Spot gold rebounded to finish in positive territory late in the U.S. session before holding around $4,125 this morning, supported by a weaker dollar and lower crude prices. WTI closed at $97.15 per barrel, while Brent retreated to $108.82 as diplomatic talks were pursued in the Strait of Hormuz. Although no agreement has been reached, this has eased near-term inflation panic and helped Treasury yields stabilize.
But gains in gold remain capped by the rally in U.S. equities, which is drawing speculative money away from safe-haven assets, while markets worry the Fed may keep rates high for longer. The Fed is now in its pre-meeting blackout period. Markets will therefore watch jobless claims tonight and PMI data and the University of Michigan confidence survey on Friday to assess the interest-rate outlook.
Gold versus oil: One ounce buys 38 barrels, down from last year but still double the historical average
GoldSilver.com reported that one ounce of gold currently buys 38 barrels of Brent crude, down from 67 barrels at the same time last year after Brent surged 78% to $108.79. This reduced gold's purchasing power against oil by 44% over one year.
But compared with data since 1986 from Eco3min Research, the long-term median is 18.5 barrels per ounce. The current level of 38 barrels therefore remains double the historical average, showing that gold continues to preserve value and strength exceptionally well against global energy costs over the long term.
BlackRock says gold reflects the public-debt crisis; gold-mining shares are again a strong leveraged play
Evy Hambro, a senior executive at BlackRock, said gold will continue rising to reflect the fragility of the financial system, including surging public debt and budget deficits. Government bond markets are sending a warning that investors are starting to demand higher yields to compensate for the risk of lending to governments.
Hambro stressed that real assets such as gold are an excellent wealth-preservation tool over decades. He added that gold-mining shares are again delivering leveraged returns over bullion as profit margins expand significantly while production costs begin to stabilize.



Technical Analysis of Gold (XAU/USD)
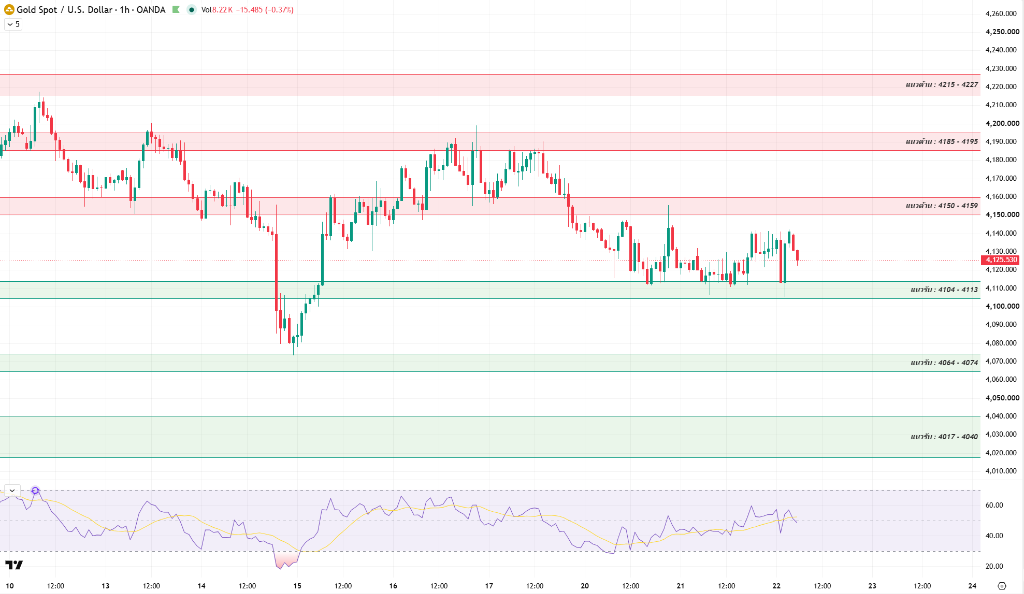
On the 1-hour chart, gold is holding around $4,125.53, with a clear slowdown in selling pressure after strongly holding above first support at $4,104–4,113. A rising base and higher low are helping the short-term structure recover from the correction.
The RSI has risen to around 53–55 and crossed above its average, indicating that buying is starting to return. But price remains below major moving-average resistance, so the recovery is still a rebound testing a key barrier.
The key decision point is reclaiming the $4,150–4,159 resistance zone. A break through on heavy trading volume would confirm a price reversal; failure would leave prices likely to consolidate within the existing range.
If prices hold above support at $4,104–4,113 and break through $4,150–4,159, they could recover toward $4,185–4,195 and major resistance at $4,215–4,227. But if they break below first support, they risk a correction toward $4,064–4,074 and $4,017–4,040.
Today's Gold Price Outlook
| Scenarios |
|
|
|
Today's Trading Strategy
Short-term traders should trade the range cautiously, watch the response around key support and resistance levels, and avoid chasing short positions near support where buying has begun to provide a cushion.
- Buy setup: Consider a position if prices pull back to the $4,104–4,113 support zone and show clear support, or follow a break and hold above $4,159, targeting $4,185–4,195 with a stop-loss below $4,095.
- Sell setup: Consider a position if prices rebound to test resistance at $4,150–4,159 or $4,185–4,195 and fail, or on a break below $4,104, targeting $4,064–4,074 with a stop-loss above resistance.
For long-term investors, structural factors from public debt and BlackRock's outlook continue to support gold. Consider gradually accumulating only after a pullback establishes a base above major support at $4,064 or $4,017–4,040.
Daily Support and Resistance Levels
| Type | Price Level |
| Support #1 | $4,104–4,113 |
| Support #2 | $4,064–4,074 |
| Support #3 | $4,017–4,040 |
| Resistance #1 | $4,150–4,159 |
| Resistance #2 | $4,185–4,195 |
| Resistance #3 | $4,215–4,227 |
Today's Questions (FAQ)
How do lower crude prices affect gold prices at present?
They ease near-term inflation concerns, slow the rise in Treasury yields and create room for gold to recover. On the other hand, they also reduce some demand for gold as a safe-haven asset.
Why does BlackRock believe the public-debt crisis will support gold and gold-mining shares?
Rising debt and budget deficits make investors concerned about currency debasement, prompting them to hold real assets to protect wealth, while mining shares benefit from notably expanding profit margins.
Read more
The above content was completed with the assistance of AI and has been reviewed by an editor.


