


Crude Oil Price Forecast: Brent Hits 7-Month High of $93 as Citi Warns 70-Day Inventory Buffer Line Approaches
TradingKey - Brent crude futures rose to touch $93 a barrel, up 1.41% on the day to hit a new high since July 24. Since August 5, Brent crude prices have surged over 20%. Currently, renewed geopolitical tensions, coupled with accelerating global inventory drawdowns, are heightening market divergence over crude oil price trends.
Geopolitics: US Imposes "Harshest Sanctions in History" on Iran
U.S. Treasury Secretary Scott Bessent said Thursday that Washington will impose the "toughest sanctions in history" on Iran. The statement echoed President Donald Trump's threat on Wednesday to deliver a devastating economic blow to Iran.
However, Bessent also signaled a relatively softer stance, stating that a resumption of large-scale military action against Iran is unlikely as the U.S. intensifies economic pressure. He noted that oil prices should move lower, given that Washington currently relies on sanctions rather than military force to deal with Iran.
Diplomatic Failure Is Being Priced Back Into Oil Prices
Janiv Shah, vice president of oil market analysis at Rystad Energy, said: "With few signs of diplomatic progress in the conflict, the oil market is once again pricing in diplomatic failure."
He emphasized, however, that greater pressure is actually being felt in the refined products sector: "Fears of supply shortages, sustained demand, and inadequate inventory buffers have pushed diesel crack spreads to record highs."
Looking ahead, Janiv Shah noted: "While Brent crude prices may fluctuate significantly based on the aforementioned scenarios, we expect the refined products market to be more significantly impacted, with refinery capacity constraints and energy security concerns keeping refined product crack spreads and margins elevated."
Inventory Destocking: Citi Warns 70-Day Safety Line Approaching
Citi noted that the U.S.-Iran conflict and disruptions in the Strait of Hormuz led to a cumulative drawdown of approximately 519 million barrels in global observable inventories between February and August 2026, averaging a daily draw of 3 million barrels. Extrapolating at this pace, Citi provided a tiered timeline for days of inventory cover.
OECD countries could fall to around 70 days as early as the end of 2027; global inventories excluding China are expected to reach this level by mid-2028; and overall global inventories are projected to hit the critical threshold in the first quarter of 2029.
The 70-day threshold serves as an important historical benchmark. Citi pointed out that this level is comparable to the inventory lows during the second oil crisis in the 1970s and 1980s. At that time, energy expenditures accounted for approximately 8% of GDP, which translates to a composite landed price of over $200 per barrel, compared with current prices of around $120 per barrel. Meanwhile, signs of localized crises have already emerged in refined products such as diesel, and market concerns over the current situation are escalating.
Crude Oil Price Forecast: Citi Expects Brent to Fall Back to $60 Next Year
Despite tight short-term supply and demand, Citi's base case scenario still assumes a negotiated agreement and the reopening of the Strait of Hormuz in the fourth quarter, and projects that Brent crude prices will fall back to the $60 range by 2027.
Overall, the current trajectory of crude oil prices depends on two main threads: first, whether the geopolitical situation can move from "sanctions pressure" to "diplomatic easing"; second, whether the rate of inventory drawdown can be contained before reaching the 70-day safety line.
Looking at the Brent crude candlestick chart, the price sits between the 0.618 Fibonacci retracement level ($92.37) and the 0.786 Fibonacci retracement level (approx. $96.19). Having not yet broken through the key overhead resistance, it is in a resistance confirmation stage following a strong rally.
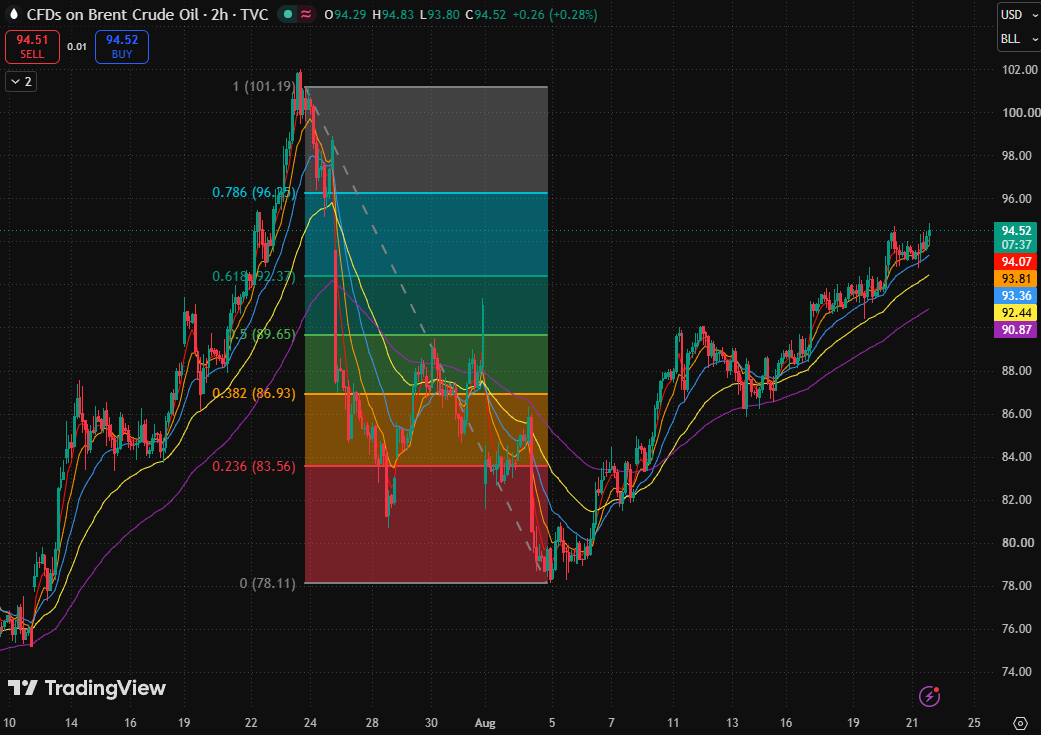
Brent Crude, Source: TradingView
After halting its decline near $78.11, crude oil gradually formed an ascending structure with higher highs and higher lows. Recently, prices have moved upward along moving averages with relatively limited pullbacks, keeping the bulls in control.
Prices are currently standing above the 5-day moving average ($94.07), 10-day moving average ($93.81), 20-day moving average ($93.36), 40-day moving average ($92.44), and 80-day moving average ($90.87), with the moving averages showing a bullish alignment overall.
If prices can subsequently break out effectively and hold above the 0.786 Fibonacci retracement level (approx. $96.19), there is potential for further breaking through the resistance level near the previous high ($101.19).
However, current prices are already close to the high of the previous rally. If an effective breakout cannot be achieved, the short term may shift from an upward trend to high-level consolidation, pulling back to test the 5-day moving average ($94.07) and the 10-day moving average ($93.81). Going forward, close attention should be paid to whether key support can hold during the post-breakout pullback.
Recommended Articles


