


US Dollar Index Price Forecast: Likely extend advance to near 103.00
- The US Dollar drops as US bond yields fall after an extended weekend.
- Investors see strength in US Dollar due to strong US growth prospects, high inflation and hawkish Fed bets.
- The US CPI and PPI data for September is awaited.
The US Dollar (USD) trades lower against its major currency peers on Tuesday due to lower United States (US) Treasury Yields.
US Dollar Price Today
The table below shows the percentage change of US Dollar (USD) against listed major currencies today. US Dollar was the weakest against the Swiss Franc.
| USD | EUR | GBP | JPY | CAD | AUD | NZD | CHF | |
|---|---|---|---|---|---|---|---|---|
| USD | -0.22% | -0.14% | -0.22% | -0.11% | -0.06% | -0.15% | -0.23% | |
| EUR | 0.22% | 0.07% | -0.04% | 0.11% | 0.13% | 0.06% | -0.02% | |
| GBP | 0.14% | -0.07% | -0.08% | 0.00% | 0.06% | -0.02% | -0.08% | |
| JPY | 0.22% | 0.04% | 0.08% | 0.12% | 0.17% | 0.07% | 0.01% | |
| CAD | 0.11% | -0.11% | -0.00% | -0.12% | 0.05% | -0.05% | -0.11% | |
| AUD | 0.06% | -0.13% | -0.06% | -0.17% | -0.05% | -0.08% | -0.16% | |
| NZD | 0.15% | -0.06% | 0.02% | -0.07% | 0.05% | 0.08% | -0.06% | |
| CHF | 0.23% | 0.02% | 0.08% | -0.01% | 0.11% | 0.16% | 0.06% |
The heat map shows percentage changes of major currencies against each other. The base currency is picked from the left column, while the quote currency is picked from the top row. For example, if you pick the US Dollar from the left column and move along the horizontal line to the Japanese Yen, the percentage change displayed in the box will represent USD (base)/JPY (quote).
In the early European trade, the US Dollar Index (DXY), which gauges the Greenback’s value against six major currencies, is down 0.17% to near 102.38. Still, the DXY is close to its fresh yearly high of 102.61 posted on Monday. 10-year US bond yields trade 0.85% lower to near 5.20% after an extended weekend. US bond markets were closed on Monday due to Columbus Day.
Market experts argue that the outlook of the US Dollar remains strong on the back of strong domestic growth, elevated inflationary pressures, and hawkish Federal Reserve (Fed) expectations.
Analysts at ING observe that FX markets are largely looking through recent noise and "preferring to concentrate on the cyclical story of decent US growth, above-target inflation and the prospect of the Fed hiking 75bp from current levels."
On the economic data front, investors await the US Consumer Price Index and the Producer Price Index (PPI) data for September, which will be released on Wednesday and Thursday, respectively. The data is expected to influence Fed’s interest rate expectations significantly. Fed officials have explicitly told that inflation concerns remain heightened and more interest rate hikes are needed to contain them.
Hammack leans hawkish as Fed rhetoric flags risk of entrenched inflation mindset
Fed’s Hammack delivers a notably more hawkish tone, with the 8.4/10 FXS Speechtracker score standing well above the 7.5/10 historical average, underscoring a stronger push for tighter policy relative to the established baseline. The emphasis on the need for higher interest rates, a restrictive stance to achieve 2% inflation, and concern over an emerging inflationary mindset—amid neutral financial conditions and broad, demand-driven price pressures including from AI—signals a preference for swift, smaller rate moves to prevent inflation expectations from drifting. Hammack’s focus on clarifying the reaction function and warning that firms are planning price hikes beyond input costs reinforces the message that the Fed should act proactively to avoid inflation becoming ingrained.
The FXS Fed Sentiment Index rose by 0.59 points to 138.92, firmly in hawkish territory and consistent with the elevated FXS Speechtracker score. This move higher reflects a clear shift toward tighter policy rhetoric, reinforcing expectations that the Fed will prioritize containing inflation over supporting growth in the near term.
US Dollar Index Technical Analysis
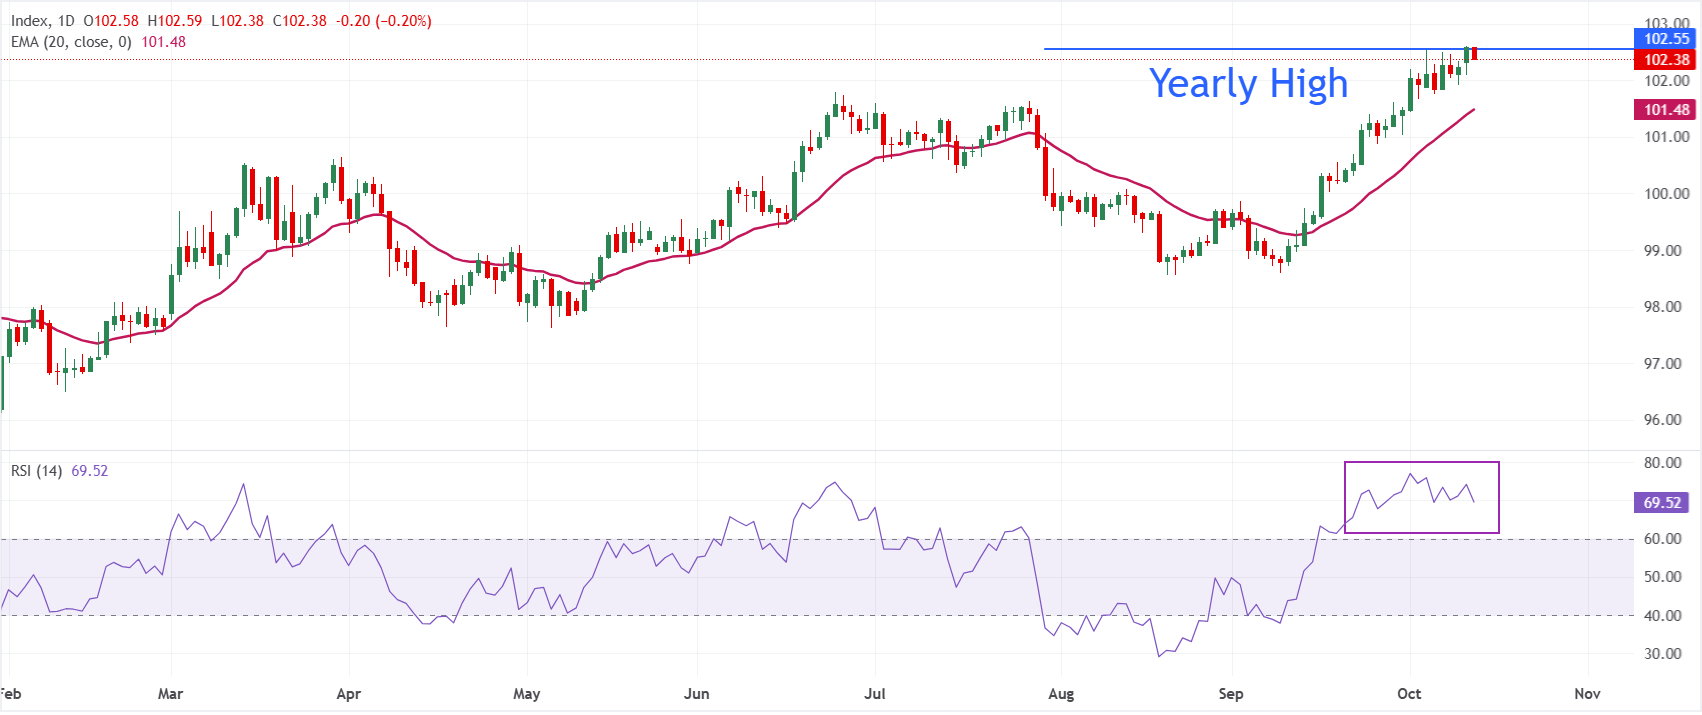
In the daily chart, Dollar Index Spot trades at 102.38. Price holds above the 20-day exponential moving average (EMA) at 101.48, keeping the near-term bias bullish as the index extends its recovery from the sub-100 area. The Relative Strength Index (14) stands around 69, flirting with overbought territory and hinting that upside momentum is strong but increasingly stretched.
On the downside, the 20-day EMA near 101.48, where buyers are likely to defend the prevailing uptrend on any pullback. Looking up, the asset could rise to the 103.00 if it decisively breaks above the fresh yearly high at 102.61.
(The technical analysis of this story was written with the help of an AI tool. Know more.)
Economic Indicator
Consumer Price Index (YoY)
Inflationary or deflationary tendencies are measured by periodically summing the prices of a basket of representative goods and services and presenting the data as The Consumer Price Index (CPI). CPI data is compiled on a monthly basis and released by the US Department of Labor Statistics. The YoY reading compares the prices of goods in the reference month to the same month a year earlier.The CPI is a key indicator to measure inflation and changes in purchasing trends. Generally speaking, a high reading is seen as bullish for the US Dollar (USD), while a low reading is seen as bearish.
Read more.Next release: Wed Oct 14, 2026 12:30
Frequency: Monthly
Consensus: 3.7%
Previous: 3.4%
Source: US Bureau of Labor Statistics
The US Federal Reserve (Fed) has a dual mandate of maintaining price stability and maximum employment. According to such mandate, inflation should be at around 2% YoY and has become the weakest pillar of the central bank’s directive ever since the world suffered a pandemic, which extends to these days. Price pressures keep rising amid supply-chain issues and bottlenecks, with the Consumer Price Index (CPI) hanging at multi-decade highs. The Fed has already taken measures to tame inflation and is expected to maintain an aggressive stance in the foreseeable future.
Recommended Articles


