


【Daily Brief】Gold rebounds 1% off a two-month low, Nasdaq drops 1.25% and yields ease — the storm premium keeps WTI near $91


Mitrade Insights — Three moves frame Friday's session: gold trades at $4,174, up nearly 1% from a two-month low, the Nasdaq led Thursday's US session lower with a 1.25% drop, and the 10-year Treasury yield eased to 5.23% after a week spent pressing multi-decade highs. The through-line is the same one that has run all week — the long end of the bond market — with one addition from the physical world: Hurricane Isaias has shut in about a quarter of US Gulf oil output, holding WTI near $91.
The rates picture: the long end finally paused
The 10-year Treasury yield closed Thursday at 5.231% and the 30-year at 5.606% — both below Wednesday's print, when the 30-year touched 5.732%, its highest since 2002. It is a pause, not a reversal: the Fed's September minutes, released this week, showed officials saw no urgency to move at the 27-28 October meeting, while Governor Waller said more hikes are needed "but there is flexibility about the pace" (Reuters). The minutes also showed most officials backing one more increase by year-end — not a run of consecutive hikes. Futures still lean toward a December increase over an October one — the 8-9 December meeting remains the live one.
Everything rate-sensitive is trading off that single number. When the 30-year backed off its high, gold and growth stocks got their first breathing room in two weeks. The move remains concentrated at the long end — more a fiscal and inflation-premium story than a growth story — and the dollar is expressing the same pause: the index holds just under 102 (101.99), its four-week advance stalled below resistance (StoneX).
Equities: a split US session, and it is a rates story
| Index | Close (8 Oct) | Change |
|---|---|---|
| Dow Jones Industrial Average | 51,231.64 | +51.77 (+0.10%) |
| S&P 500 | 7,765.36 | −36.41 (−0.47%) |
| Nasdaq Composite | 27,193.34 | −345.35 (−1.25%) |
The split is the point. Value and old-economy names held the Dow up while tech led the S&P 500 and Nasdaq lower — the same sensitivity to discount rates that has driven the week. The S&P 500 CFD trades near 7,782 in Asia, still inside its three-week 7,600 ~ 7,800 range.
Asia split the difference on Friday. Japan's Nikkei 225 fell to 68,431, down 0.9% on the day and more than 3% from Monday — tech-heavy Japan tracking the US move — while Hong Kong's Hang Seng rebounded 1.1% to 24,054 and Australia's S&P/ASX 200 added about 0.5% to 8,703. Commodity-linked markets held up better than the semiconductor complex, another expression of the same rates signal.
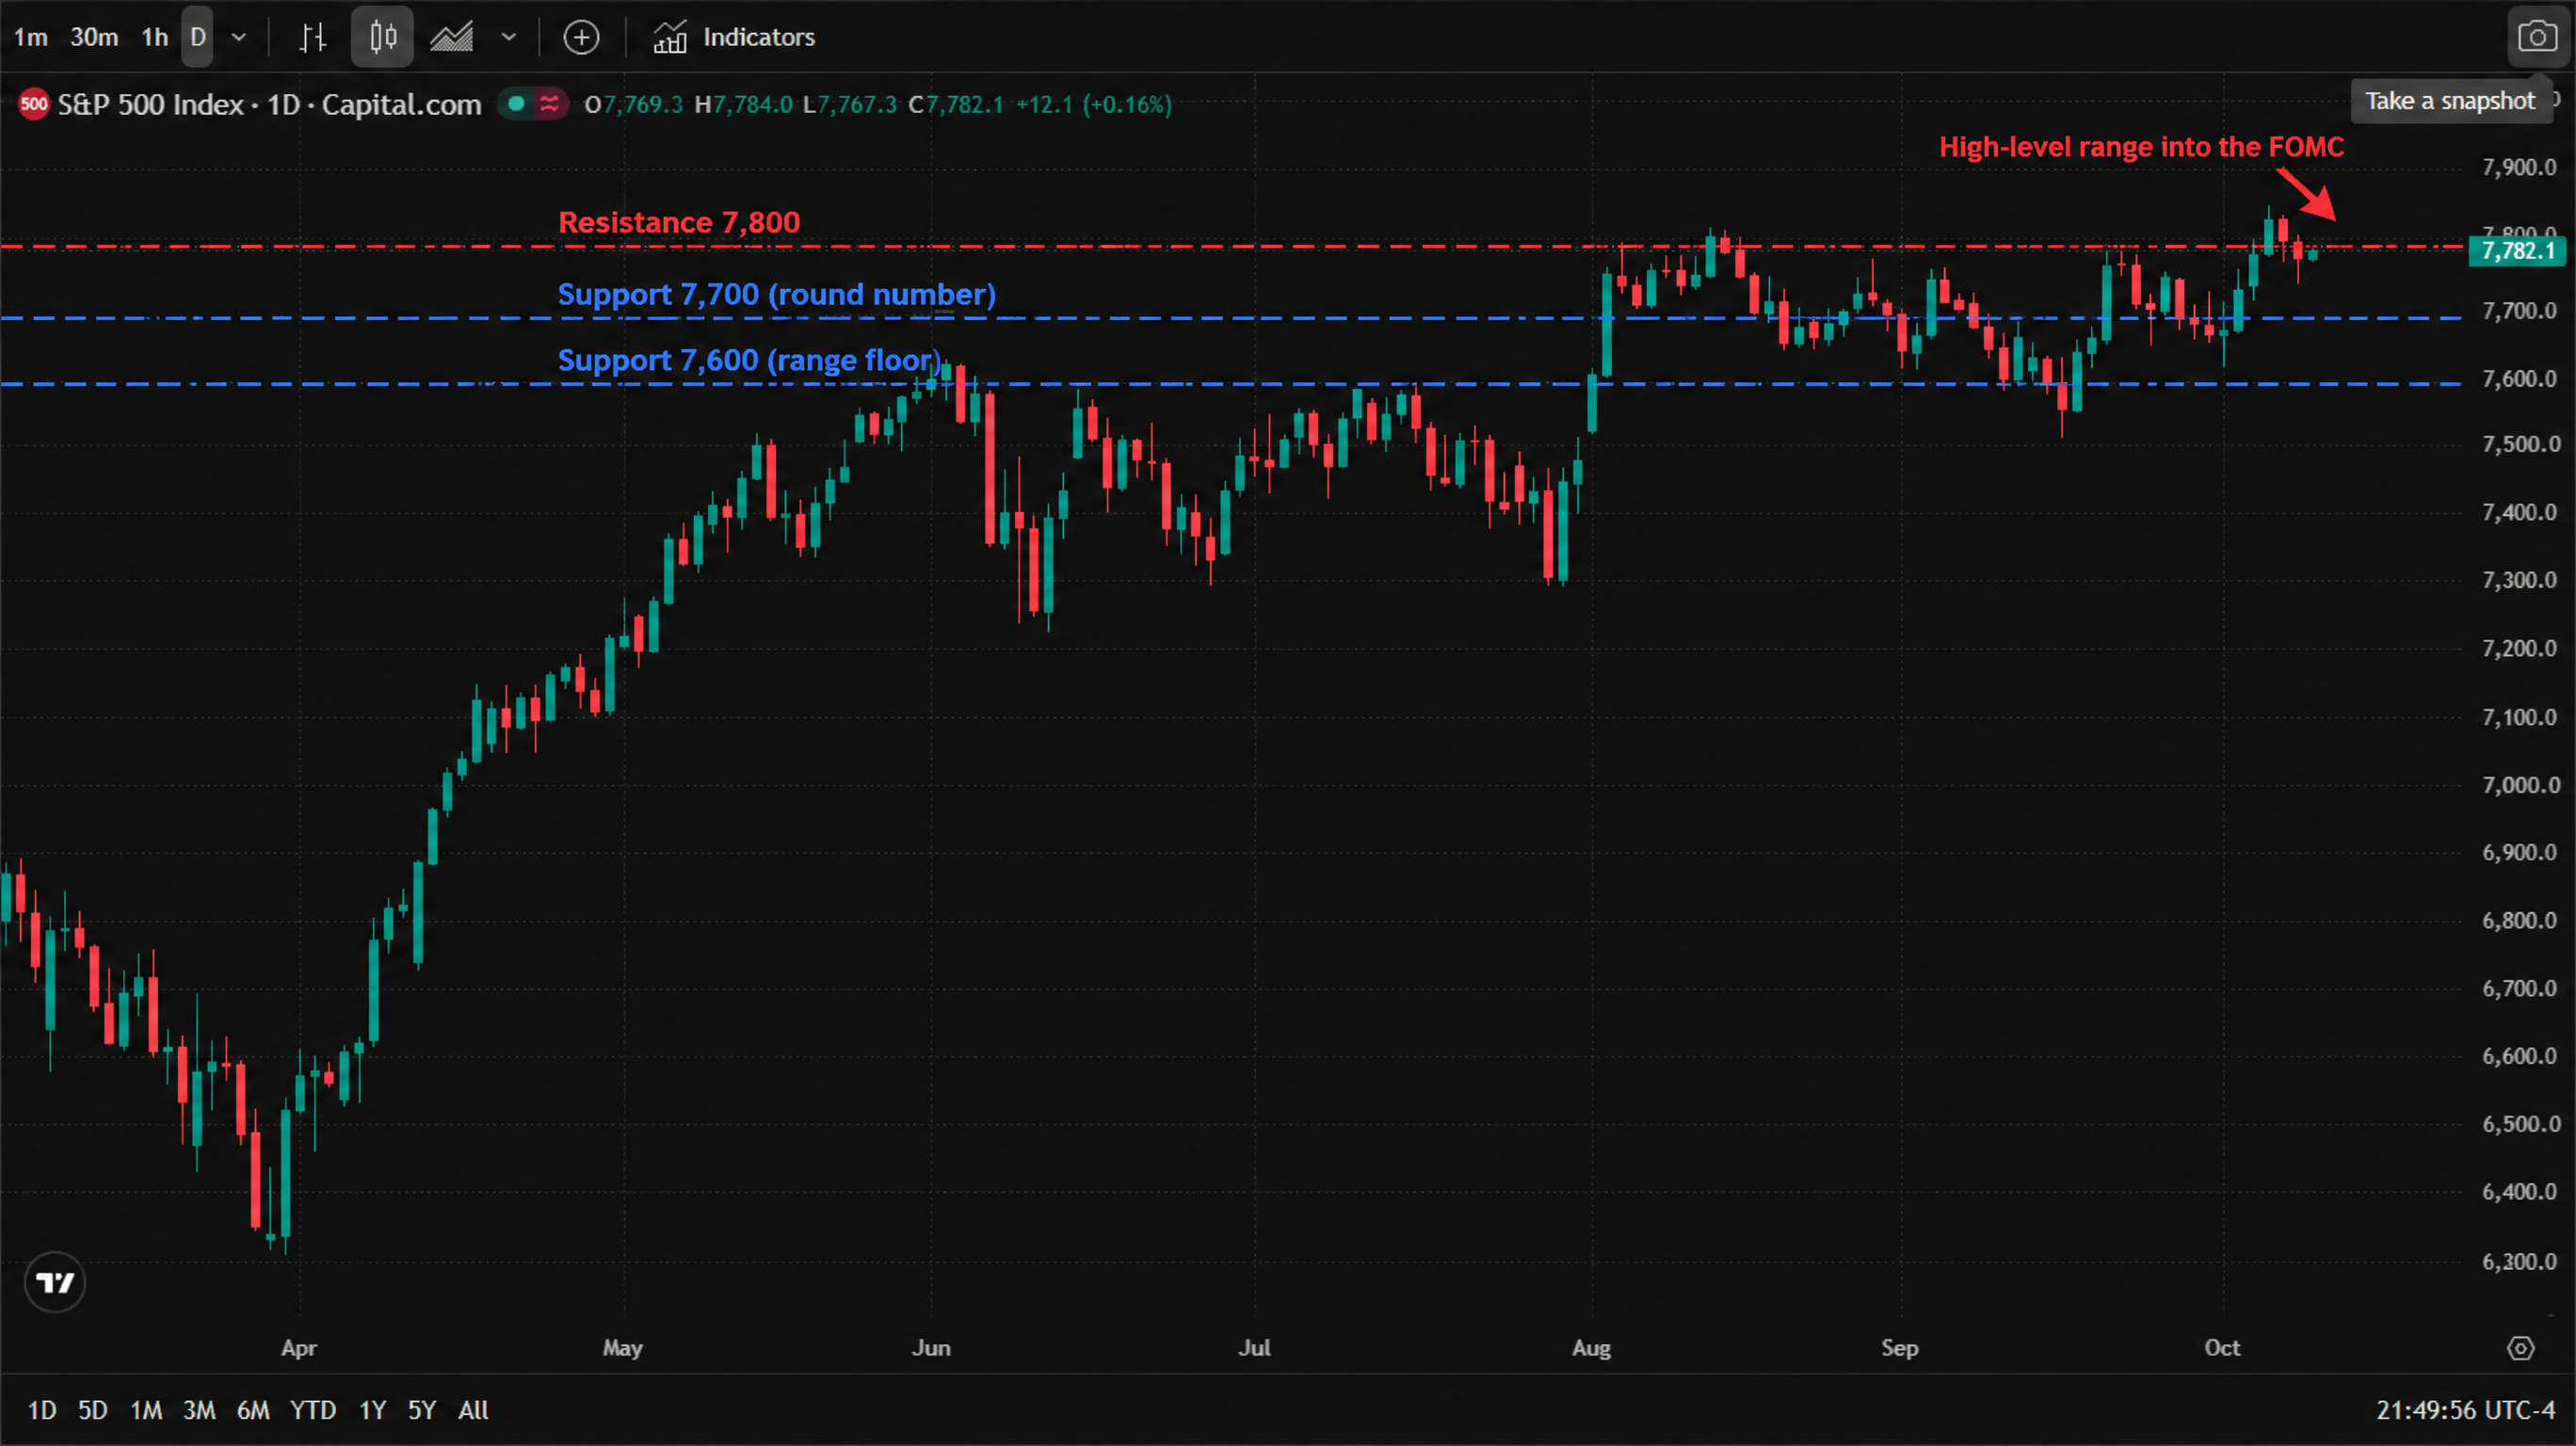
* Chart source: TradingView official chart screenshot, data source Capital.com (S&P 500 Index).
Gold: the rebound from the low, and why it can last longer than a headline
Spot gold trades at $4,174 an ounce (+0.98%), rebounding from Wednesday's ~$4,090 low — a two-month low that was itself the direct product of the 30-year yield's 5.732% spike. Two forces now work in gold's favour: the long end easing, and physical demand returning after China's Golden Week holiday, with the Shanghai premium having risen to a three-month high entering the buying season. Silver holds near $60 after dipping below it on Wednesday.
The honest framing: gold's pricing anchor is the real yield — nominal rates minus inflation expectations. The pause in the long end is what a bounce needs; a renewed push toward 5.7% is what ends it.
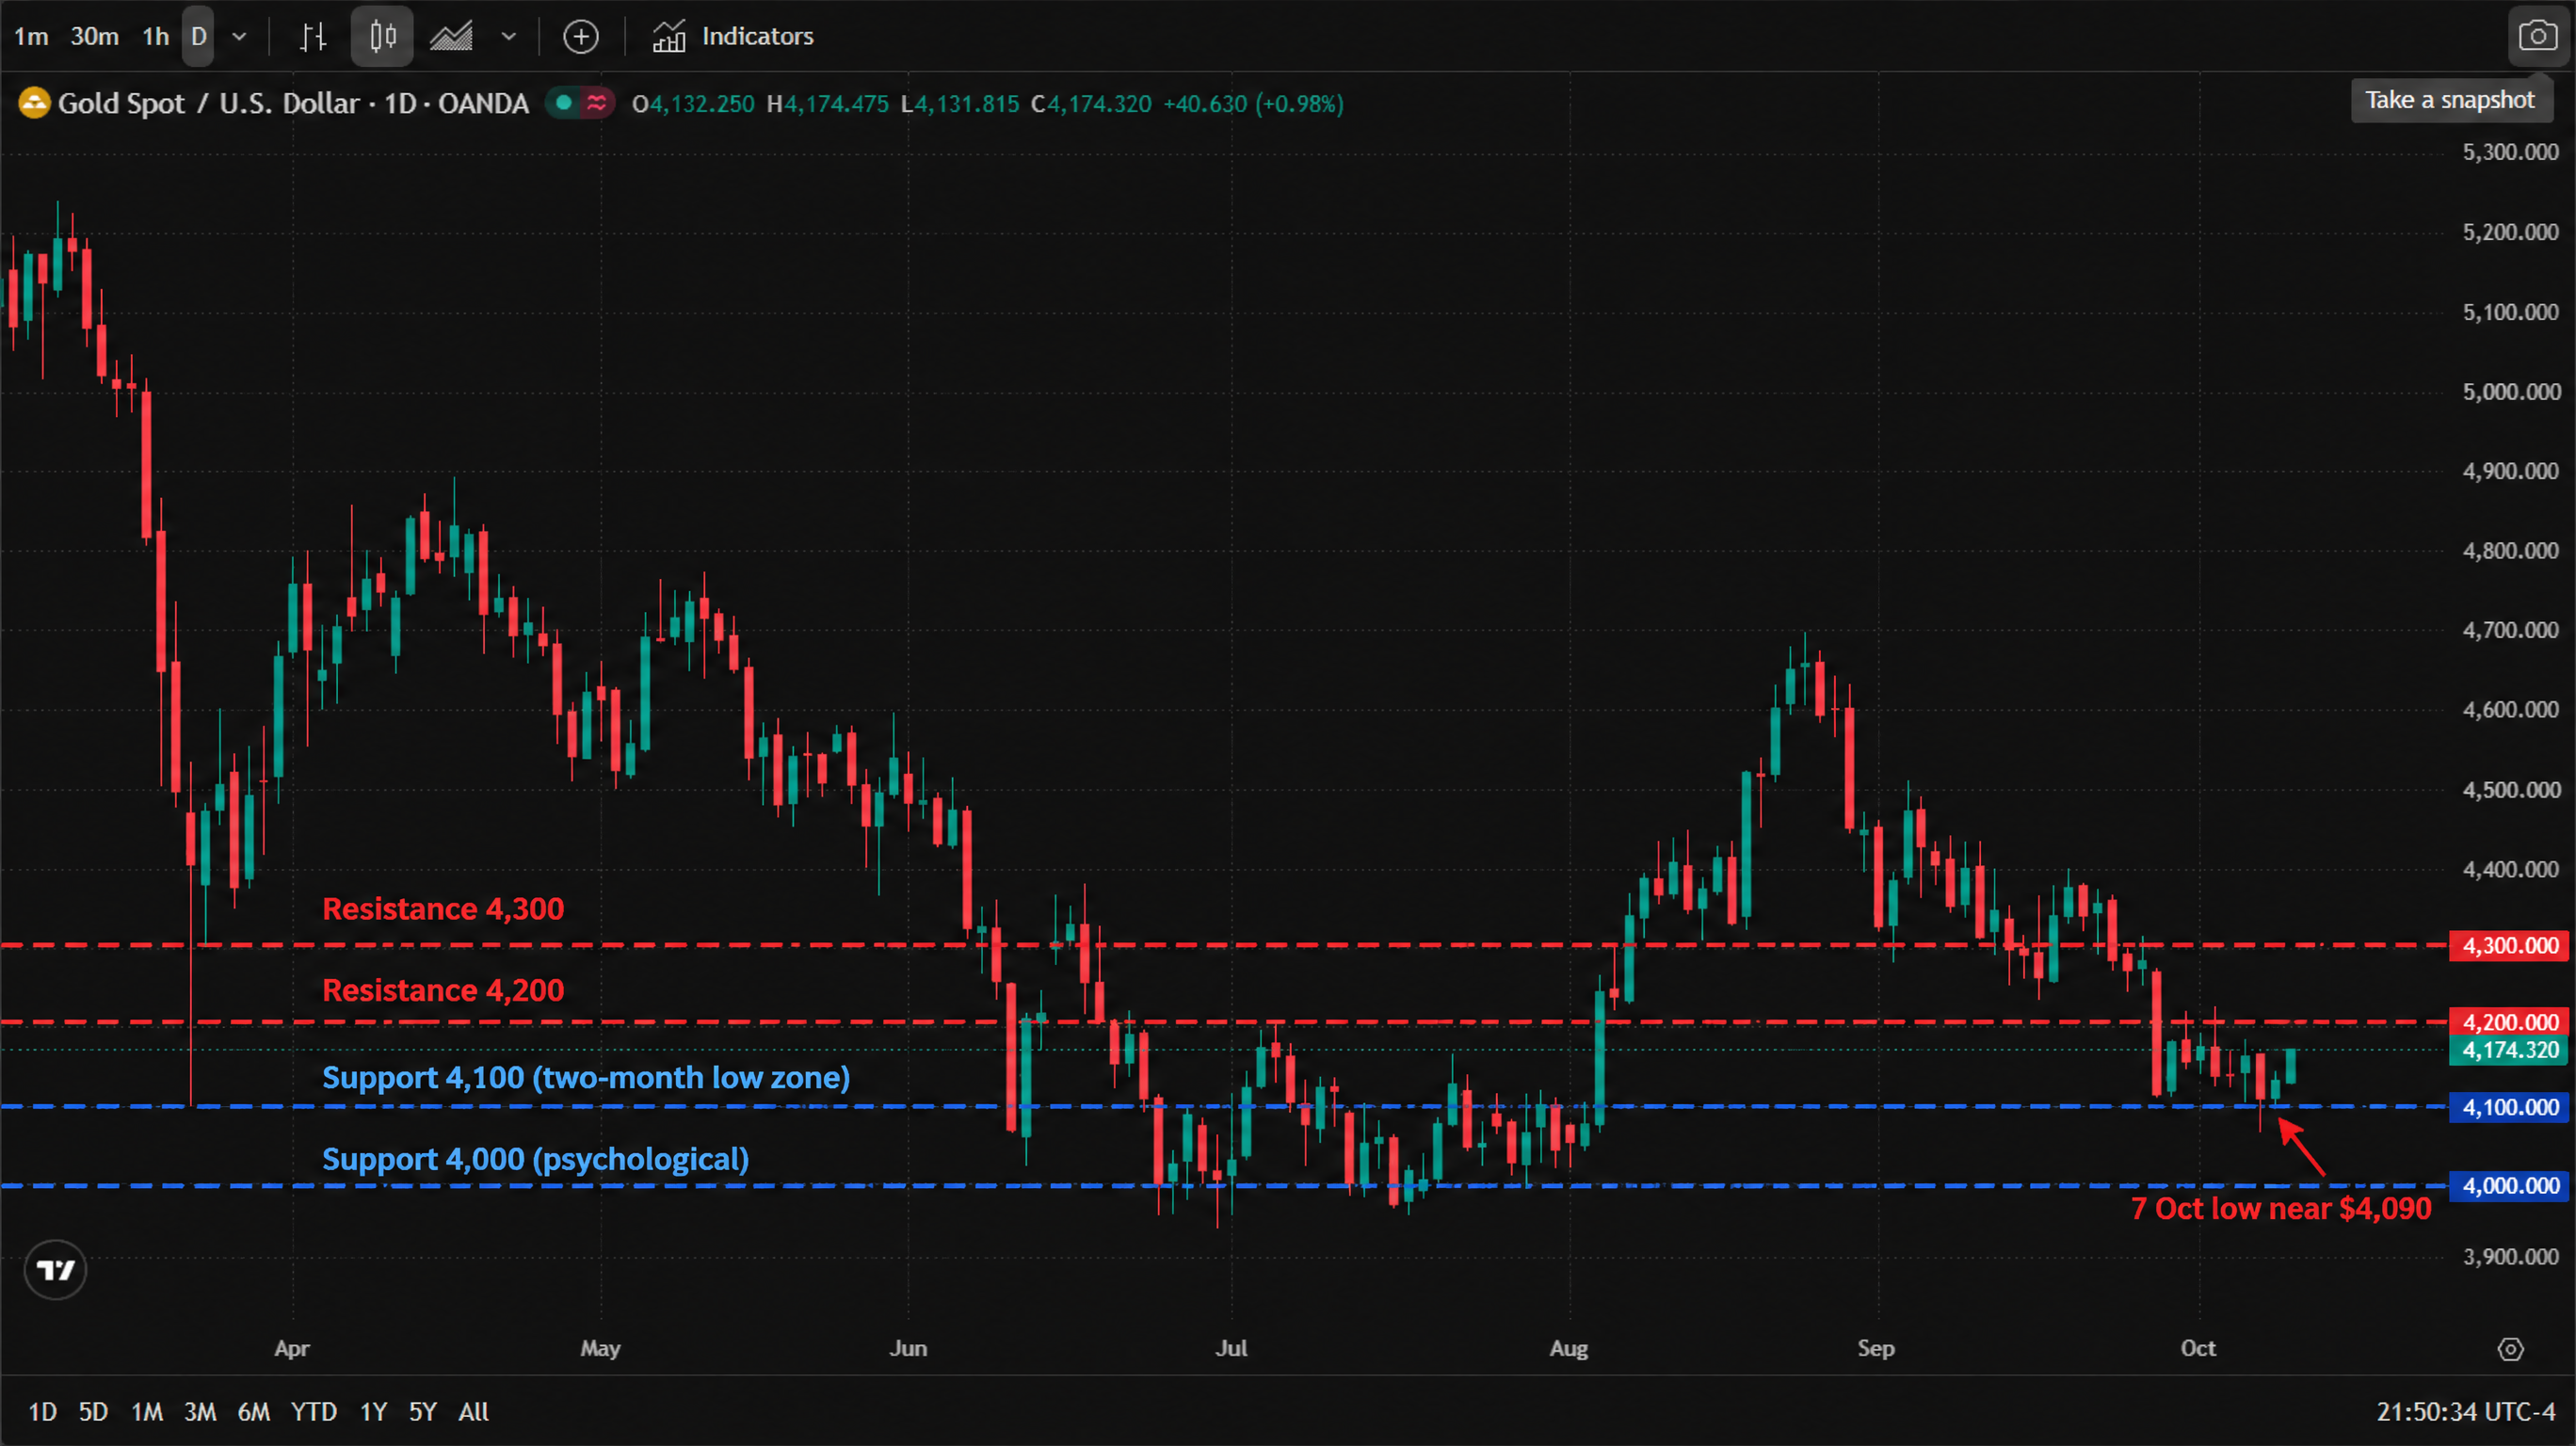
* Chart source: TradingView official chart screenshot, data source OANDA (spot gold).
Oil: the storm premium, and the date that sizes it
WTI holds near $91 (trading at $90.80 after Wednesday's $87.96 low) and Brent at $103.41, with about 25% of current Gulf of Mexico production shut in as Hurricane Isaias — the season's first, now a Category 2 — approaches the coast, and Shell and Chevron among producers curtailing operations. The first official data on the disruption comes with the EIA weekly petroleum report on Thursday 15 October, covering the week ending 9 October. Brent's own structure mirrors WTI's: $104 is the line still capping the rebound, with $100 the round-number support beneath it.
A note on benchmarks: front-month futures, expiring contracts and CFD feeds can differ by a few dollars per barrel. All levels here use the CFD benchmarks shown in the charts. *
Crypto: still the most rate-sensitive asset on the board
Bitcoin trades at $81,878, holding below the $82,000 line and roughly 4.5% below its level a week ago, after a slide that liquidated about $550 million in leveraged positions across the market this week. The mechanism matches the equities story: with the 10-year at 5.23%, the discount rate applied to a long-duration, no-cash-flow asset stays punishingly high. Crypto will keep trading as a high-beta expression of the same rates trade until the Fed's path is clearer.
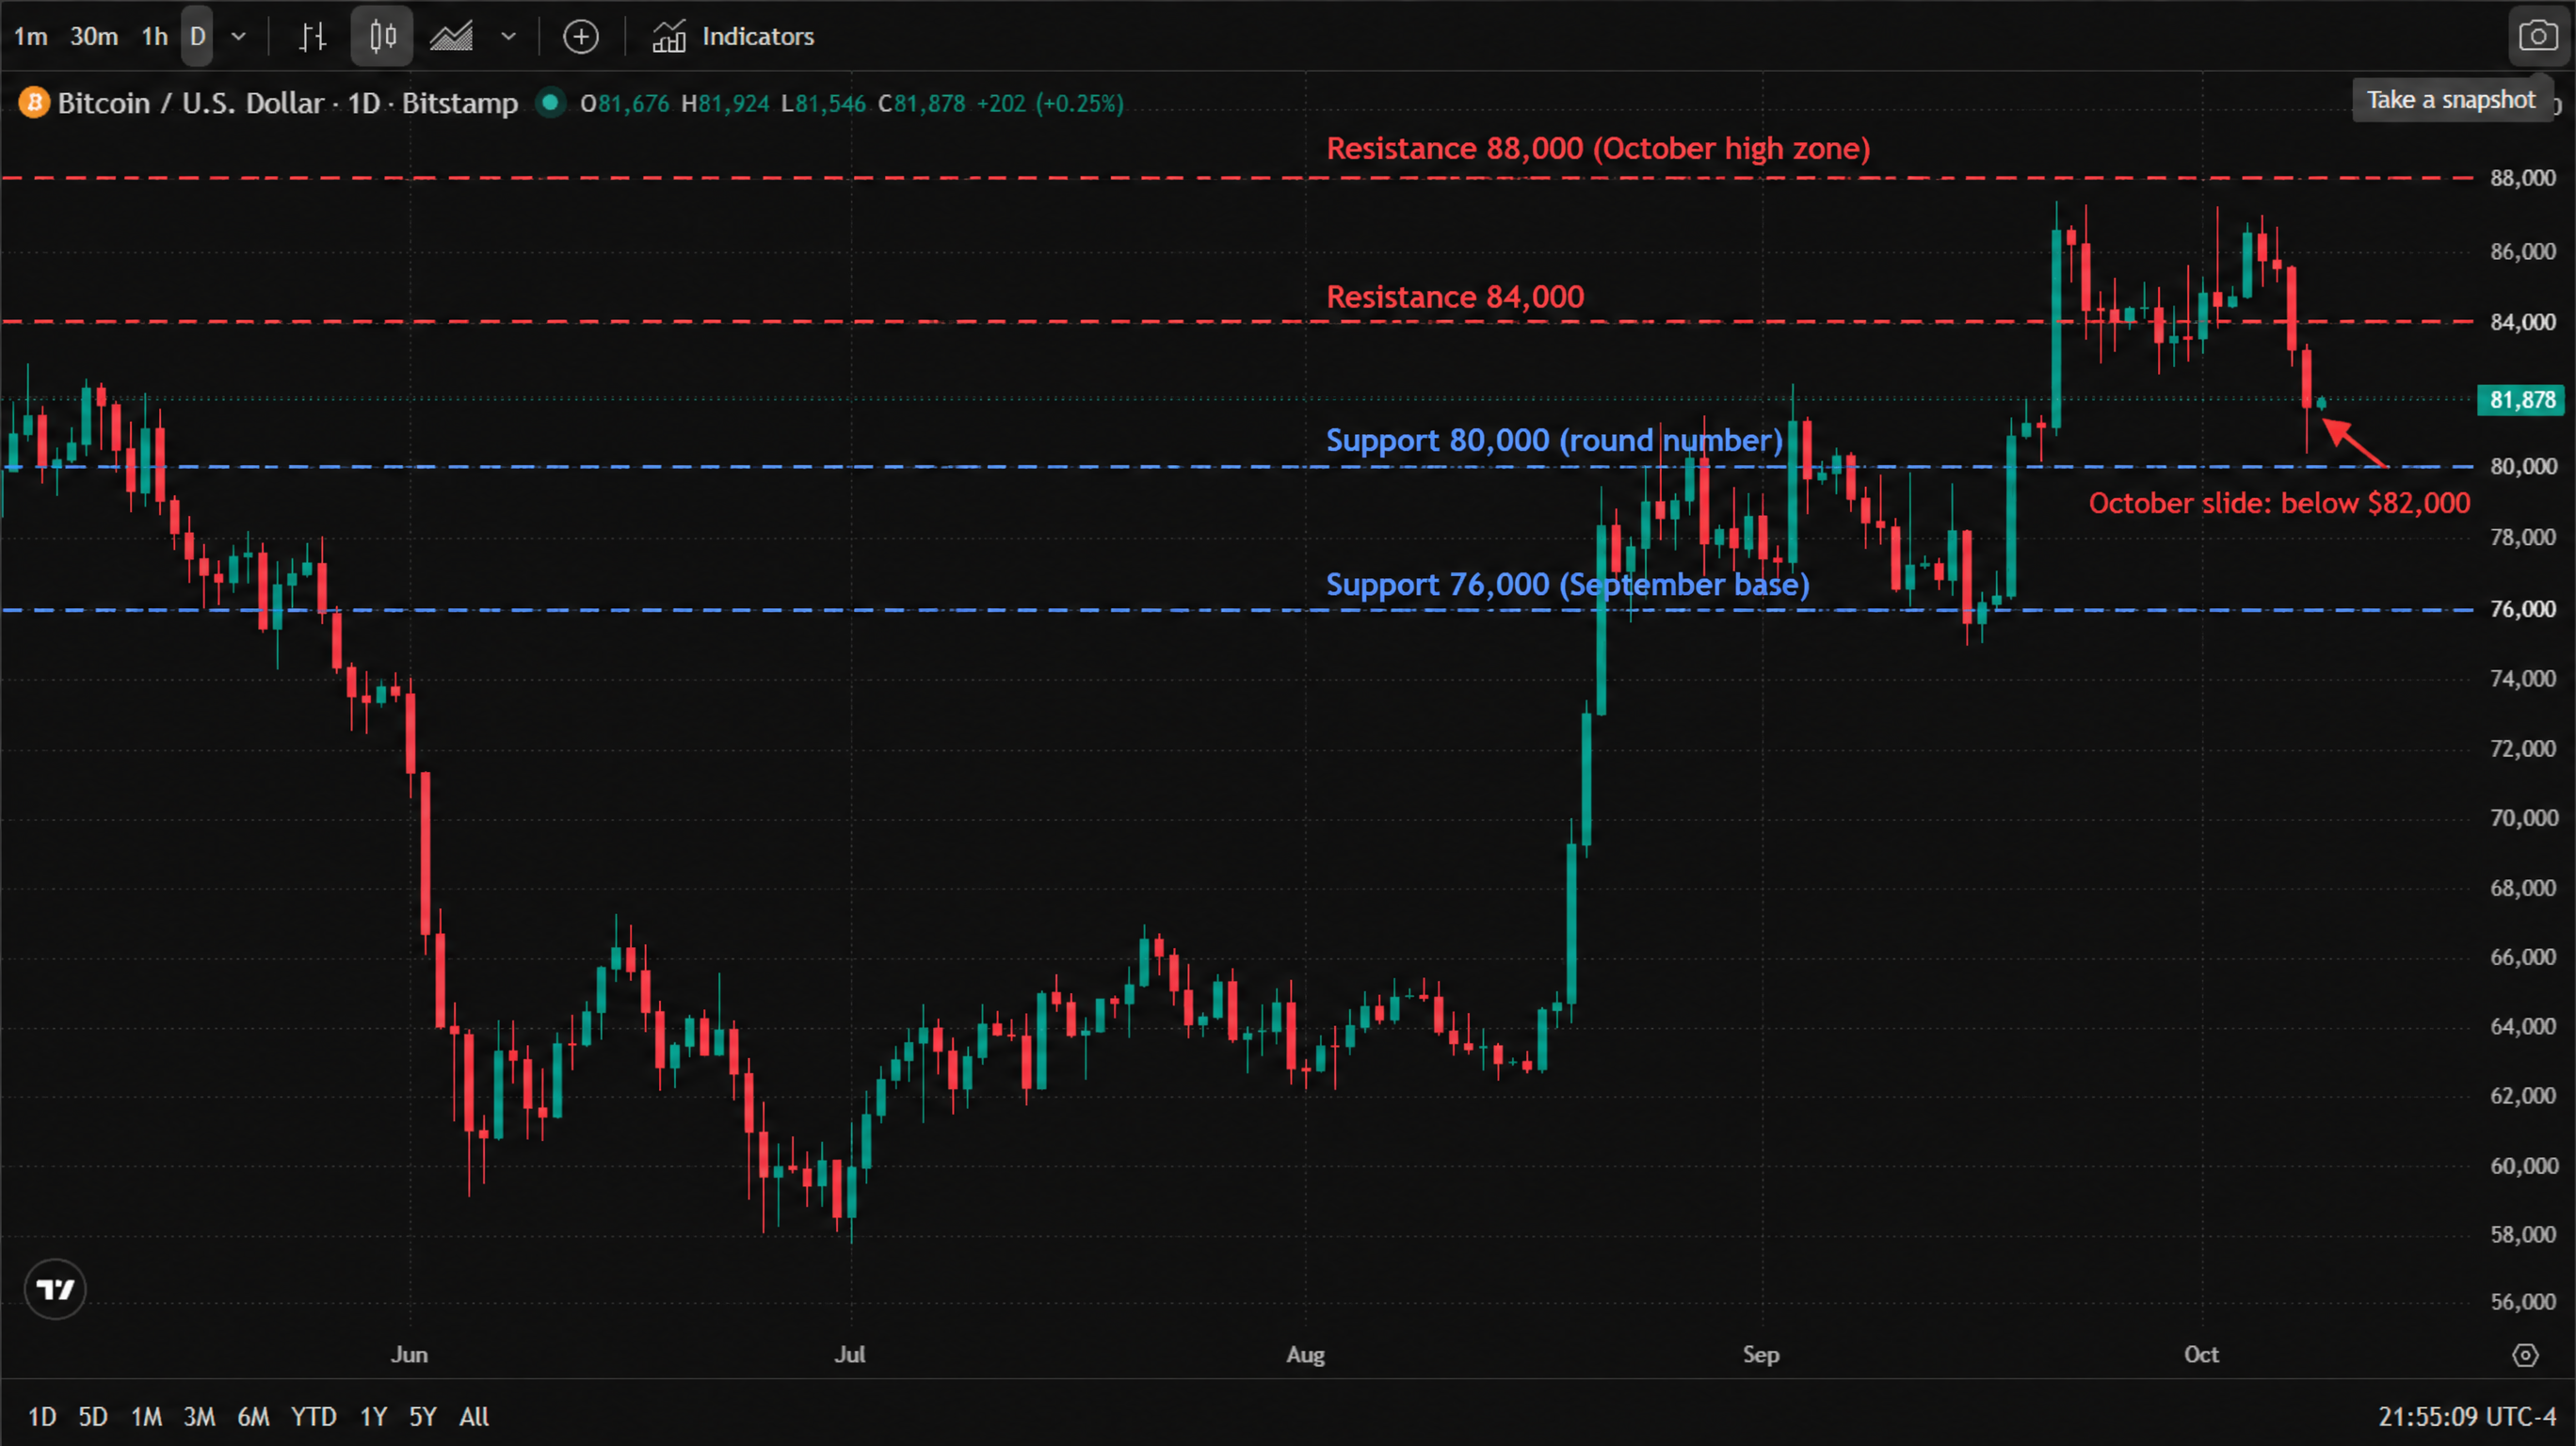
* Chart source: TradingView official chart screenshot, data source Bitstamp (Bitcoin / U.S. Dollar).
What to watch
Two dates now structure the calendar: the EIA report on 15 October, the first official read on the Gulf shut-ins, and the FOMC decision on 27-28 October, where the market expects a hold and points to December as the live meeting. In between, watch one number above all: the 30-year yield. A retest of 5.73% would re-price the whole board; a drift toward 5.5% extends Friday's reprieve. Gold, tech equities and crypto are all still trading as one position on it.
Read more
Before making any trading decisions, it is important to equip yourself with sufficient fundamental knowledge, have a comprehensive understanding of market trends, be aware of risks and hidden costs, carefully consider investment targets, level of experience, risk appetite, and seek professional advice if necessary.
Furthermore, the content of this article is solely the author's personal opinion and does not necessarily constitute investment advice. The content of this article is for reference purposes only, and readers should not use this article as a basis for any investment decisions.
Investors should not rely on this information as a substitute for independent judgment or make decisions solely based on this information. It does not constitute any trading activity and does not guarantee any profits in trading.
If you have any inquiries regarding the data, information, or content related to Mitrade in this article, please contact us via email: insights@mitrade.com. The Mitrade team will carefully review the content to continue improving the quality of the article.


