


Memory chips surge, Nasdaq notches a second straight record close — why the Dow fell 185 points anyway

The Nasdaq Composite rose 0.45% on Tuesday to a record close of 27,244.28 — its second consecutive record, and an intraday all-time high of 27,288.79. The S&P 500 finished effectively flat at 7,764.64, down less than a point and about 0.4% below its own record. And then there is the Dow: down 185.14 points, or 0.36%, to 51,863.69, dragged by financials. Same session, two completely different tapes.
The move: a memory-led rally, not a broad one
| US session, 22 September | Level |
|---|---|
| Nasdaq Composite | 27,244.28 (+0.45%) — record close, 2nd straight |
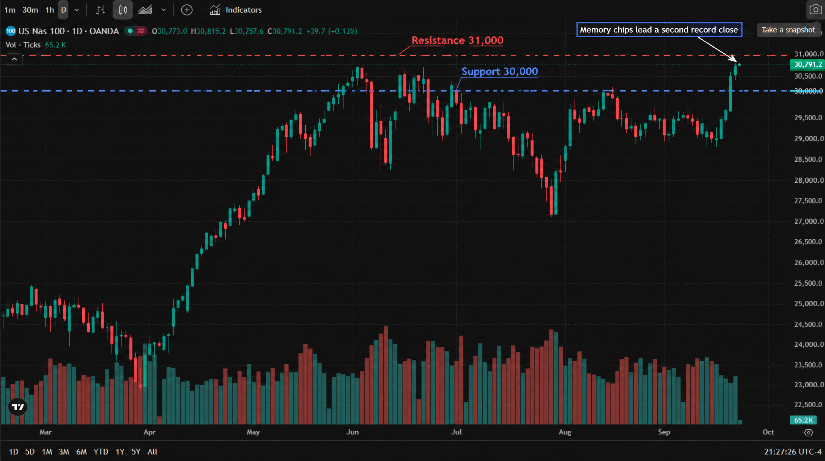
Nasdaq 100 (NAS100) | 30,732.40 — record intraday high of 30,770.63 |
| S&P 500 | 7,764.64 (−0.06 points) |
| Dow Jones | 51,863.69 (−185.14, −0.36%) |
| Russell 2000 | 2,889.92 (+0.5%) |
| Philadelphia Semiconductor Index | +2.06% — sixth straight gain |
| VIX | 14.21 (−4.4%) |
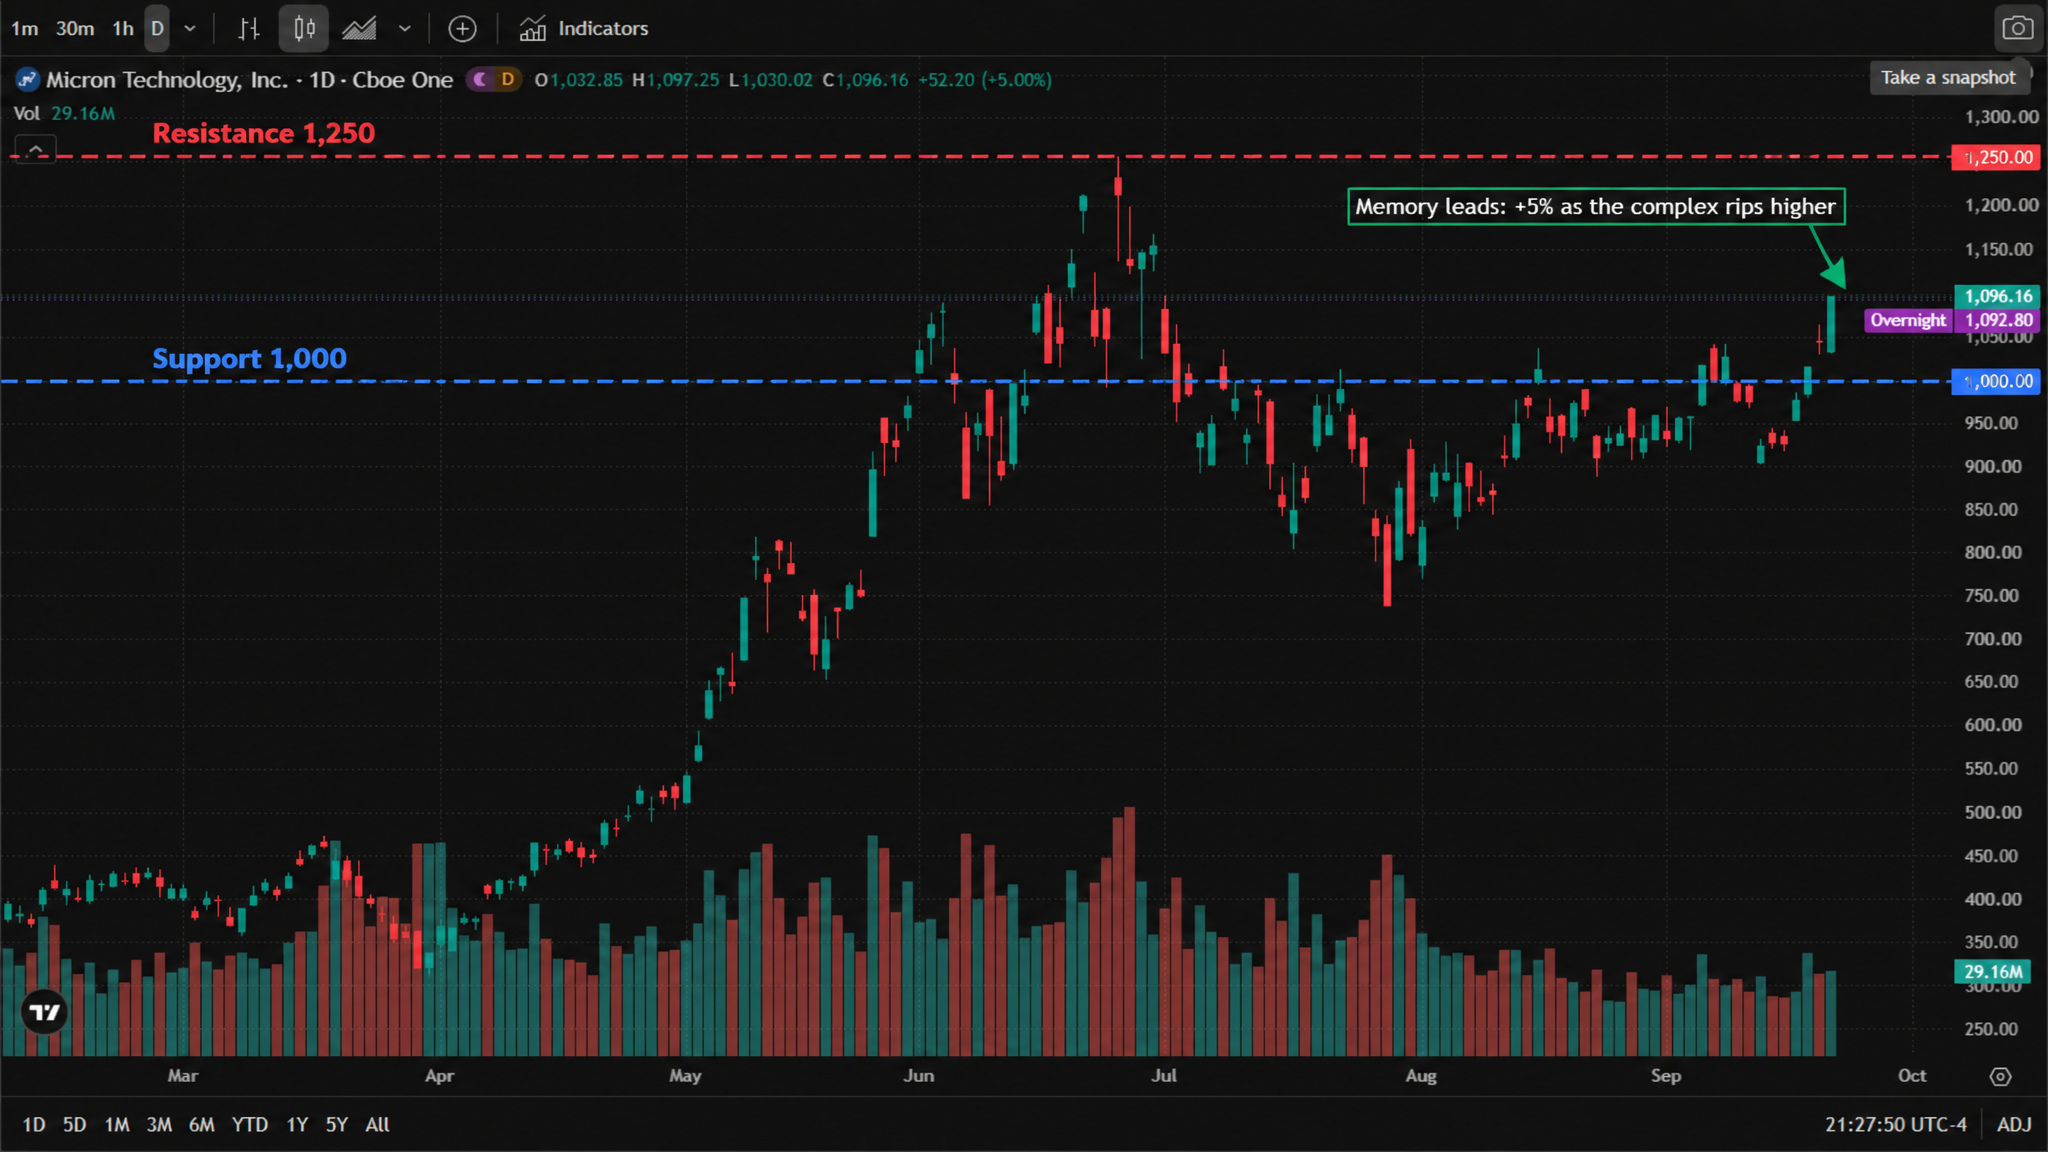
The leadership was narrow and specific. SanDisk jumped 6.8%, Micron 5%, Seagate 4%, Western Digital 3% and SK Hynix's ADR 3% — a clean sweep of the memory complex. TSMC's ADR added 1.54% to $452. Everything else was closer to flat, which is precisely why the S&P could not move and why the Dow could fall while the Nasdaq set a record.
* Chart source: official TradingView chart screenshot (OANDA:NAS100USD).
Why memory, and why now
The memory complex has become the market's preferred way to express an AI view, for a practical reason: it is the tightest link in the supply chain. Every AI server needs high-bandwidth memory, and HBM capacity has been sold out for quarters. When buyers are rationed, price goes up — and so do margins.
Three things are reinforcing that narrative this week:
Tight supply is visible in the numbers. Micron's HBM4 shipments have already crossed $1 billion, with roughly 60,000 wafers per month of new HBM capacity being added and capacity reported sold out into 2027.
Demand signals keep arriving. Cloud capital spending is being revised higher, and the memory line item is specifically called out in those budgets — a rare thing for a component.
The validation date is set. Micron reports on 30 September. That is the single most important checkpoint for whether this rally reflects orders or hope.
The divergence: why the Dow fell while the Nasdaq set a record
This is the part worth understanding. Tuesday's losers were almost entirely financials:
| Dow / financial laggards, 22 Sept | Move |
|---|---|
| Charles Schwab | −6.1% |
| JPMorgan Chase | −3%+ |
| Wells Fargo | −3%+ |
| Airbnb | −3% |
Leverage to the rate path explains most of it. The Fed hiked on 16 September to 3.75% ~ 4.00% and the market is pricing a further move as early as October. Financials had rallied hard into that decision; once the hike was delivered, the position unwound. Meanwhile 10-year Treasury yields sit near 4.95% ~ 4.96% — below the 5% line, which helps long-duration growth names and hurts rate-sensitive lenders on the margin.
In other words: a hawkish Fed is not uniformly bearish for equities — it is rotationary. Money that came out of banks went into semiconductors. That is the whole story of Tuesday's split tape.
* Chart source: official TradingView chart screenshot (NASDAQ:MU).
What the street is pricing in
The sell-side is unusually split on how far this runs — which is itself the signal.
| Analyst / house | Rating | Target | Core argument |
|---|---|---|---|
| Melius Research | Buy | $2,200 (street high, ~110% upside) | Revenue visibility from HBM supply agreements |
| TD Cowen (Krish Sankar) | Buy | $1,600 | Gross margin peaking near 89% in Q2 2027 |
| Stifel (Brian Chin) | Buy | $1,500 | HBM4 price per bit roughly doubling in 2027 |
| RBC Capital (Srini Pajjuri) | Outperform | $1,500 | DRAM upcycle has another five quarters; HBM prices +80% ~ 100% in 2027 |
| Goldman Sachs (James Schneider) | Hold | $1,100 | Expects "another strong quarter" but sees the stock as fully valued |
| 24/7 Wall St. (model) | Hold | $949 | The outlier bear case |
Consensus: roughly 28 ~ 29 Buys against one Hold, average target around $1,513 ~ $1,567 — implying 45% ~ 60% upside. The honest read: the bull case is crowded, and the two Hold ratings sit at $949 ~ $1,100, below today's price. That gap is what 30 September's guidance has to close.
The fundamental numbers behind the targets are concrete: HBM3E and HBM4 are booked through 2027, Micron's 16 Strategic Customer Agreements cover about $100 billion of minimum contracted revenue through 2030, and the company carries $22 billion in customer deposits. Q4 guidance is for roughly $50 billion in revenue at an ~86% gross margin.
Levels that matter
| Instrument | Resistance | Support |
|---|---|---|
| NAS100 | 31,000 (round-number gate; record high 30,770) | 30,000 (breakout retest level) |
| Micron (MU) | 1,250 (June all-time high) | 1,000 (round number, prior consolidation) |
The technical picture is straightforward: both the index and the stock broke out and are now testing whether the breakout holds as support. NAS100 holding above 30,000 keeps the record-close sequence intact; losing it would put 29,500 back in play.
What to watch: two scenarios
Scenario A — memory stays tight. Micron's 30 September report delivers on HBM pricing and 2027 capacity, the guide at least matches the ~$50 billion revenue and ~86% gross margin already telegraphed, and the complex extends. NAS100 clears 31,000, and the second record close becomes a trend rather than an event.
Scenario B — the guide disappoints. A soft margin guide — the memory cycle's classic tell — or any sign of AI capital-spending moderation would hit the whole complex, not just MU. Given that two houses already sit at Hold with targets below spot, the downside reaction would likely be sharper than the upside one. NAS100 retests 30,000, and the Dow's financial drag becomes the market's dominant story instead of a footnote.
Either way, the near-term calendar is thin: US flash PMIs at 9:45 AM ET, Fed Governor Barr at 10:05 AM ET and the EIA petroleum report at 10:30 AM ET tonight. Nothing reshuffles the memory thesis before Micron reports.
Read more
Before making any trading decisions, it is important to equip yourself with sufficient fundamental knowledge, have a comprehensive understanding of market trends, be aware of risks and hidden costs, carefully consider investment targets, level of experience, risk appetite, and seek professional advice if necessary.
Furthermore, the content of this article is solely the author's personal opinion and does not necessarily constitute investment advice. The content of this article is for reference purposes only, and readers should not use this article as a basis for any investment decisions.
Investors should not rely on this information as a substitute for independent judgment or make decisions solely based on this information. It does not constitute any trading activity and does not guarantee any profits in trading.
If you have any inquiries regarding the data, information, or content related to Mitrade in this article, please contact us via email: insights@mitrade.com. The Mitrade team will carefully review the content to continue improving the quality of the article.


