


October hike odds climb toward 60% as Goldman and BofA both flip — what Warsh's "dose of accommodation" really changed


Eight days ago the Federal Reserve raised rates for the first time since July 2023. The decision itself was not the story — the market had it at roughly 90% beforehand. The story is what happened next: the odds of another hike at the October 27-28 meeting have climbed from about 30% before the decision to roughly 55% ~ 62% now, and two of Wall Street's largest houses have changed their published forecasts to match.
The repricing, in one table
| Date | October hike odds | What drove it |
|---|---|---|
| Late August (post-Jackson Hole) | about 70% | Warsh's first major speech as Chair |
| Before the 16 September decision | about 30% | Market treated the hike as one-and-done |
| 18 September (after the hike) | about 58% | Warsh's "removing accommodation" framing |
| 20 September | about 56% ~ 58% | CME 58% / Kalshi 56% / Polymarket 56% |
| 22 September | about 62% | Fed speakers reinforce; oil slide cuts both ways |
For December, futures imply roughly 90% probability of at least one more move, and about 42% for at least two more by year-end. The two-year Treasury yield sits near 4.75%, having earlier touched a two-year high; the 10-year is around 4.95% ~ 4.96%, still below the 5% line. The curve has flattened — the front end is pricing the Fed, the long end is pricing lower inflation.
What Warsh actually said — and why it mattered more than the hike
The Fed raised the target range by 25 basis points to 3.75% ~ 4.00% on a 12-0 unanimous vote. The dot plot showed 16 of 18 officials expecting at least one more increase this year, lifting the median year-end projection to 4.125%, with the 2027 median raised to 4.1%.
But the language is what moved markets. Chair Kevin Warsh described the move not as tightening but as "removing some accommodation" — a "dose of accommodation." He called inflation "too high and persistent too long," and notably declined to anchor policy to the neutral rate.
That framing matters because it reframes the entire debate. A hike that "removes accommodation" implies policy is still easy and more removal may follow. A hike that "tightens" implies the Fed is approaching the end. Markets read the first interpretation, and repriced accordingly.
Officials have reinforced it since. Collins flagged inflation risk above the 2% target; Musalem said core inflation may be running a full percentage point above target and rates "may need to rise further"; Goolsbee warned that repeated supply shocks can no longer be treated as noise. Williams confined himself to saying the short-term rate control framework is working — a notably neutral remark in a hawkish week.
What the banks changed
| Institution | Previous view | New view |
|---|---|---|
| Goldman Sachs | One hike, done | Added an October hike |
| Bank of America | Hold through year-end | Hikes in both October and December |
| Market (December) | — | about 90% for at least one more |
This is the tell that the repricing has legs. Sell-side forecasts move slower than futures, and when both Goldman and BofA shift in the same week, positioning follows.
The two numbers that actually decide October
Worth being precise about the mechanics: the October meeting will not include updated economic projections. No dot plot, no revised forecasts — just the statement and the press conference. That makes the decision unusually data-dependent, and it puts two releases in control:
| Date | Release | Why it matters |
|---|---|---|
| 2 October | September jobs report | A hot payroll print pushes October odds into the 70s |
| Mid-October | September CPI | The last inflation read before the meeting |
A soft inflation print could make a hold the base case again — the market is genuinely close to a coin flip here, which is exactly why the odds have swung between 45% and 70% within a month.
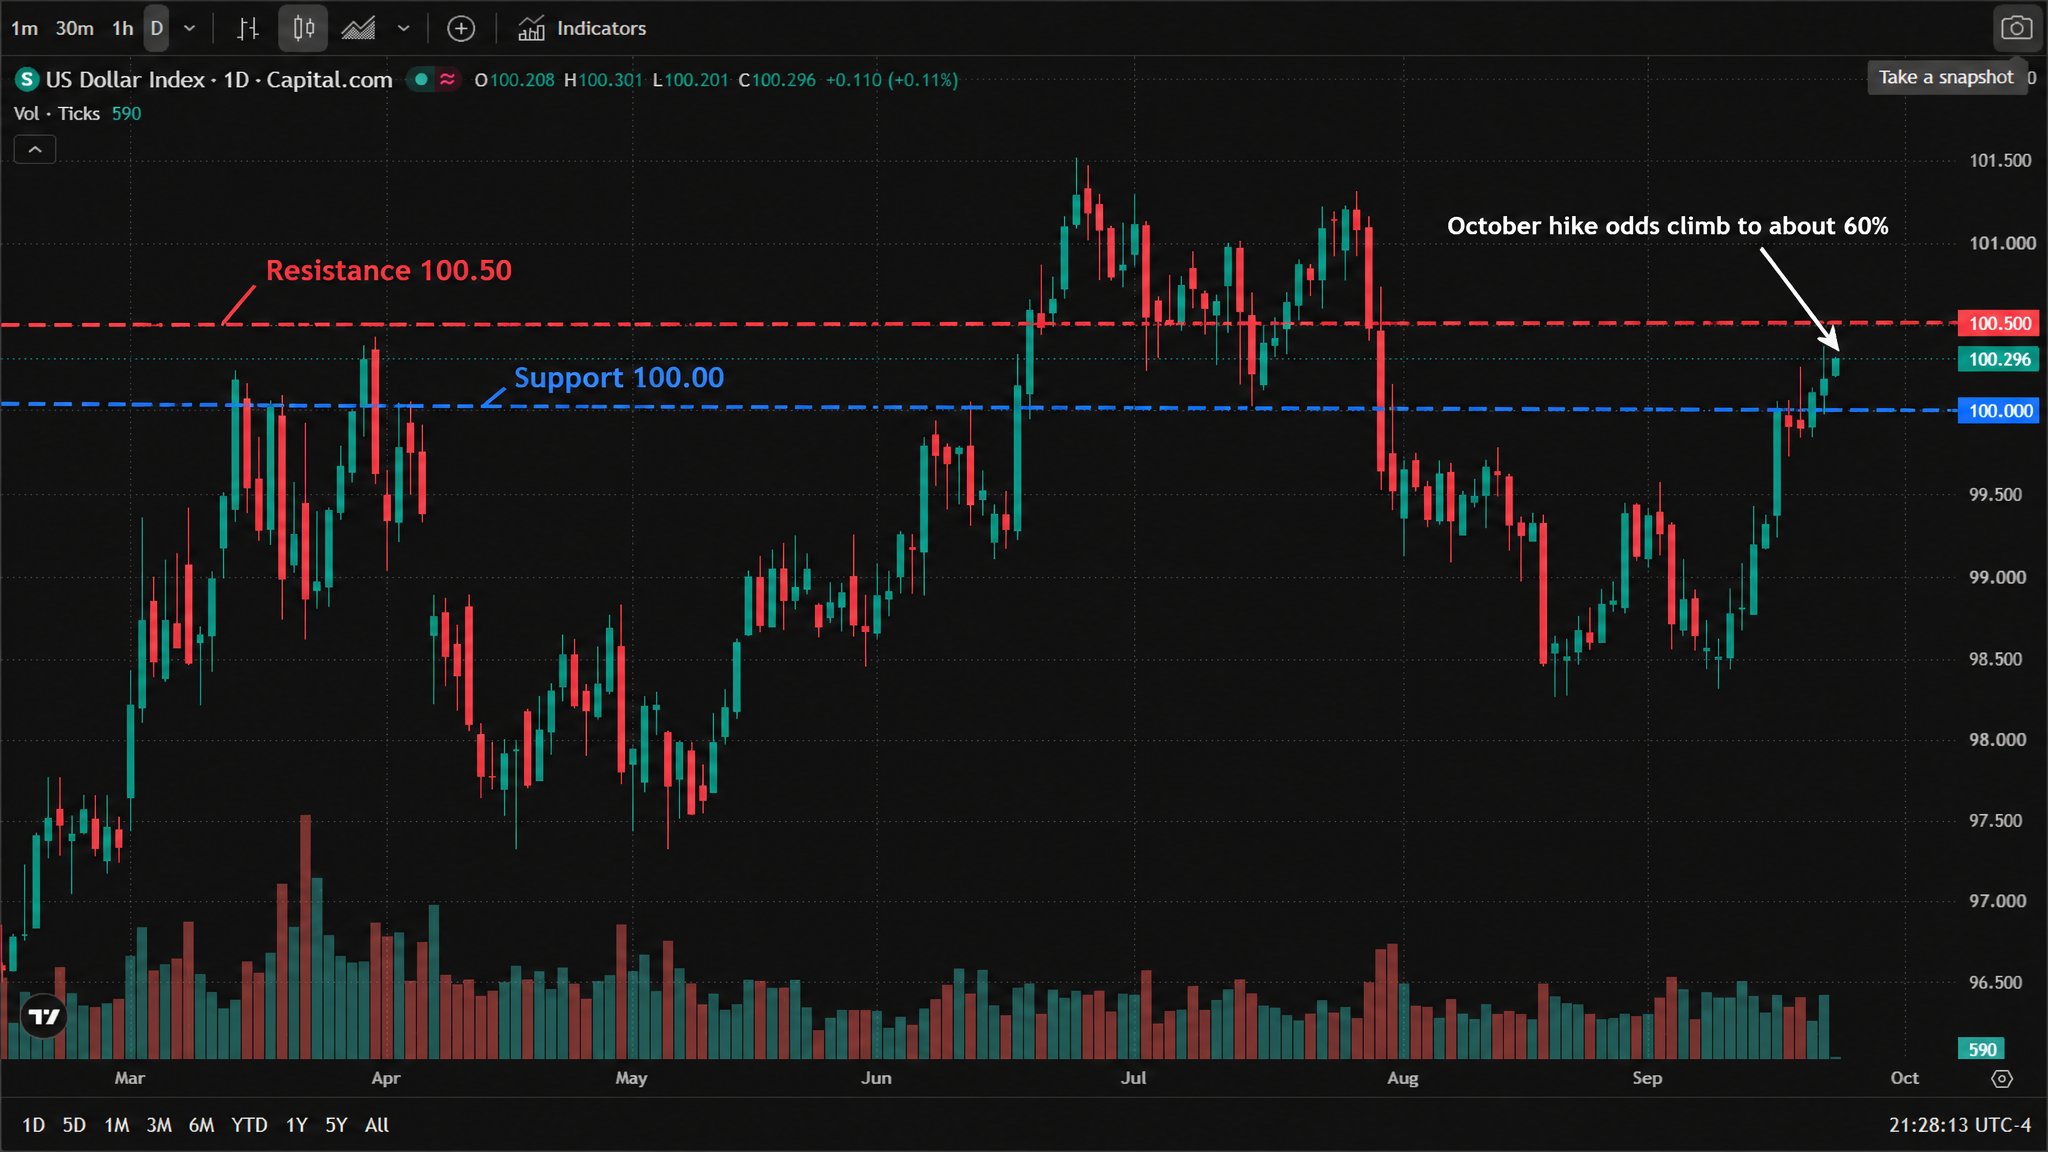
* Chart source: official TradingView chart screenshot (CAPITALCOM:DXY).
The case for waiting
Not everyone reads the same tape, and the hawkish repricing is not unanimous.
MUFG expects "the compromise between the hawks and doves to be for the Fed to skip October and hike in December." Its reasoning: Warsh insists he is not single-data-point dependent and focuses on trends — and by 27 October there simply is not enough time to judge whether the trend has changed. It also cites the midterm elections, possible energy repricing and spillovers from other central banks tightening as reasons to wait.
SouthState Securities holds October at 55% and names the August PCE print as the key unknown.
Some sell-side research warns the aggressive pricing can simply reverse. Huachuang Securities has published six "confusions" about the Fed's reaction function, arguing there is no clear standard for judging when financial conditions are genuinely restrictive — the same ambiguity that let markets swing between 45% and 70% within a month.
The dot plot carries the internal dissent too: of the 18 participants, only 2 judged the September hike sufficient — a detail that cuts both ways, since it means the committee's centre of gravity is genuinely hawkish, not merely the Chair's.
Two scenarios — and what to watch
Scenario A — the Fed hikes again in October. A hot September payroll report on 2 October, or a firm CPI in mid-October, validates the current pricing. DXY clears 100.69 (Tuesday's 2.5-month high) and sets its sights on the July peak near 101.4; gold retests the $4,333 support shelf; US500 gives back recent gains.
Scenario B — the Fed skips. Softer data revives the MUFG view and a hold gets priced as the base case. The dollar loses the 100.00 handle, gold pushes back toward $4,400, and the September dollar recovery unwinds — the mirror image of the move that has defined this month.
On the near-term calendar: Fed Governor Barr speaks on housing at 10:05 AM ET tonight, then Barkin (Thursday 8:00 AM ET), Hammack (Thursday 8:50 AM, Friday 2:00 PM), Paulson (Thursday 10:10 AM) and Williams (Friday 5:15 AM). With no major data before 2 October, communication is the only input — and falling oil, which has drained the inflation premium from the long end, is the wildcard underneath both scenarios.
The short version: the September hike was not the end of the story, and the market is now treating it as the beginning of one. Whether that is right gets tested on 2 October.
Read more
Before making any trading decisions, it is important to equip yourself with sufficient fundamental knowledge, have a comprehensive understanding of market trends, be aware of risks and hidden costs, carefully consider investment targets, level of experience, risk appetite, and seek professional advice if necessary.
Furthermore, the content of this article is solely the author's personal opinion and does not necessarily constitute investment advice. The content of this article is for reference purposes only, and readers should not use this article as a basis for any investment decisions.
Investors should not rely on this information as a substitute for independent judgment or make decisions solely based on this information. It does not constitute any trading activity and does not guarantee any profits in trading.
If you have any inquiries regarding the data, information, or content related to Mitrade in this article, please contact us via email: insights@mitrade.com. The Mitrade team will carefully review the content to continue improving the quality of the article.


