


Gold posts first weekly gain in three weeks — can $4,200 hold through CPI?


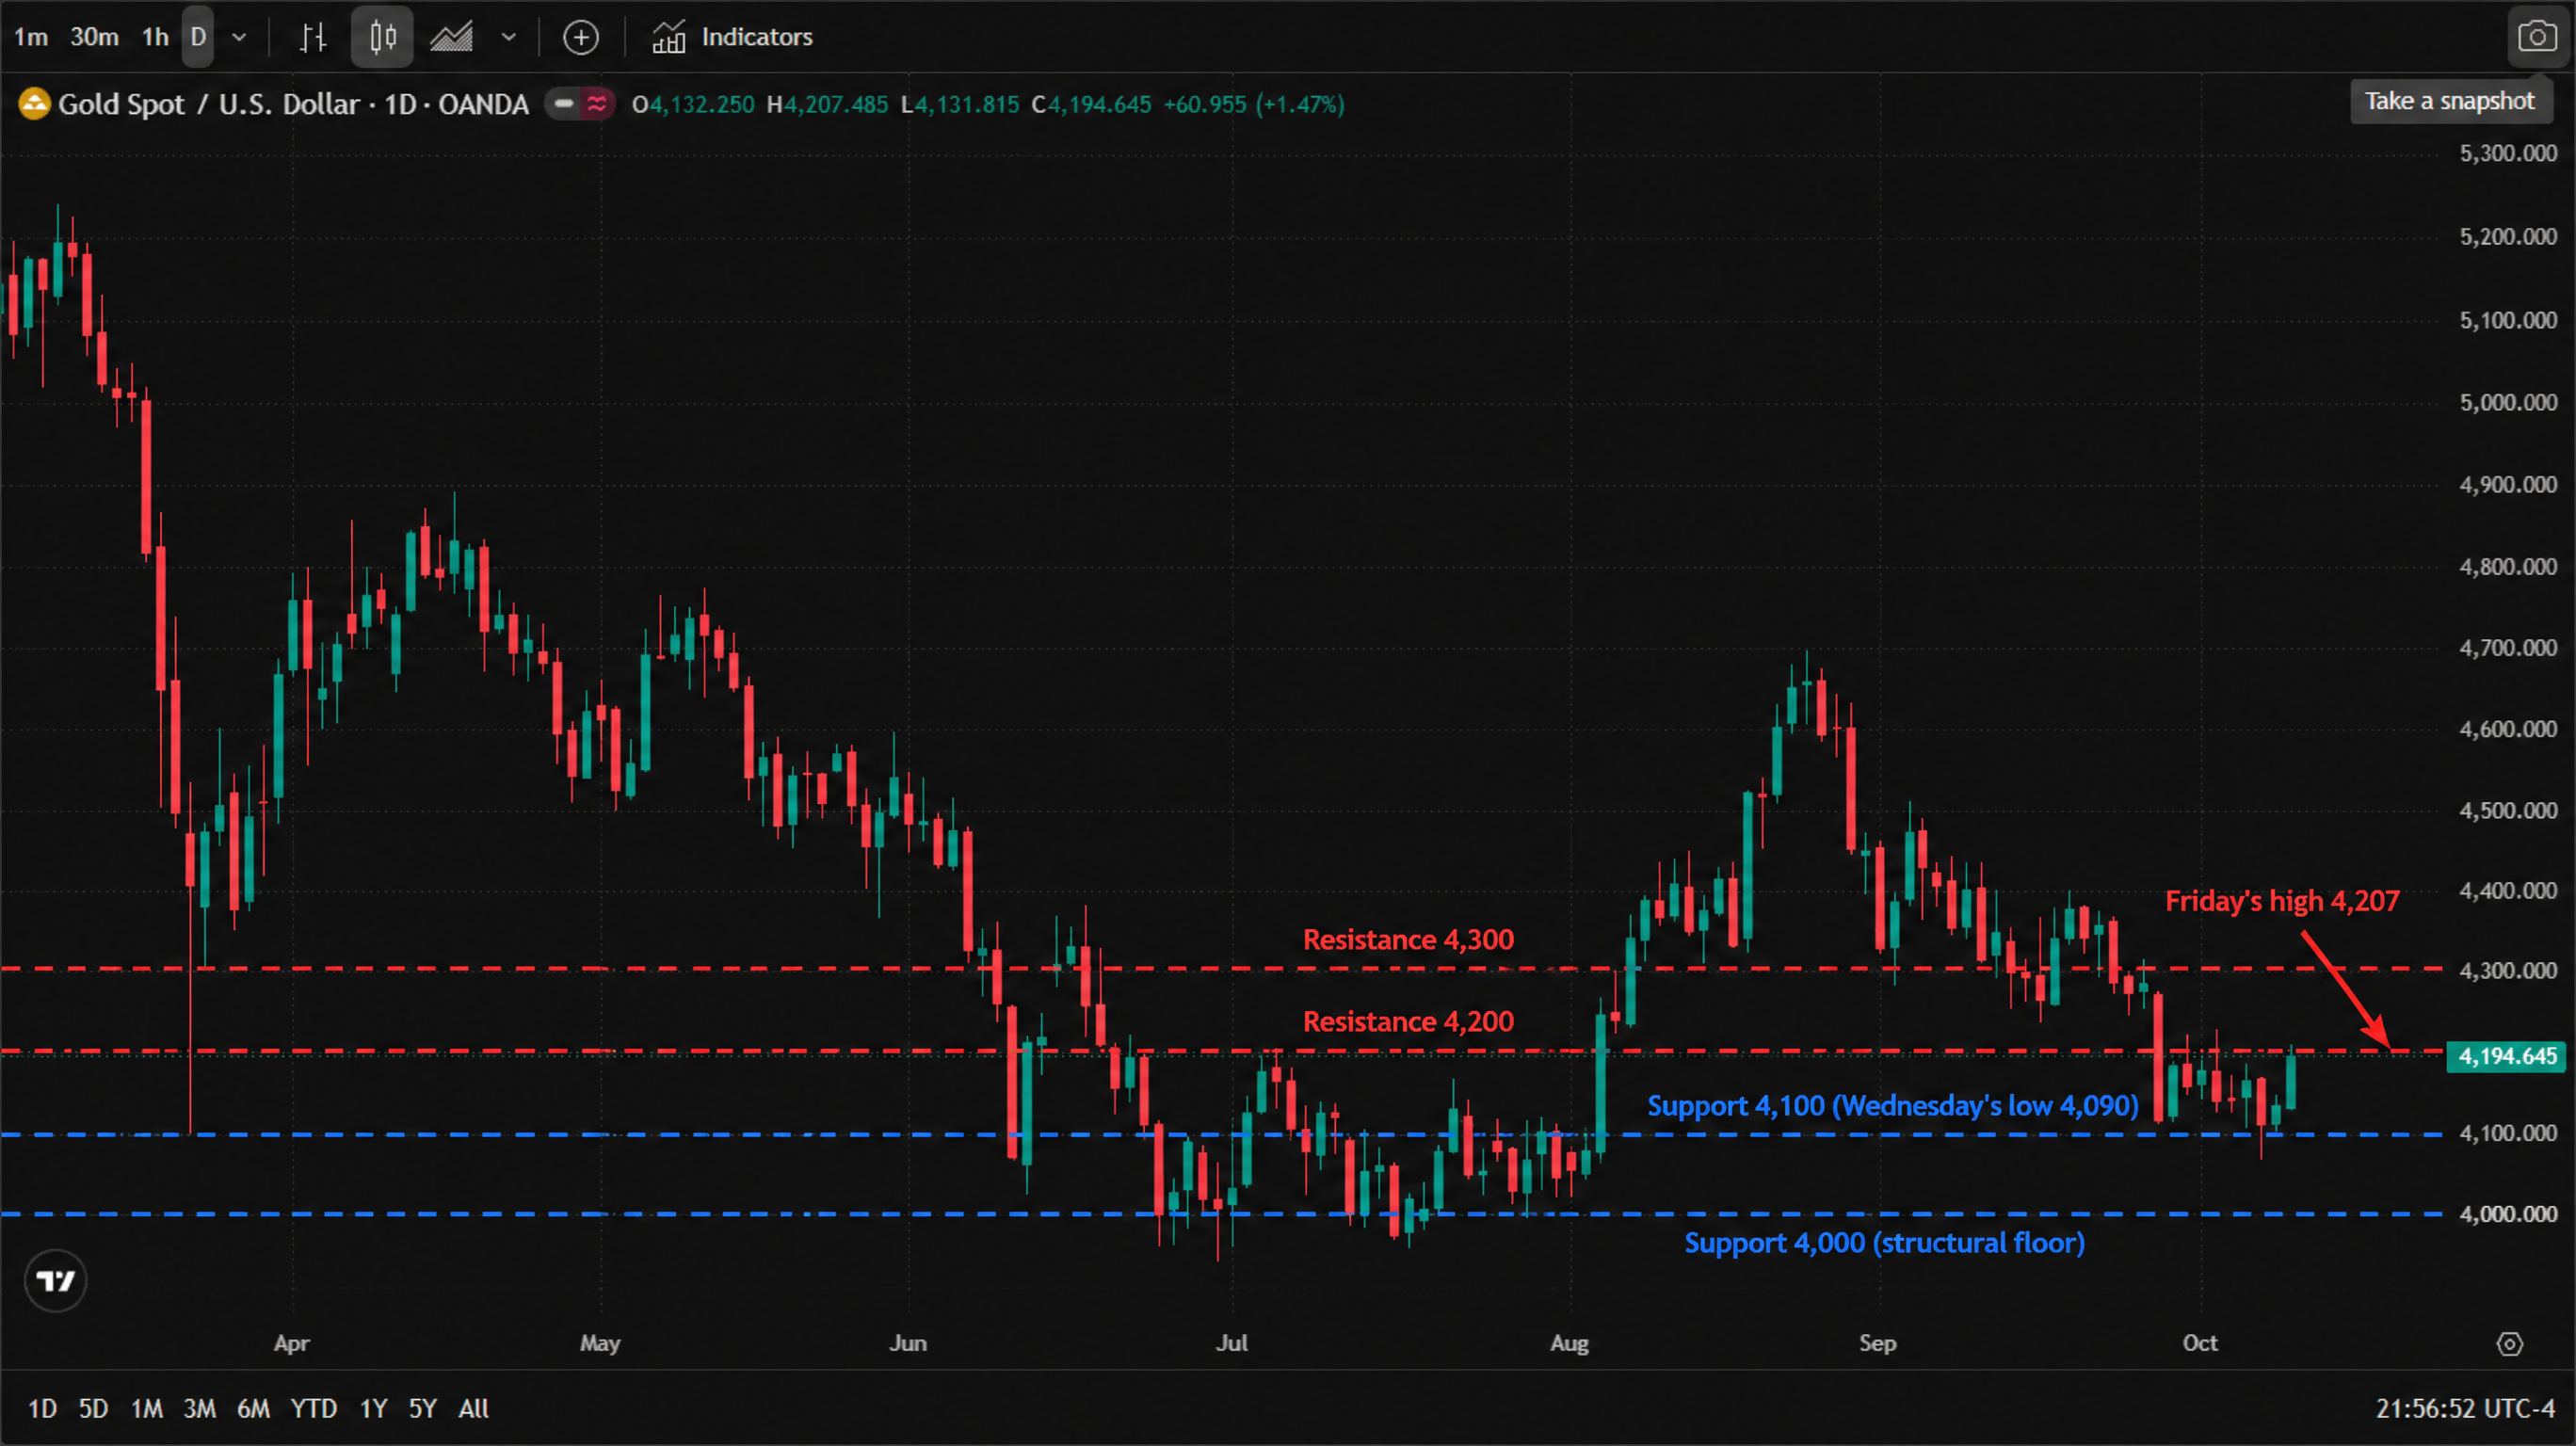
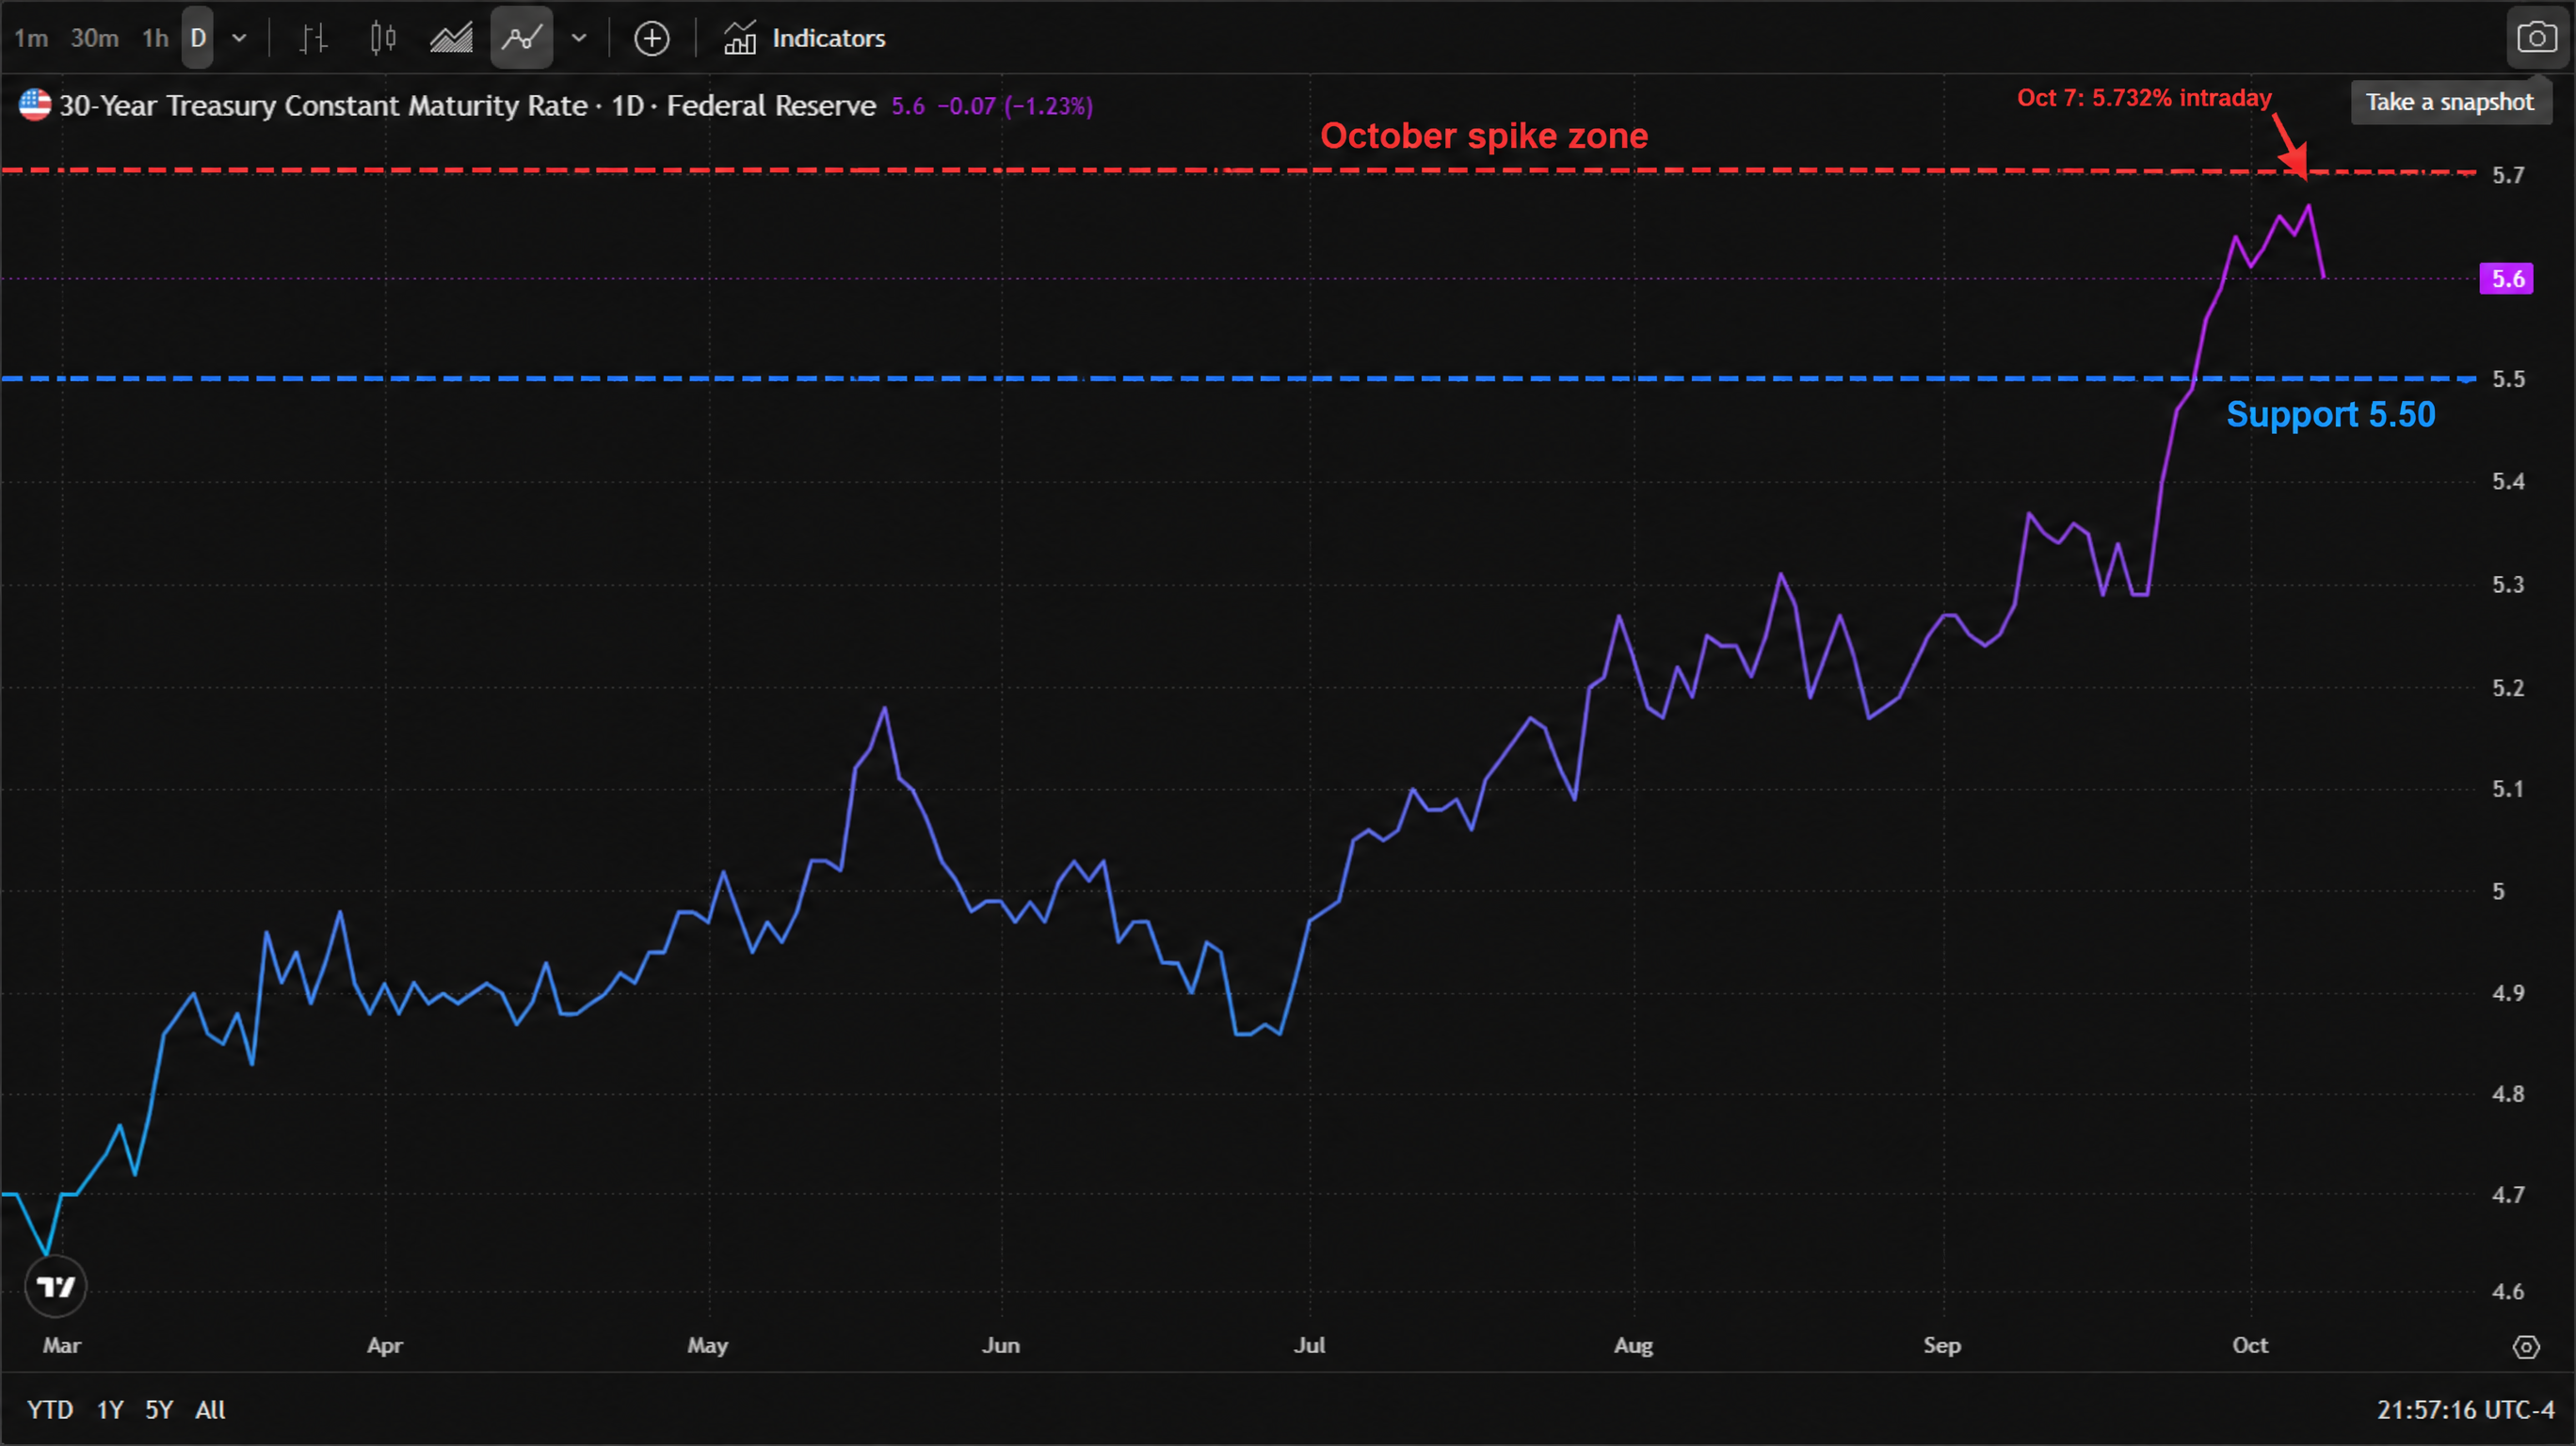
Mitrade Insights — Gold closed the week on its front foot. Spot finished Friday at $4,194.645, up 1.47%, after touching $4,207.485 intraday — and the week as a whole gained about 1.5%, gold's first weekly gain in three weeks. COMEX December futures settled at $4,220.30 (+1.52%), back above the $4,200 line, and silver jumped 3.5% to $61.11. The driver was the same one that had crushed gold three days earlier: real yields. The 30-year Treasury yield backed off Wednesday's 5.732% spike — its highest since June 2004 — and gold's slide into a two-month low snapped. Now the rebound faces Wednesday's CPI.
The move: the two drivers finally flipped
For two straight weeks gold had one story — rising long-end yields — and it pushed in one direction: from above $4,700 in early September to $4,090 on Wednesday, a two-month low. This week the mix changed. The 30-year retreated to 5.600% by Friday (from 5.732% intraday), the dollar's rally paused at a six-month high, and the physical side showed up: China's post-Golden Week buying season is underway, with the Shanghai premium at a three-month high. Silver's 3.5% Friday jump to $61.11 confirmed that this was a metals-wide reprieve, not a gold-only bounce.
The bounce leaves the metal about 11% below September's high area and 2.6% above Wednesday's low — a reprieve, not a repair. The rate math explains the violence of both moves: with September CPI expected at 3.7% and the 30-year paying 5.6%, long-end real yields are deeply positive — historically gold's least comfortable environment. It also explains why a single session of yield relief was enough to snap the slide — in this regime, gold trades as a real-yield mirror, not a crisis hedge.
* Chart source: TradingView official chart screenshot, data source OANDA (XAU/USD).
What changed — and what didn't
The 30-year tells the story. It spiked to 5.732% intraday on Wednesday — the highest since June 2004 — and has since eased to 5.600%, which is precisely the window gold needed to bounce. But nothing about the policy path changed: December hike odds remain near 70%, and the Fed's September minutes showed the committee still leaning toward one more increase this year.
The nettle: nothing in this bounce changes the Fed's path. December odds near 70% mean the market still expects another hike — the rebound is a yield-relief trade, not a policy-pivot trade, and it lasts exactly as long as the long end behaves. That is why Wednesday's CPI, and the long-end reaction to it, is the whole ballgame this week. The 10-year, at 5.244% into the weekend, is the number that anchors the whole complex.
* Chart source: TradingView official chart screenshot, data source Federal Reserve (30-year Treasury yield).
The institutional split
Strategists remain divided on whether Wednesday's low was the bottom. State Street's Aakash Doshi still calls $4,000 the structural floor and sees $5,000 by Q2 2027; Natixis' Bernard Dahdah keeps a year-end target of $4,100 — a level Wednesday's low essentially touched — with a bear case at $3,500 if real yields keep climbing. The honest shape of the split: a $4,000 floor and a $4,100 target are not far apart, which is why this bounce matters to both camps. One structural argument survives the selloff: the rebound arrived with almost no new catalyst — just a pause in yields — which argues the selling into Wednesday's low had largely exhausted itself.
Levels
Gold key levels. Support: $4,100 (the zone that caught Wednesday's $4,090 low) / $4,000 (psychological line — State Street's floor) / $3,950 (July low zone). Resistance: $4,200 (round number — Friday's high poked to $4,207 but sellers took the close back below) / $4,251 (September 30 high) / $4,300 (the downtrend line from August).
The structure to respect: as long as Friday's $4,090 low holds, the bounce has a base; the $4,200 ~ $4,251 band is where the rebound must prove itself — $4,251 was the last lower high before the September slide, and $4,300 is where the August downtrend line comes in.
The two scenarios
Scenario A — the rebound extends. A soft core CPI (0.2% m/m) keeps December priced without panic; the 30-year slides toward 5.50%, the dollar gives back part of its six-month high, and gold closes back above $4,200, opening $4,251 and then $4,300. The post-holiday Chinese buying season is the tailwind. A headline print at or below 3.7% keeps this read intact — real yields stop rising, and gold's discount to the August high starts to close. For silver, the same tape applies with a beta: it outran gold on Friday, and it will outrun it again if real yields keep falling.
Scenario B — CPI runs hot, and the rates trade wins again. A core print at 0.4% re-locks December; the 30-year heads back toward 5.70% and the dollar presses to a fresh six-month high. Gold fails at $4,200 and retests $4,100 — with Wednesday's $4,090 low the line between a rebound and a breakdown. Below it, $4,000 returns to the table. That is the sequence to fear: hot CPI → higher real yields → a stronger dollar, with gold on the losing side of all three.
Disclaimer: All data cited in this article is drawn from public exchange records, COMEX settlement data, the US Treasury par yield curve and news agency reporting, and is provided for information purposes only. It is not investment advice. Precious metals can be volatile, and CFD trading carries a high level of risk to your capital.
Related reads: Gold falls to a two-month low as real yields bite — can $4,000 hold? · The 30-year Treasury just hit a 22-year high — and the bond market is not pricing the Fed, it is pricing the deficit
Read more
Before making any trading decisions, it is important to equip yourself with sufficient fundamental knowledge, have a comprehensive understanding of market trends, be aware of risks and hidden costs, carefully consider investment targets, level of experience, risk appetite, and seek professional advice if necessary.
Furthermore, the content of this article is solely the author's personal opinion and does not necessarily constitute investment advice. The content of this article is for reference purposes only, and readers should not use this article as a basis for any investment decisions.
Investors should not rely on this information as a substitute for independent judgment or make decisions solely based on this information. It does not constitute any trading activity and does not guarantee any profits in trading.
If you have any inquiries regarding the data, information, or content related to Mitrade in this article, please contact us via email: insights@mitrade.com. The Mitrade team will carefully review the content to continue improving the quality of the article.


