


Bank earnings kick off tomorrow with the S&P 500 seven points from a record — what JPMorgan, Goldman, Citi and Wells Fargo must prove


Mitrade Insights — The S&P 500 closed Friday at 7,811.54 (+0.59%) — just 7 points below its October 6 record close of 7,818.93 — and the futures tape has already nudged past it, with the US500 CFD quoted near 7,832 in Monday's electronic session. Breaking the record is now a question of what the banks say. JPMorgan, Goldman Sachs, Citigroup and Wells Fargo report third-quarter results before Tuesday's open, the traditional starting gun for earnings season — and they arrive with a split setup: analysts expect roughly 20–25% year-over-year growth in S&P 500 profits, while the S&P 500 banks index is down about 7.5% over the past month and JPMorgan itself sits some 10% below its August peak. Can earnings close the gap between the fundamentals and the tape?
What's on deck: the Q3 earnings calendar
| Date | Before the open | Key read |
|---|---|---|
| Tue, Oct 13 | JPMorgan, Goldman Sachs, Citigroup, Wells Fargo (+ Johnson & Johnson, UnitedHealth) | Trading revenue, investment-banking revival, credit quality |
| Wed, Oct 14 | Bank of America, Morgan Stanley, BlackRock (+ ASML) | Consumer credit, wealth management, global AI capex |
| Thu, Oct 15 | Taiwan Semiconductor (TSMC) | AI demand and 2nm progress |
LSEG consensus puts Q3 earnings per share at $5.94 for JPMorgan, $12.44 for Goldman Sachs, $2.41 for Citigroup and $1.85 for Wells Fargo. The week then pivots straight into macro: September CPI lands Wednesday (consensus 3.7% year-over-year), PPI and retail sales follow Thursday, and Fed Chair Warsh speaks at the IMF meetings on Friday — his last scheduled remarks before the pre-FOMC blackout.
How we got here: the banks got cheap while the index got expensive
The unusual feature of this earnings setup is the divergence inside it. The index sits at a record; the sector reporting first has been one of the market's laggards. Three forces explain the gap:
September's Fed hike took the funds rate to 3.75–4.00% — the first increase since 2023 — putting loan-loss math and funding costs back at the centre of the bank story;
Long-end yields near multi-decade highs (the 10-year closed Friday at 5.24%, the 30-year near 5.60%) compress the value of banks' bond portfolios and raise the bar for everything else;
A split tape: the record run has been led by tech and megacap growth, while breadth — value, financials — has lagged. On Friday, the market was the most vivid example yet of structure shifting under sectors: SpaceX's spectrum deal for Starlink Mobile sent AT&T down 9.8% and Verizon down 8.8% in a single session.
Meanwhile the consumer economy the banks fund is sending mixed signals: the University of Michigan sentiment index fell to 46.3 — a five-month low — even as spending data held up.
The numbers that matter on Tuesday
Four lines to watch in the releases, in order of importance to the tape:
Trading revenue. Volatile rates and record-high commodities tape should have been kind to Goldman and JPMorgan's trading desks; a beat here is the fastest route to a positive stock reaction.
Investment-banking fees. The rebound in M&A and IPO activity (SpaceX-adjacent deal flow included) is the market's favourite structural story — any acceleration confirms it.
Card delinquencies and loan-loss provisions. With sentiment at five-month lows and gasoline back above $4 in parts of the US, consumer credit quality is the number that could spoil the quarter.
Net interest income guidance. With the Fed possibly hiking again in December, how management frames 2027 funding costs matters more than the quarter itself.
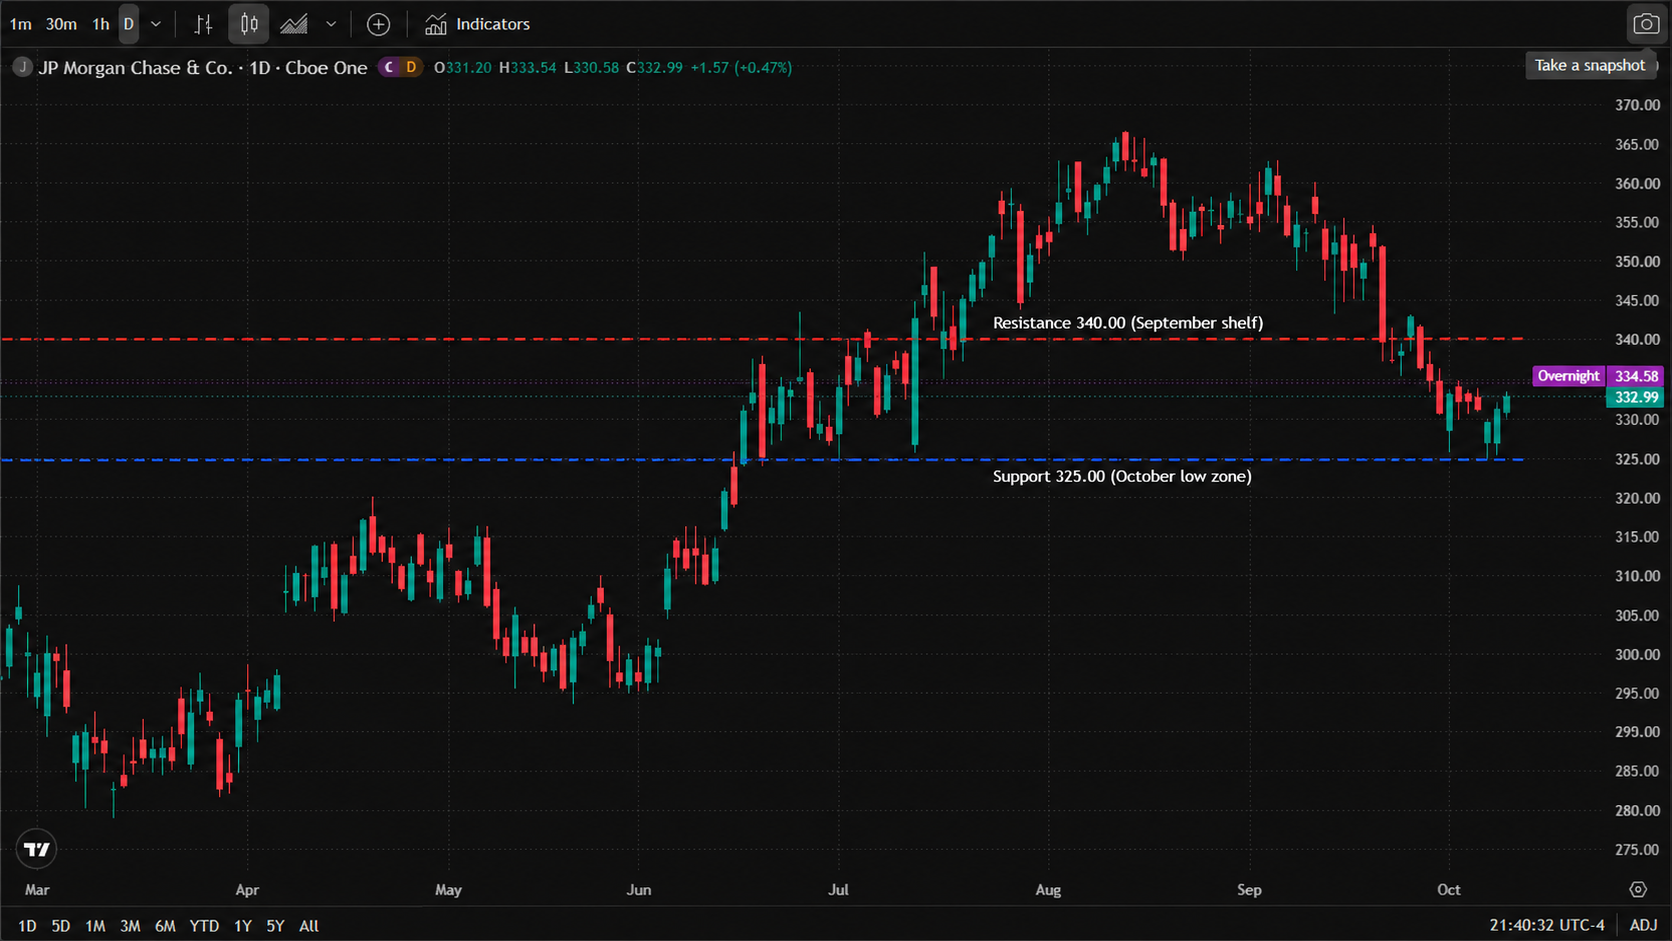
* Chart source: TradingView official chart screenshot, data source Cboe One (JP Morgan Chase & Co.).
Levels: for the index and for the first reporter
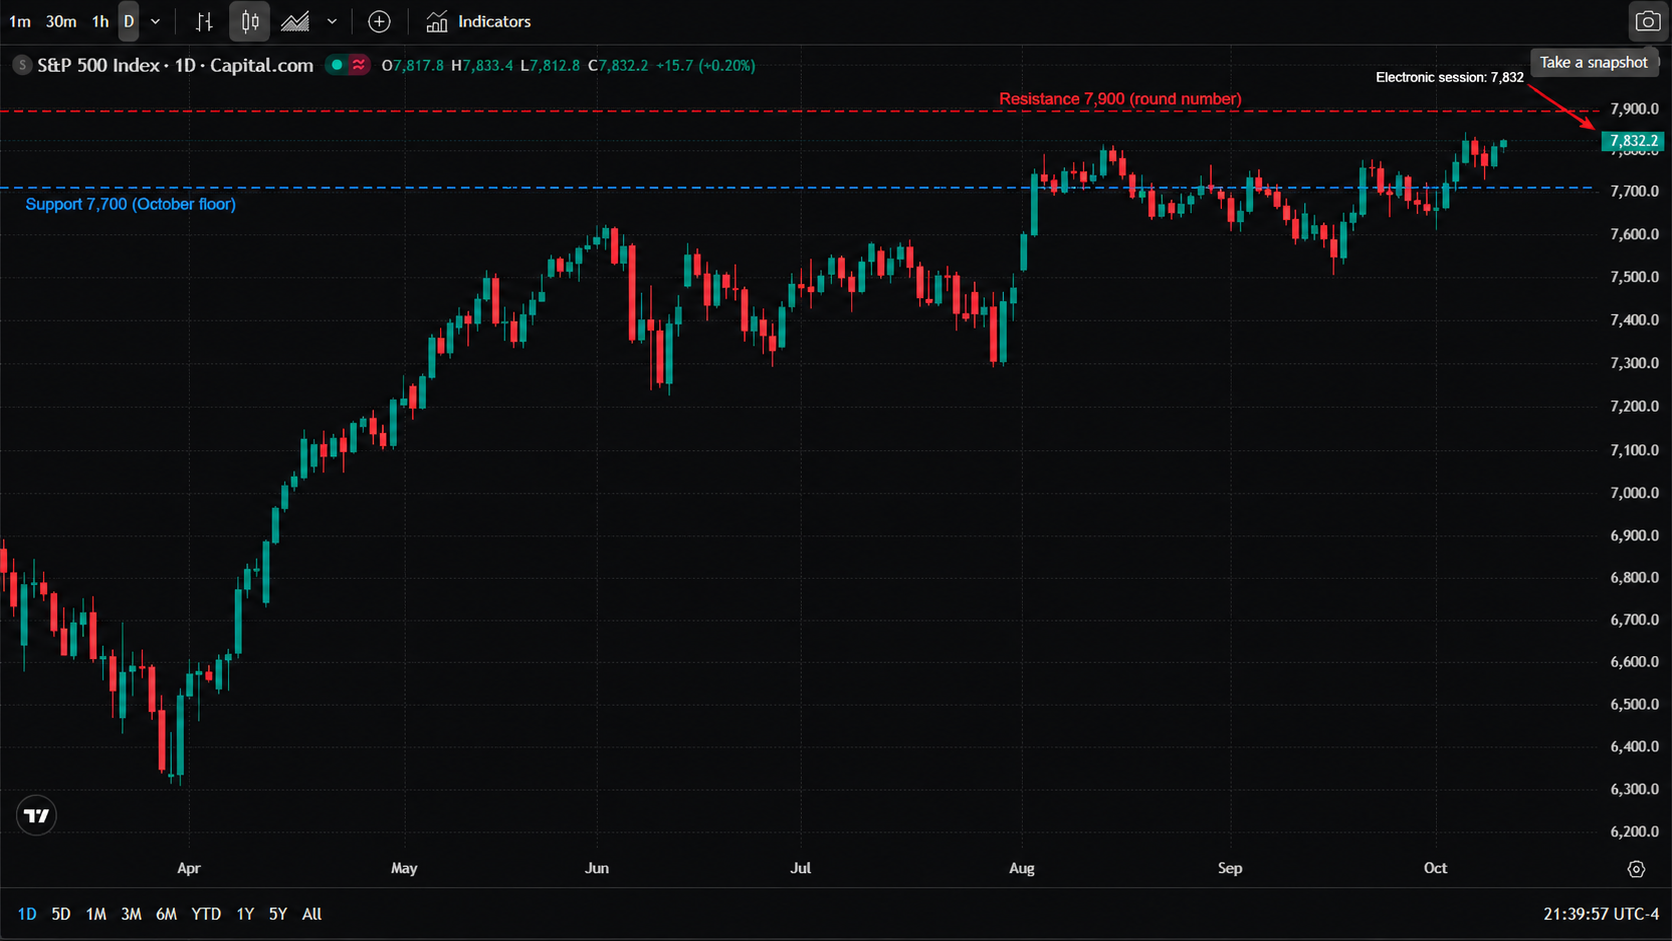
* Chart source: TradingView official chart screenshot, data source Capital.com (S&P 500 Index).
S&P 500 key levels. Support: 7,700 (the October floor) / 7,600 (August breakout zone) / 7,500 (summer range). Resistance: 7,818.93 (October 6 record close) / 7,844.52 (October 6 intraday record) / 7,900 (round number). The electronic tape near 7,832 means the record is a formality to clear if the banks cooperate — the real test is holding it.
JPMorgan key levels. Support: $325 (October low zone) / $320 (August breakout base). Resistance: $340 (September shelf) / $350 (round number, the level lost during the September slide).
The two scenarios
Scenario A — banks clear the bar. Trading revenue beats, provisions come in benign, and guidance frames the rate environment as manageable. Financials join the record run, breadth improves, and the S&P 500 converts its 7-point gap into a confirmed breakout through 7,818.93, opening 7,844.52 and then 7,900. A soft CPI the next morning would turn this into a broad risk-on week — exactly what a market that has been carried by tech alone needs.
Scenario B — the quarter disappoints where it counts. Card delinquencies creep up, trading revenue underwhelms against a high bar, or 2027 guidance turns cautious. The already-cheap banks sell off further — JPM losing $325 would confirm the August-peak downtrend — and the S&P 500 fails at the record for a third time, sliding back to 7,700. If Wednesday's CPI then runs hot, the "record in reach" setup flips into a double-top risk with yields and the dollar pressing from above.
The asymmetry worth noting: bank stocks have already de-rated (down 7.5% on the month into the print), so the bar for a positive surprise is lower than the index-level optimism suggests. The market is not paying for perfection in banks — it is paying for evidence that the credit cycle can survive these rates.
Read more
Before making any trading decisions, it is important to equip yourself with sufficient fundamental knowledge, have a comprehensive understanding of market trends, be aware of risks and hidden costs, carefully consider investment targets, level of experience, risk appetite, and seek professional advice if necessary.
Furthermore, the content of this article is solely the author's personal opinion and does not necessarily constitute investment advice. The content of this article is for reference purposes only, and readers should not use this article as a basis for any investment decisions.
Investors should not rely on this information as a substitute for independent judgment or make decisions solely based on this information. It does not constitute any trading activity and does not guarantee any profits in trading.
If you have any inquiries regarding the data, information, or content related to Mitrade in this article, please contact us via email: insights@mitrade.com. The Mitrade team will carefully review the content to continue improving the quality of the article.


