Dow drops 631 points as the Fed hikes — but futures are rebounding: what's next for US stocks?

coverImg
Source: DepositPhotos

US stocks closed lower Wednesday after the Federal Reserve delivered its first rate hike since July 2023, with the Dow falling 631 points (-1.21%) to 51,461.90 — at one point down more than 900 points intraday — and the S&P 500 slipping 0.45% to 7,551.81, its second straight decline and a close below 7,565 that marks a six-week low. The twist: Asia-session futures are already rebounding, with the S&P 500 CFD back at 7,607.8 (+0.55%). The question now is whether that bounce is real — and 7,500 is where the answer lives.

The session in numbers

IndexClose (16 Sep)Change
Dow Jones51,461.90-1.21%
S&P 5007,551.81-0.45%
Nasdaq Composite25,978.42-0.01%
VIX17.71+2.97%

Sector performance split sharply: energy fell 3.0% as Brent sank 2.7% to $105.83, financials lost 1.6%, while semiconductors held up — Intel gained more than 4% — and the tech-heavy Nasdaq Composite finished essentially flat.

Why it fell: the dot plot, not the hike

The 25bp hike to 3.75% ~ 4.00% was never the story — it was priced at roughly 90% going in. The damage came from what accompanied it:

  • The dot plot: 16 of 18 officials expect at least one more hike this year (12 saw one more, four saw two or a single 50bp move, only two saw none), lifting the median 2026 projection to 4.1% from 3.8% in June;

  • The projections: PCE inflation now seen at 3.7% for 2026, with a return to the 2% target pushed out to 2029; growth revised up to 2.3%;

  • The pricing: futures now assign roughly 50% odds to an October hike.

Adding to the pressure: August retail sales beat at +1.2% (versus +0.8% expected), with core sales up 1.4% — a resilient consumer that, counterintuitively, strengthens the case for more tightening. Core PPI, at +0.2%, offered the only softer note.
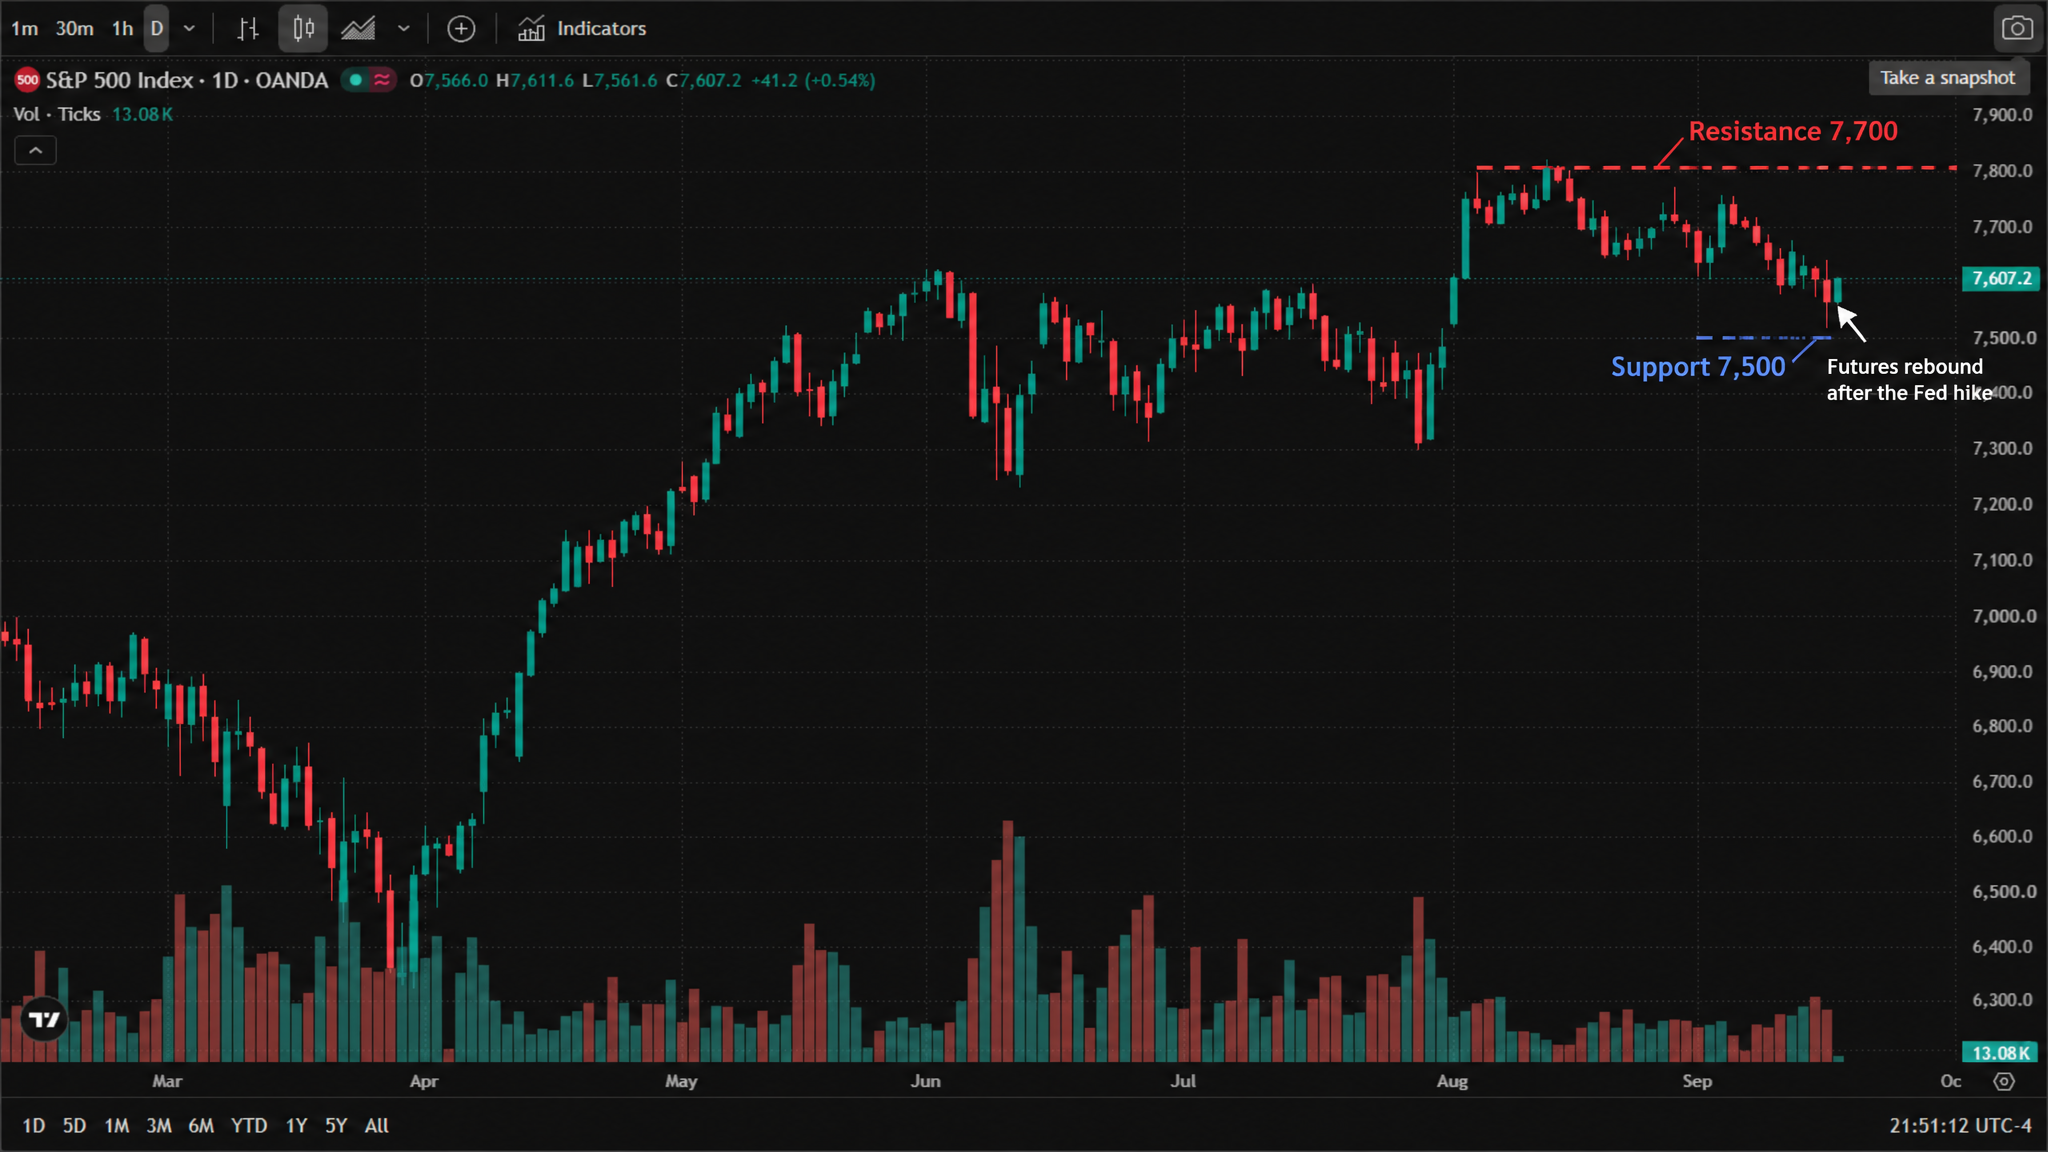
S&P 500 daily chart (official TradingView chart screenshot, OANDA data feed, real daily candles from March to September 2026) — the index bottomed near 6,300 in April, rallied through the spring and summer, peaked in the 7,800 area in August and pulled back through September toward 7,500; as of 17 September 2026, 09:46 (New York time), the CFD trades at 7,607.8, up 41.8 (+0.55%) on the session, after opening at 7,566.0 with a high of 7,611.6 and a low of 7,561.6. The annotated version adds "Support 7,500" and "Resistance 7,700" dashed lines and an arrow marking the post-decision bounce.

* Chart source: official TradingView chart screenshot, OANDA data feed (S&P 500 index CFD), captured 17 September 2026, 09:46 am (New York time).
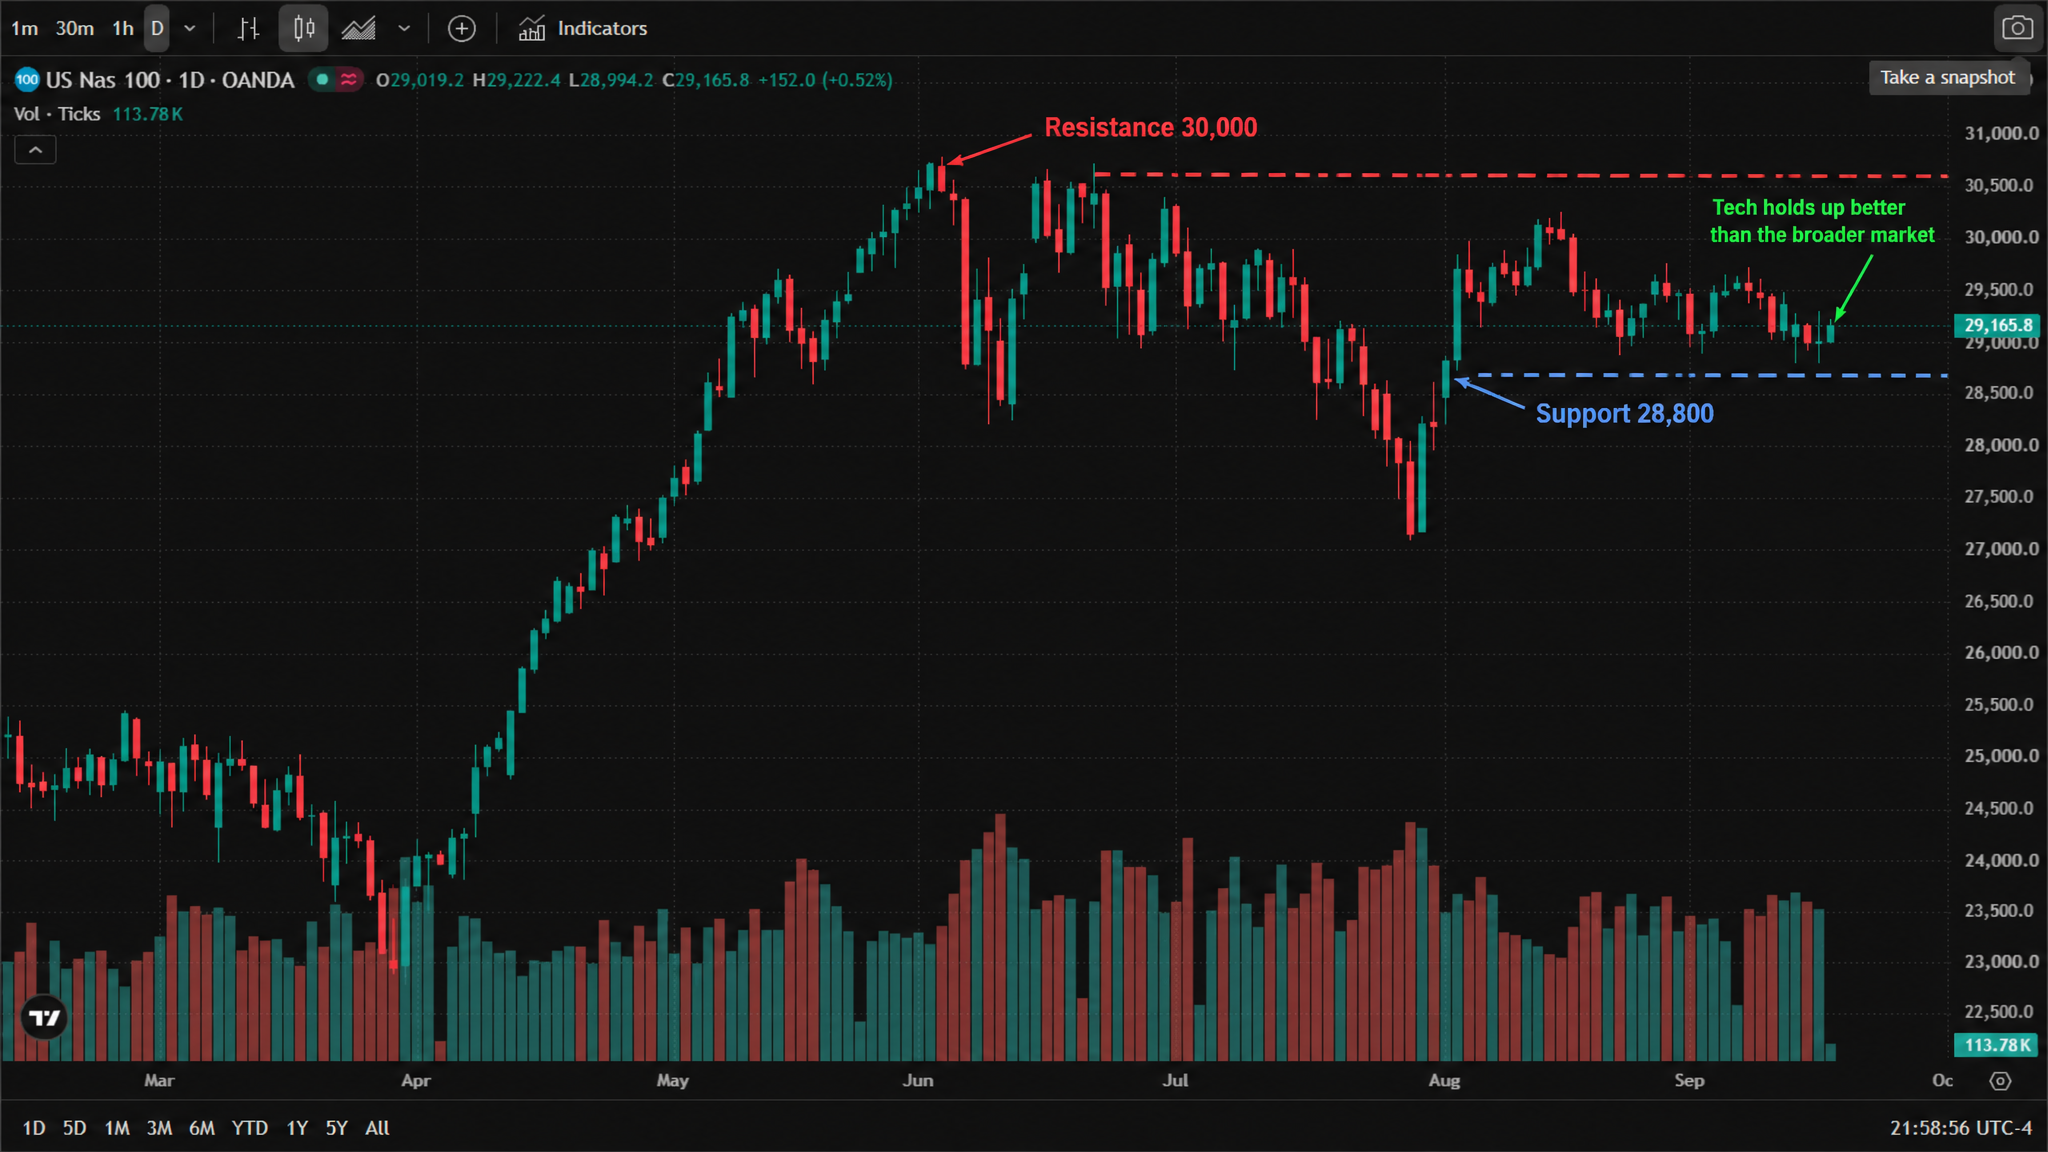

Nasdaq 100 daily chart (official TradingView chart screenshot, OANDA data feed, real daily candles from March to September 2026) — the index fell below 24,000 in April, rallied to a peak near 30,500 in June, consolidated in the 27,000-30,500 range through July and August, and eased back toward 29,000 in September; as of 17 September 2026, 09:49 (New York time), the CFD trades at 29,186.2, up 172.4 (+0.59%) on the session, after opening at 29,019.2 with a high of 29,222.4 and a low of 28,994.2. The annotated version adds "Support 28,800" and "Resistance 30,000" dashed lines and an arrow marking tech's relative resilience.

* Chart source: official TradingView chart screenshot, OANDA data feed (Nasdaq 100 index CFD), captured 17 September 2026, 09:49 am (New York time).

Technicals: 7,500 is the line in the sand

The structure has weakened — a 50/200-day moving average death cross has formed — and analysts broadly agree on where the battleground sits:

  • Support: 7,503 ~ 7,500 (this former resistance, now the pivotal floor), then 7,400, with a break opening 7,314 ~ 7,294, the 200-day average near 7,200, and potentially 7,000;

  • Resistance: 7,600 (just lost), the 50-day average near 7,610, then 7,700; a decisive close above 7,760 ~ 7,770 would confirm a bullish flag.

The sell-side views bracket the range: BofA's technical strategist Paul Ciana says the longer-term uptrend stays intact as long as 7,504 ~ 7,500 holds — with the bank's long-term targets above 8,000 — but calls a break below a "major technical breakdown." Barron's, citing chart work, frames a September close in the 7,500 area as an ordinary 5% pullback that could turn the old ceiling into "a solid floor" before a Q4 rally. On the bearish side, BofA's chief equity strategist Savita Subramanian keeps a 7,400 year-end target — among the lowest on the Street — and warns the market is "overdue for a pullback." Bulls like Tallbacken's Michael Purves (year-end 8,500) point to earnings strength as the offset.

What to watch

  • 08:30 ET today: initial jobless claims (208K expected, 206K prior) — the first labour-market read since the hike;

  • Earnings: FedEx and Nike report today, offering the first corporate evidence on whether the real economy can carry higher-for-longer rates;

  • The bigger picture: with October hike odds near 50% and 2% inflation deferred to 2029, every data point between now and the next FOMC becomes a referendum on the 7,500 floor.

Related reads: for the currency side of the Fed decision, see Dollar index tops 100 for the first time since July; for the set-up into this decision, see Hot August jobs report reignites Fed-hike bets.

Read more

  • September Fed Rate Decision Preview: Is a Rate Hike a Foregone Conclusion? US Stocks, Dollar, and Gold Face a Critical Test
  • Silver breaks $64 as precious metals rebound — can gold hold the $4,280 line into the Fed decision?
  • Bitcoin falls below $75,000 as the CLARITY Act fails in the Senate — what the vote means for crypto
  • Gold falls below $4,300 as higher US yields bolster Fed rate hike bets
  • Bitcoin Falls Below $75,000, Crypto Stocks Plunge as Clarity Act Vote Fails
  • Note: If you want to share the article 《Dow drops 631 points as the Fed hikes — but futures are rebounding: what's next for US stocks?》, make sure you retain the original link. For more information, please visit Insights or browse www.mitrade.com.


    Before making any trading decisions, it is important to equip yourself with sufficient fundamental knowledge, have a comprehensive understanding of market trends, be aware of risks and hidden costs, carefully consider investment targets, level of experience, risk appetite, and seek professional advice if necessary.


    Furthermore, the content of this article is solely the author's personal opinion and does not necessarily constitute investment advice. The content of this article is for reference purposes only, and readers should not use this article as a basis for any investment decisions.


    Investors should not rely on this information as a substitute for independent judgment or make decisions solely based on this information. It does not constitute any trading activity and does not guarantee any profits in trading.


    If you have any inquiries regarding the data, information, or content related to Mitrade in this article, please contact us via email: insights@mitrade.com. The Mitrade team will carefully review the content to continue improving the quality of the article.


    goTop
    quote
    Related Articles
    placeholder
    TradingKey Daily Market Briefing: Fed Raises Rates by 25 Bps, May Hike Again This Year; Gold Tumbles as Intel Rises 4%On September 16, Eastern Time, US stocks rose before pulling back following the Federal Reserve's rate decision announcement for September. The Fed unanimously decid
    Author  TradingKey
    1 hour ago
    On September 16, Eastern Time, US stocks rose before pulling back following the Federal Reserve's rate decision announcement for September. The Fed unanimously decid
    placeholder
    September Fed Rate Decision Preview: Is a Rate Hike a Foregone Conclusion? US Stocks, Dollar, and Gold Face a Critical TestThe Federal Reserve will announce its September interest rate decision at 2:00 p.m. ET on Wednesday (September 16), followed by a press conference held by Fed Chair Kevin Warsh at 2:30 p.
    Author  TradingKey
    17 hours ago
    The Federal Reserve will announce its September interest rate decision at 2:00 p.m. ET on Wednesday (September 16), followed by a press conference held by Fed Chair Kevin Warsh at 2:30 p.
    placeholder
    TradingKey Daily Market Briefing: CPI Data Boosts Rate Hike Expectations, Geopolitical Risks Spark Oil Price SurgeTracking Market TrendsTradingKey - The three major U.S. stock indices rose across the board last Friday, with the Dow Jones Industrial Average rising 0.98%, the Nasdaq Composite Index gaining 0.96%, a
    Author  TradingKey
    Sep 14, Mon
    Tracking Market TrendsTradingKey - The three major U.S. stock indices rose across the board last Friday, with the Dow Jones Industrial Average rising 0.98%, the Nasdaq Composite Index gaining 0.96%, a
    placeholder
    TradingKey Daily Market Briefing: WTI Oil Tops $100, US Stocks Fall for 4th Day, Apple Bucks Trend, CPI AheadTracking Market TrendsTradingKey - On September 10 Eastern Time, the three major US stock indices fell for the fourth consecutive trading day. US August PPI showed upstream price pressures continued t
    Author  TradingKey
    Sep 11, Fri
    Tracking Market TrendsTradingKey - On September 10 Eastern Time, the three major US stock indices fell for the fourth consecutive trading day. US August PPI showed upstream price pressures continued t
    placeholder
    US August PPI Preview: Producer Inflation May Reaccelerate, How Will US Stocks, Dollar, and Gold React?The U.S. Bureau of Labor Statistics will release the August Producer Price Index (PPI) at 8:30 a.m. ET on September 10. Against the backdrop of U.S. August non-farm payrolls significantly
    Author  TradingKey
    Sep 09, Wed
    The U.S. Bureau of Labor Statistics will release the August Producer Price Index (PPI) at 8:30 a.m. ET on September 10. Against the backdrop of U.S. August non-farm payrolls significantly
    Live Quotes
    Name / SymbolChart% Change / Price
    US500
    US500
    0.00%0.00
    NAS100
    NAS100
    0.00%0.00

    US Stocks Related Articles

    • 10 Best Day Trading Platforms for Beginners and Active Traders in 2026: A Practical Guide
    • How To Invest in SpaceX Stock in 2026? Everything Investors Need to Know
    • Practice Trading Us Stocks? These Are 10 Best Stock Trading Demo Apps For Beginners
    • ​5 Best Paper Trading Platforms for 2026 (Free Demo Accounts for Beginners & Traders)
    • Wall Street’s Top 10 US Stocks for 2026 vs What Reddit Is Actually Buying
    • Is Mitrade Right for You? A Complete Guide on How to Start Trading CFDs in 5 Steps

    Click to view more