


【Daily Brief】30-year Treasury tops 5.59%, S&P 500 slips to 7,670 and gold holds $4,180 — PCE lands tonight

Mitrade Insights — Three numbers frame today's session: the 30-year Treasury yield closed at 5.59%, the S&P 500 fell to 7,670.84, and gold is holding near $4,180 an ounce. All three are the same trade. Long-end yields have risen for six consecutive sessions and are now at their highest level since 2002, and every asset that depends on the opportunity cost of holding something non-yielding — equities at a stretched multiple, gold, silver — is being repriced against that number. The only event that can settle the question is August PCE, released at 8:30am ET tonight alongside Q3 GDP.
Data as of the US close on 29 September 2026 and the Asia session on 30 September 2026. Index levels are cash closes; chart sources are noted under each figure.
The long end is doing something unusual
The US Treasury's official daily par yield curve on 29 September closed at 4.89% (2-year), 5.06% (5-year), 5.26% (10-year), 5.64% (20-year) and 5.59% (30-year). The 30-year touched 5.6206% intraday — the highest since June 2002.
The composition matters more than the level. Between 22 and 29 September the 10-year rose 30bp, the 20-year 31bp and the 30-year 30bp, while the 2-year went nowhere (4.71% to 4.89% over the wider window, and it actually fell on 29 September). That is not a recession trade, where front-end yields rally and the long end rebounds. This is the long end steepening on its own, and the driver is a repricing of long-run fiscal and inflation risk — an energy-inflation impulse from the Middle East conflict, US debt and deficit expansion, and the AI capital-expenditure cycle.
Equities: a second straight down day, financials leading lower
| Index | Close (29 Sep) | Change |
|---|---|---|
| Dow Jones Industrial Average | 51,349.92 | −131.59 (−0.26%) |
| S&P 500 | 7,670.84 | −12.85 (−0.17%) |
| Nasdaq Composite | 26,797.54 | −22.84 (−0.09%) |
| Russell 2000 | 2,807.92 | −9.99 (−0.4%) |
Financials led the decline (XLF −0.5%, with Goldman Sachs around −1% and JPMorgan, Morgan Stanley and Bank of America all lower), and the Russell 2000 underperformed at −0.4%. The losses were modest in size but concentrated in the final hour, which is the signature of positioning ahead of a binary data print rather than a change in narrative.
Asia on 30 September did not confirm the risk-off tone. The Nikkei 225 rose 1.14% to 66,224.34, the Shanghai Composite added 0.36% to 3,844.35, and the Hang Seng slipped only 0.29% to 24,453.14. Australia is the outlier worth flagging for a global audience: the RBA hiked 25bp to 4.60% — a 15-year high — and the S&P/ASX 200 still rose roughly 0.8% to 8,778, its highest level since 10 September, even as the Australian dollar fell to a two-month low.
Two same-day data releases made the picture internally contradictory, and that contradiction is the story. The Conference Board consumer confidence index fell to 81.9 from 88.6 — the weakest reading since 2014 — with households expecting conditions to worsen over the next six months. JOLTS job openings fell to 7.1 million, a five-month low. Both point to demand destruction. Yet the Fed raised rates by 25bp to 3.75–4.00% on 16 September on a 12–0 vote, explicitly citing "elevated inflation" and a "timely return to the 2 percent goal".
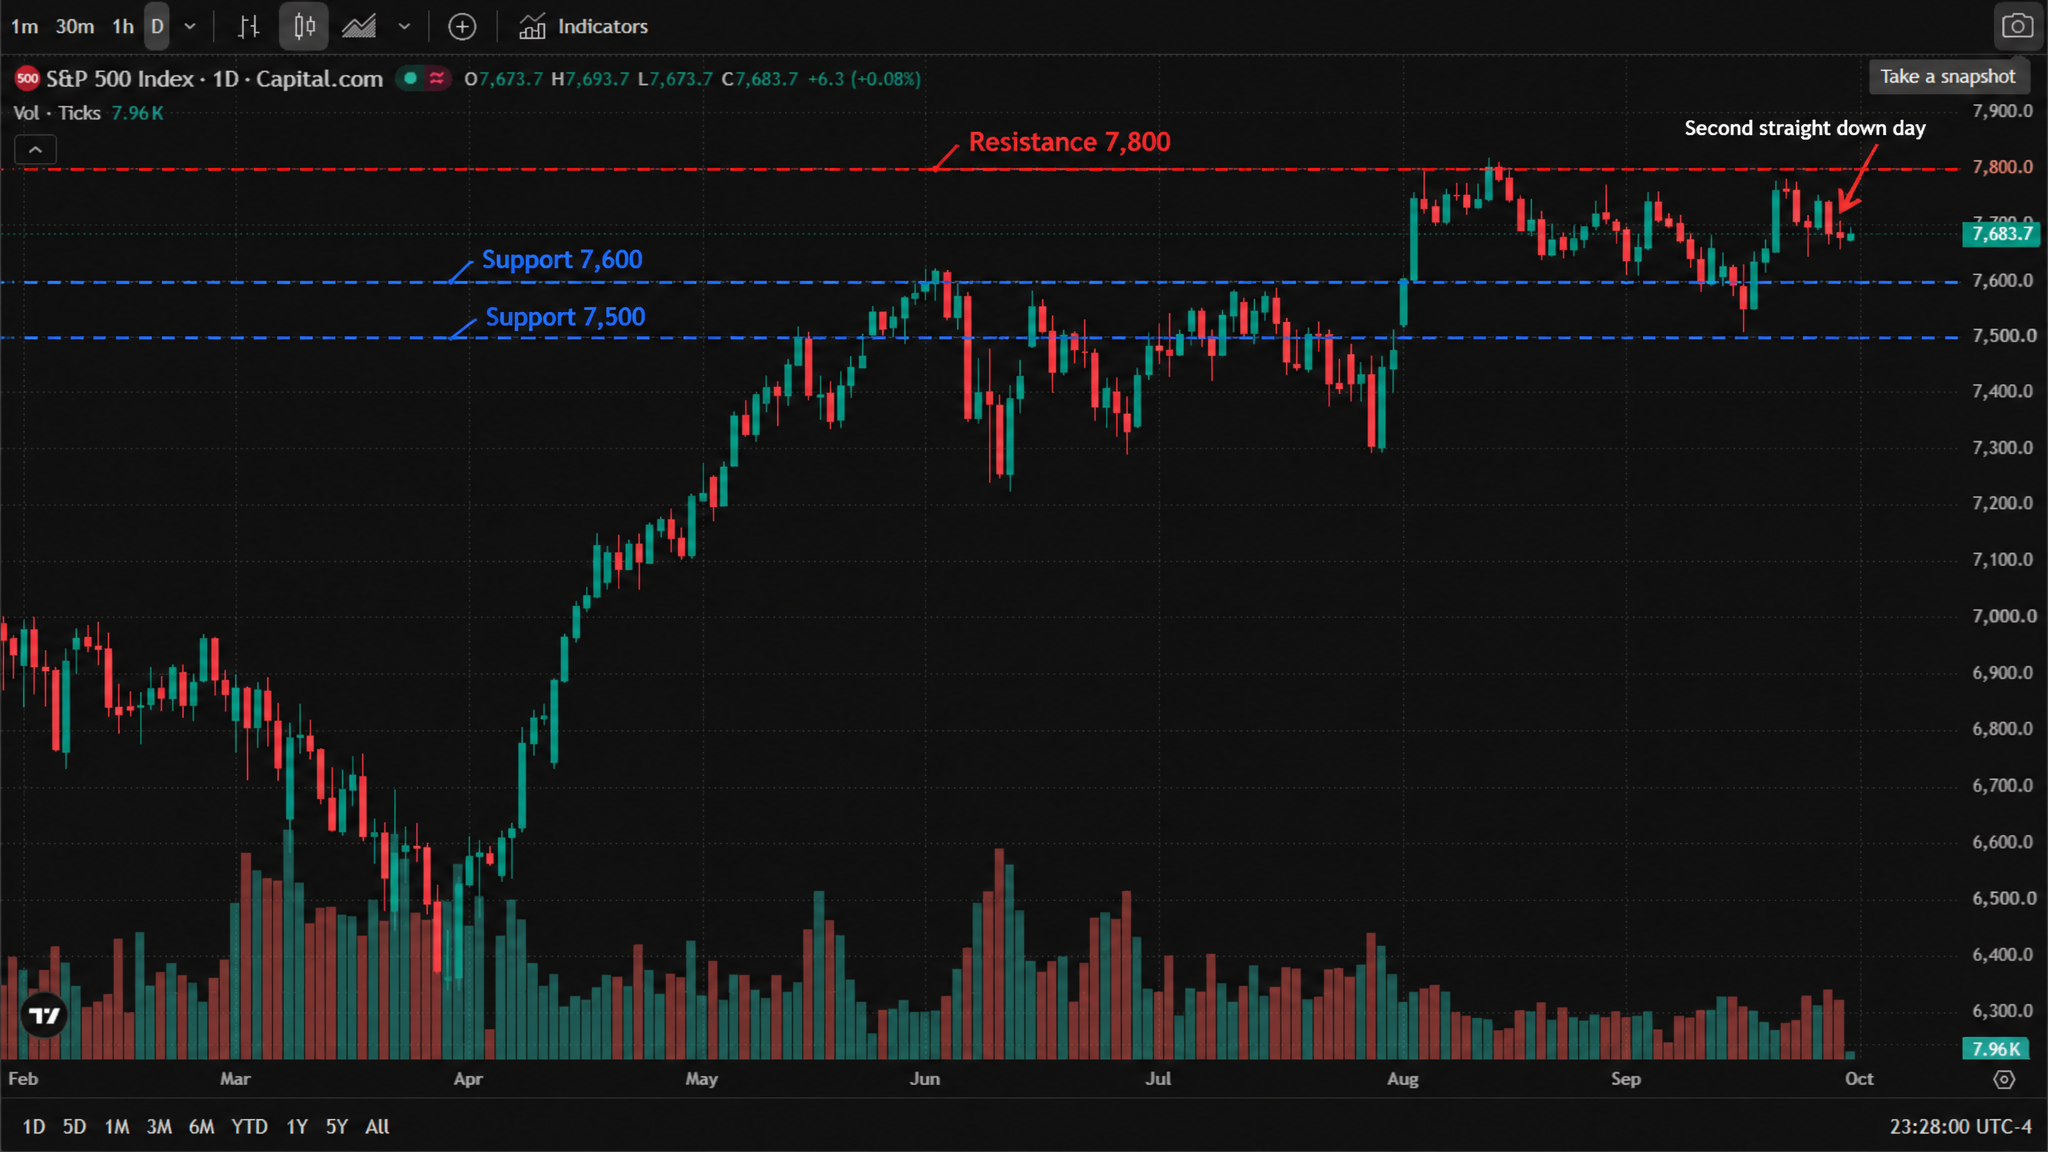
* Chart source: TradingView official chart screenshot, data provider Capital.com (S&P 500 difference contract).
Gold and oil: the no-yield complex gets marked down
Spot gold traded around $4,179 an ounce in the Asia session on 30 September, roughly 6% below its early-September level, after touching $4,143.10 intraday on 28 September — the weakest print since early July. Silver was last at $61.12, near a two-month low. The mechanism is straightforward: a 30-year yield at a 24-year high raises the hurdle rate on holding a zero-coupon asset, and gold and silver share that hurdle.
Crude has been falling for a different reason and is now working against inflation. WTI's November contract settled at $89.38 on 29 September, down 3.48% and the lowest since 31 August, after Saudi Arabia restored export capacity through its East–West pipeline and tanker traffic through the Strait of Hormuz increased.
One measurement note, because it is easy to get wrong. Brent's front-month contract rolls this week. The $102.59 printed for 29 September was the expiring November contract; the new front month trades near $96 while December trades at $103.18 — a backwardation of roughly $7 a month, which prices continuing supply risk rather than a collapse in demand. The honest statement is that Brent is roughly flat on the day, not down 6%.
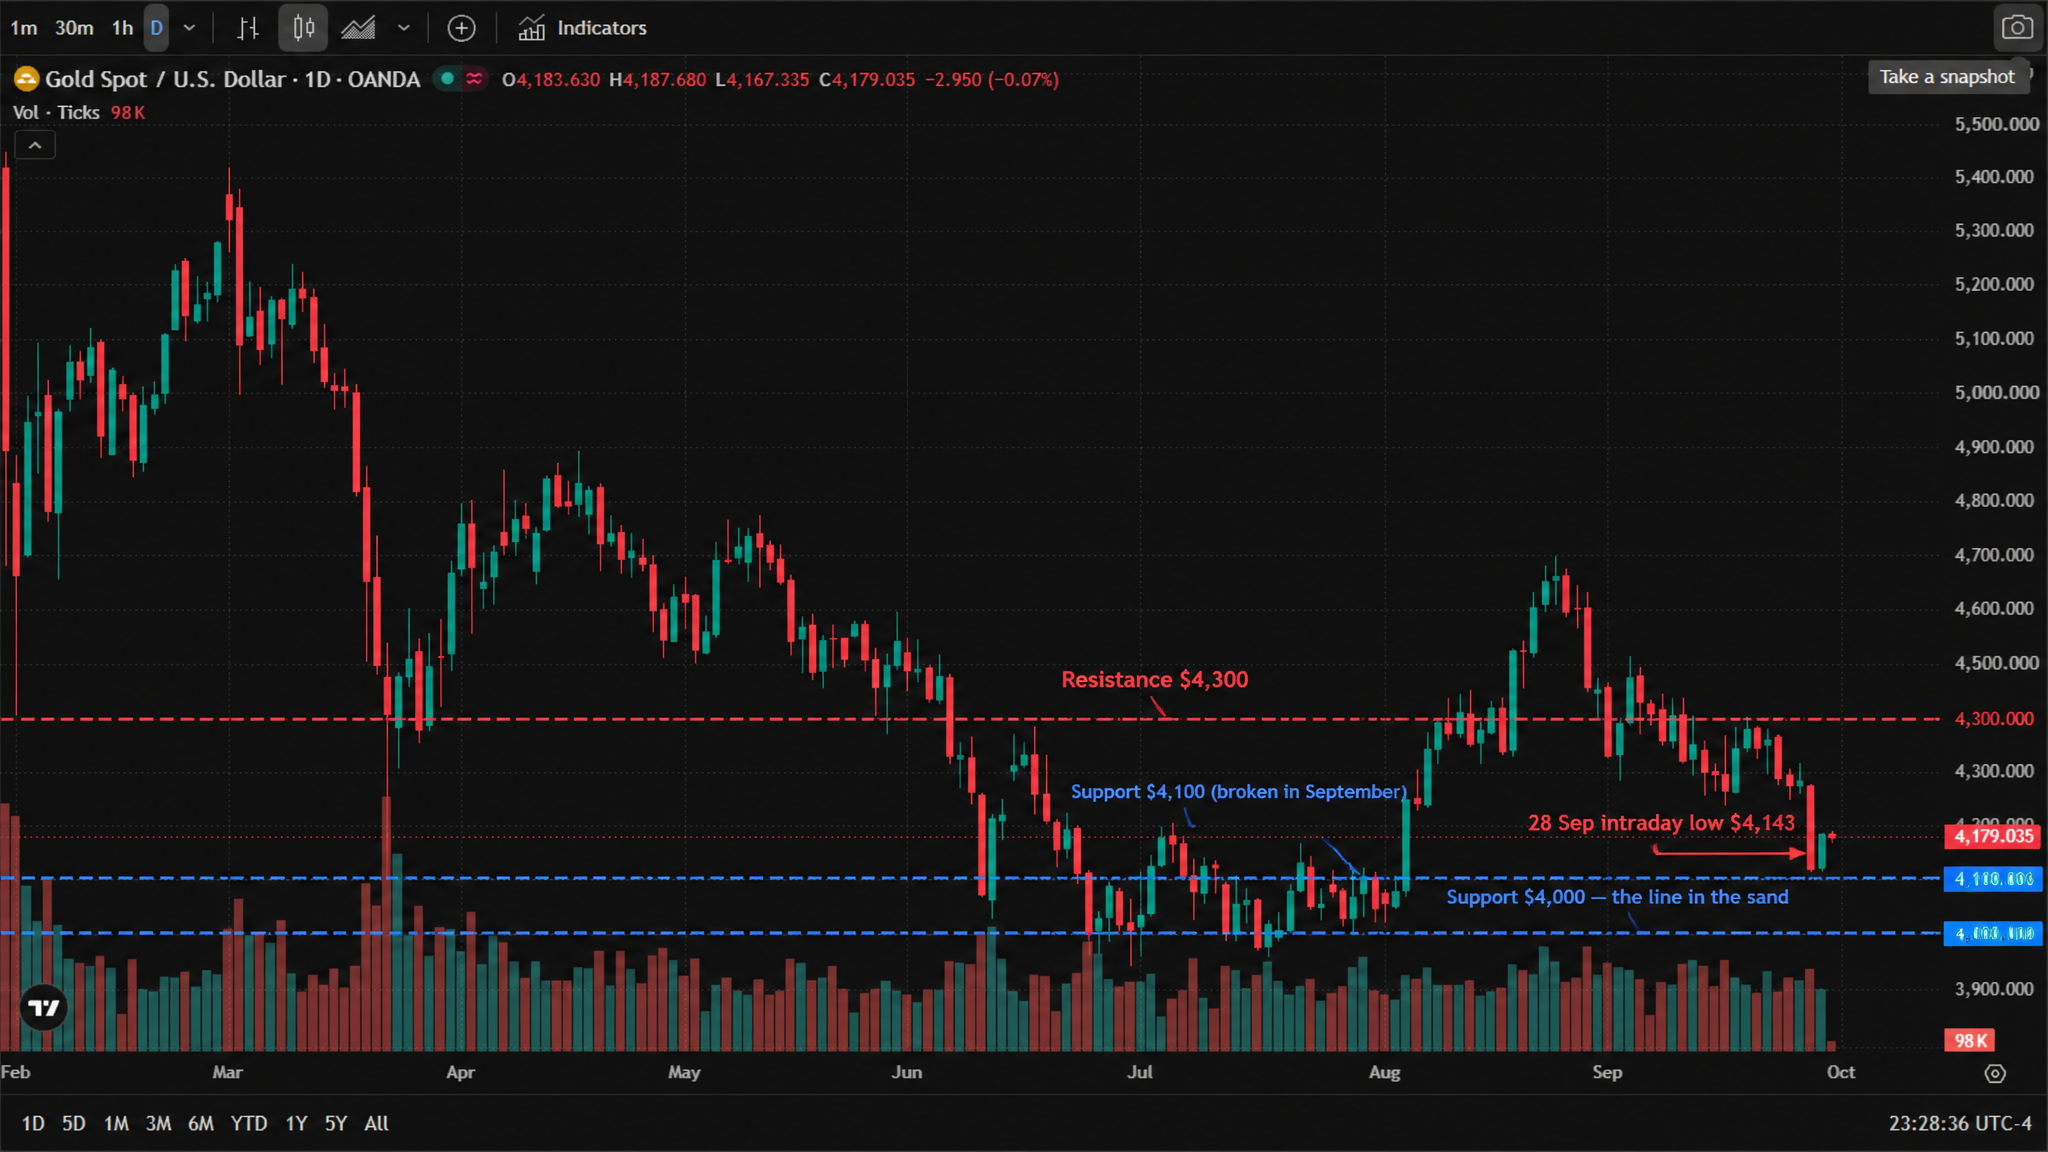
* Chart source: TradingView official chart screenshot, data provider OANDA (spot gold).
Crypto is the one place where flows disagree with price
Bitcoin trades at $83,386, still roughly 4.5% below its 21 September high of $87,364, and has now spent six sessions inside an $82,500–$85,000 range with the 100- and 200-hour moving averages clustered around $84,000. Yet US spot bitcoin ETFs have absorbed $2.77 billion across seven consecutive sessions, and altcoin spot volume has climbed to nearly four times bitcoin's on a seven-day basis — the highest relative reading since September 2025.
Price flat, ETF inflows strong, and rotation accelerating inside the market is a different setup from either risk-on or risk-off. It says capital is not leaving crypto; it is rearranging.
Tonight's calendar: one event decides the week
8:30am ET — US August Personal Income and Outlays (PCE) and Q3 GDP. Consensus is for headline PCE to rise 0.5% month on month (from 0.4%) and core PCE to rise 0.3% (from 0.2%); the Cleveland Fed nowcast puts core at 0.27% month on month and 3.40% year on year, against 3.3% in July. Headline PCE has been stuck in a 3.0–3.7% band all year against a 2% target.
Three paths, and they are not equally likely to be quiet:
Core at or below 0.2%, or a downward revision — the first genuine positive catalyst gold has had in weeks. October hike odds fall, real yields ease, the no-yield complex rallies.
In line with 0.3% — little new information. The "higher for longer" narrative persists and the tape stays range-bound.
Core at 0.3% or above — confirms the October case. Yields go higher, the long end extends its run, and gold retests $4,150 then $4,000.
Two further releases matter for the back half of the week: initial jobless claims and ISM manufacturing PMI on 1 October, and September non-farm payrolls on 2 October — the last major input before the 27–28 October FOMC meeting. Note also that on 30 September the calendar carries ADP national employment at 8:15am ET and the final Q3 GDP print alongside PCE.
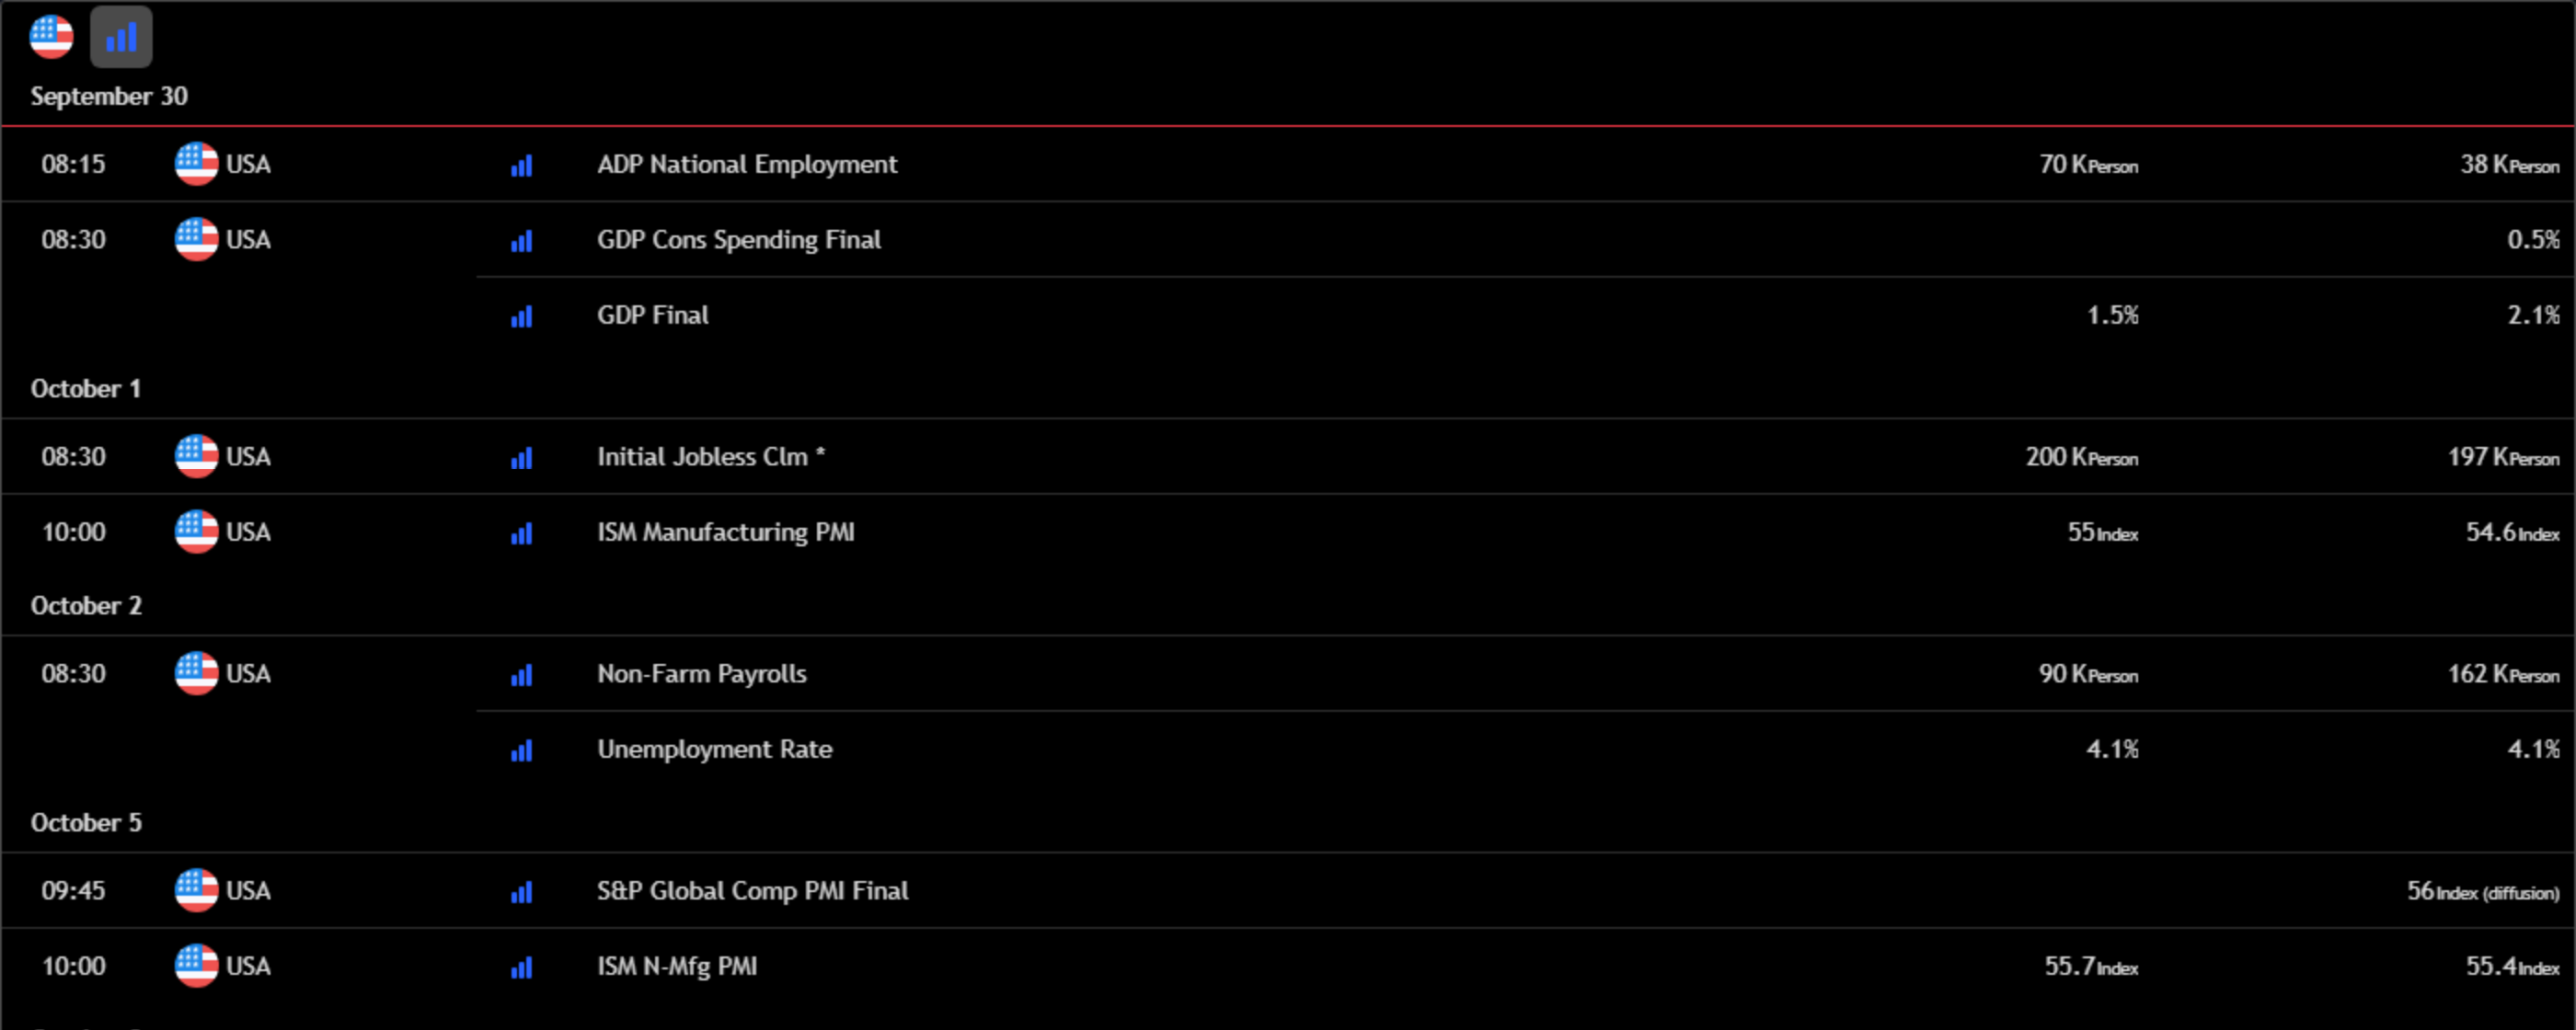
* Chart source: TradingView official economic calendar widget, US high-importance filter, times shown in US Eastern.
One methodological warning. The Bureau of Economic Analysis publishes its 2026 annual index update on the same morning, rewriting the series back to the first quarter of 2021 and replacing three deflators. Portfolio management alone accounted for roughly half of July's core increase. Comparisons of August against July therefore have to use the revised July figure on the new methodology — a headline that reads "inflation eased" may be a definitional artefact rather than a real change.
Read more
* The content presented above, whether from a third party or not, is considered as general advice only. This article should not be construed as containing investment advice, investment recommendations, an offer of or solicitation for any transactions in financial instruments.


