


【Daily Brief】10-year Treasury yield briefly tops 5%, S&P 500 slips to 7,602 and the dollar firms at 99.3 as the Fed's decision eve begins

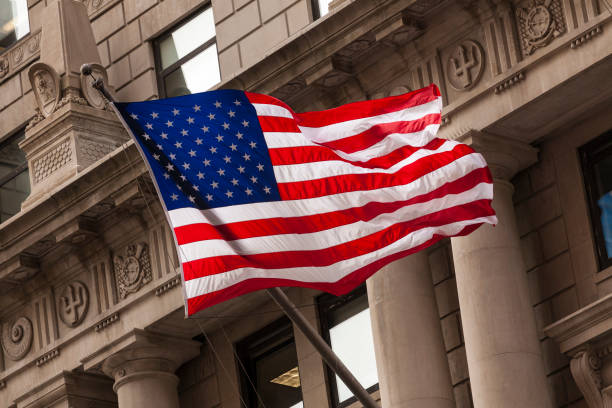
Wall Street closed lower, the dollar firmed and the 10-year Treasury yield briefly broke through 5% for the first time since October 2023 — all on the eve of a Federal Reserve decision that markets have almost fully priced as a hike. Here is everything that mattered overnight, and everything that matters today.
Market wrap: a decision eve priced to the hilt
The Fed's two-day meeting began today. The rate decision lands Wednesday 16 September at 2:00 pm ET, followed by the updated Summary of Economic Projections — including the dot plot — and Chair Kevin Warsh's press conference at 2:30 pm ET. CME FedWatch has held a 25-basis-point hike at roughly 85% ~ 93% depending on the vintage, with Kalshi near 83% and a post-CPI Reuters poll showing 86 of 101 economists expecting a move. A hike would lift the fed funds target range from 3.50% ~ 3.75% to 3.75% ~ 4.00% — the first increase since July 2023.
Because the hike itself is priced, the dot plot is the real event. Futures imply a terminal rate near 4.56%, close to three further increases after September. A median end-2026 projection of 4.375% or higher would validate that path and could open a test of 100 on the dollar index. A median of 4.125% or below would read as one-and-done and would likely trigger a sharper dollar decline. Sell-side views on the path diverge:
| Institution | September 16 | Beyond September | Year-end 2026 dot median |
|---|---|---|---|
| HSBC | 25bp hike | Possible further move in October or December | 4.125% |
| Citi | 25bp hike — a "dovish hike" | One more in total | Core PCE median trimmed to ~3% |
| Bank of America | 25bp hike | Two more, to 4.25% ~ 4.50% | — |
Bond markets spent Monday testing the hawkish case. The 10-year yield touched 5.014% intraday before easing to about 4.947%, and the 30-year sat near 5.36%. The move followed an August CPI report that showed headline inflation at 3.4% year on year with the core measure up 0.3% month on month — above consensus — on top of a 5.4% PPI print and an oil complex that keeps feeding the reflation trade.
Oil was the second pressure point. Brent settled above $107 after attacks shut a key Saudi east-west pipeline, with as much as 4% of global supply at risk and Hormuz throughput running near a fifth of pre-conflict levels. The IEA widened its 2026 supply-demand gap and put effective OPEC+ spare capacity at just 1.09 million barrels a day. Higher crude pushes inflation expectations higher, which in turn reinforces hike pricing — the loop that has kept a lid on gold even as geopolitical risk rises.
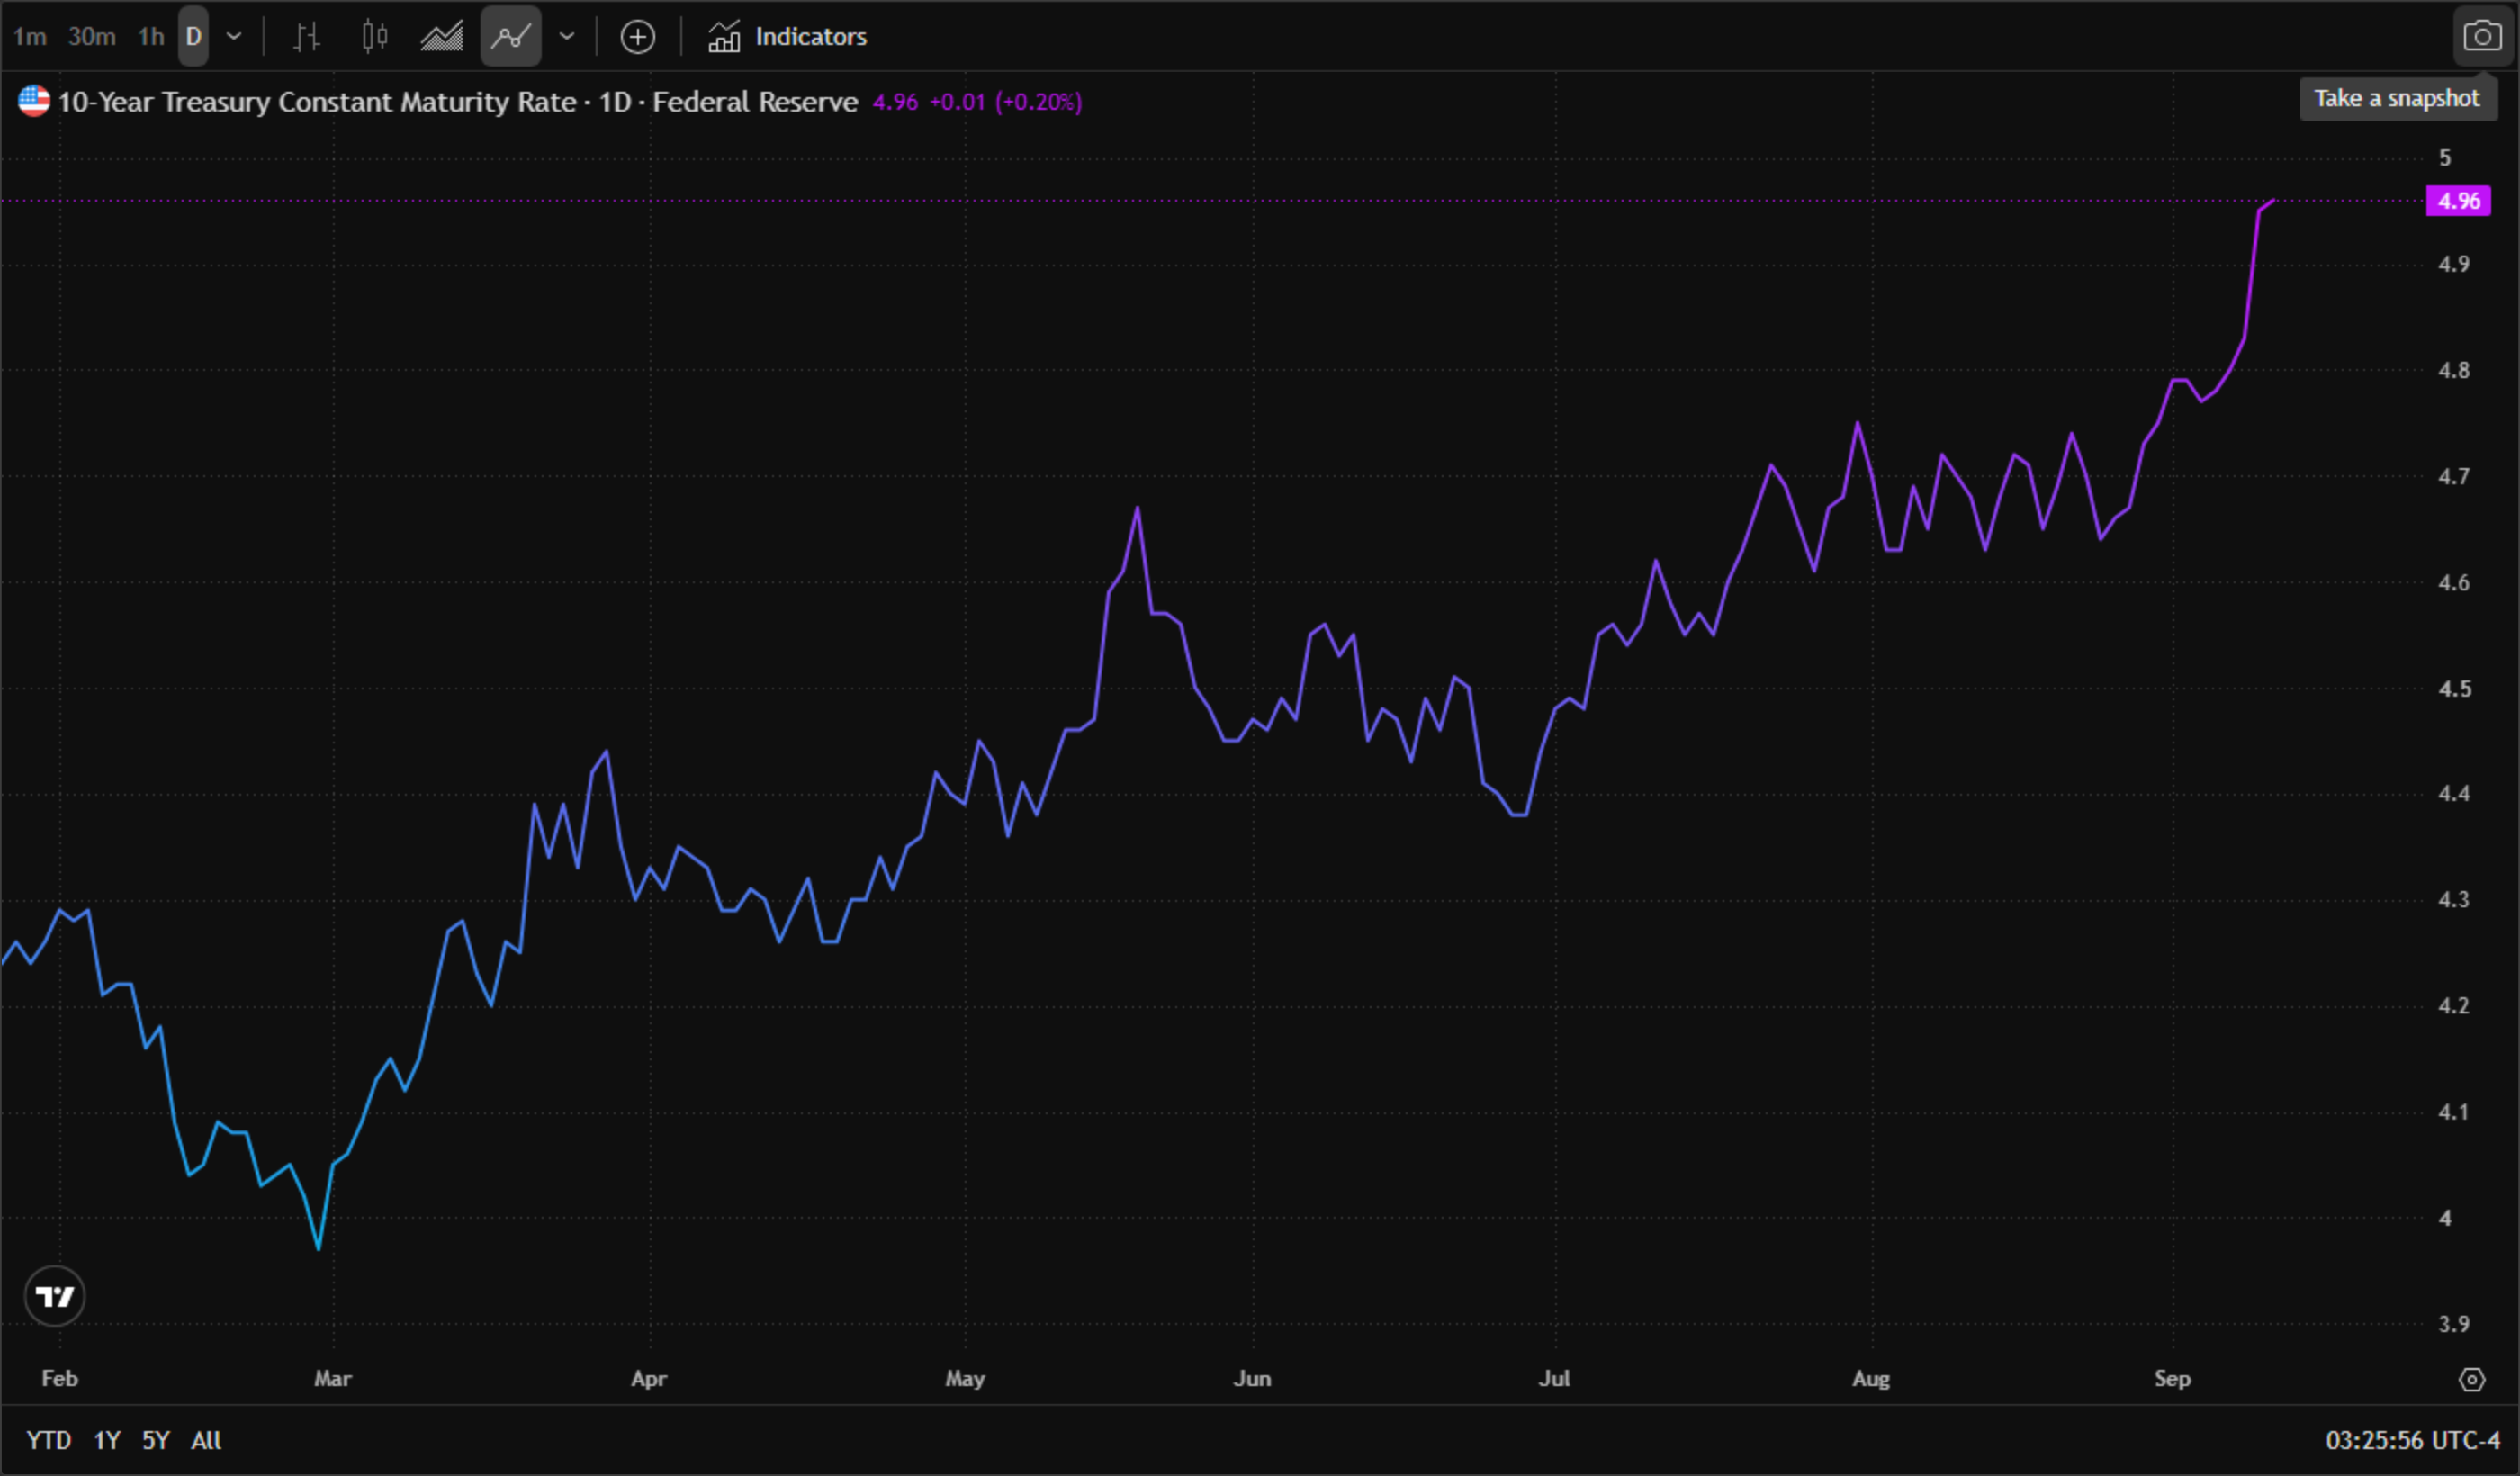
* Chart source: official TradingView chart screenshot, Federal Reserve (FRED) data series, as of 15 September 2026, 3:24 am ET.
Where the hike odds went. The repricing has been violent and one-directional: CME FedWatch odds of a 25bp move at the September 16 meeting ran from roughly 48% in mid-August to 86% ~ 91% after the August CPI and PPI prints, with a post-CPI Reuters poll showing 86 of 101 economists aligned.
Market snapshot by asset class
US equities — S&P 500 closed -0.48% at 7,619.98; Nasdaq Composite -0.56% at 26,186.41; Nasdaq 100 -0.82% at 29,127.16; Dow -0.29% at 52,421.20; Russell 2000 -0.4%; VIX 17.10 (+7.95%). Futures were steady into Tuesday.
Semiconductors — the Philadelphia Semiconductor Index fell 5.86%, its worst session since July, with Nvidia -3.36%, Intel -5.59%, AMD -4.40%, Marvell -7.32%, Corning -13.62% and Teradyne -13.30%.
Cybersecurity and software — the mirror image: CrowdStrike +13.85%, Palo Alto Networks +13.09%, Zscaler +16.49%, Tenable +16.53%, Rubrik +15.82%, Netskope +15.65%.
Rates — 10-year yield touched 5.014% intraday, last near 4.95%; 30-year around 5.36%; 2-year 4.64% ~ 4.66%.
FX — dollar index 99.34 (+0.15%), having peaked at 99.735 on Monday, its highest since 2 September. EUR/USD slipped to a one-month low near 1.1537; GBP/USD around 1.3485 ~ 1.3497; USD/JPY near 153.4 ~ 154.2 as the yen pulled back from a seven-month high.
Commodities — Brent $107.69 (+1.15%), WTI $103.33 (+1.42%); spot gold $4,288.06 (-0.27%) after Monday's 1.2% slide to $4,298.43 and an intraday low around $4,253; silver near $63, testing the neckline of a head-and-shoulders pattern at its 50-day moving average of $62; Dutch TTF gas at €82.5/MWh (+3.8%), a high last seen in December 2022.
Crypto — Bitcoin $77,642 ~ $78,700, Ethereum $2,476 ~ $2,505. US spot Bitcoin ETFs have now seen four consecutive sessions of outflows totalling about $463 million.
Asia — Nikkei 225 +0.93% at 64,082, lifted by SoftBank Group rebounding 7% ~ 9%; Hang Seng -0.23% at 24,859; Shanghai Composite around 3,878 ~ 3,890; ASX 200 -0.70% ~ -0.79%.
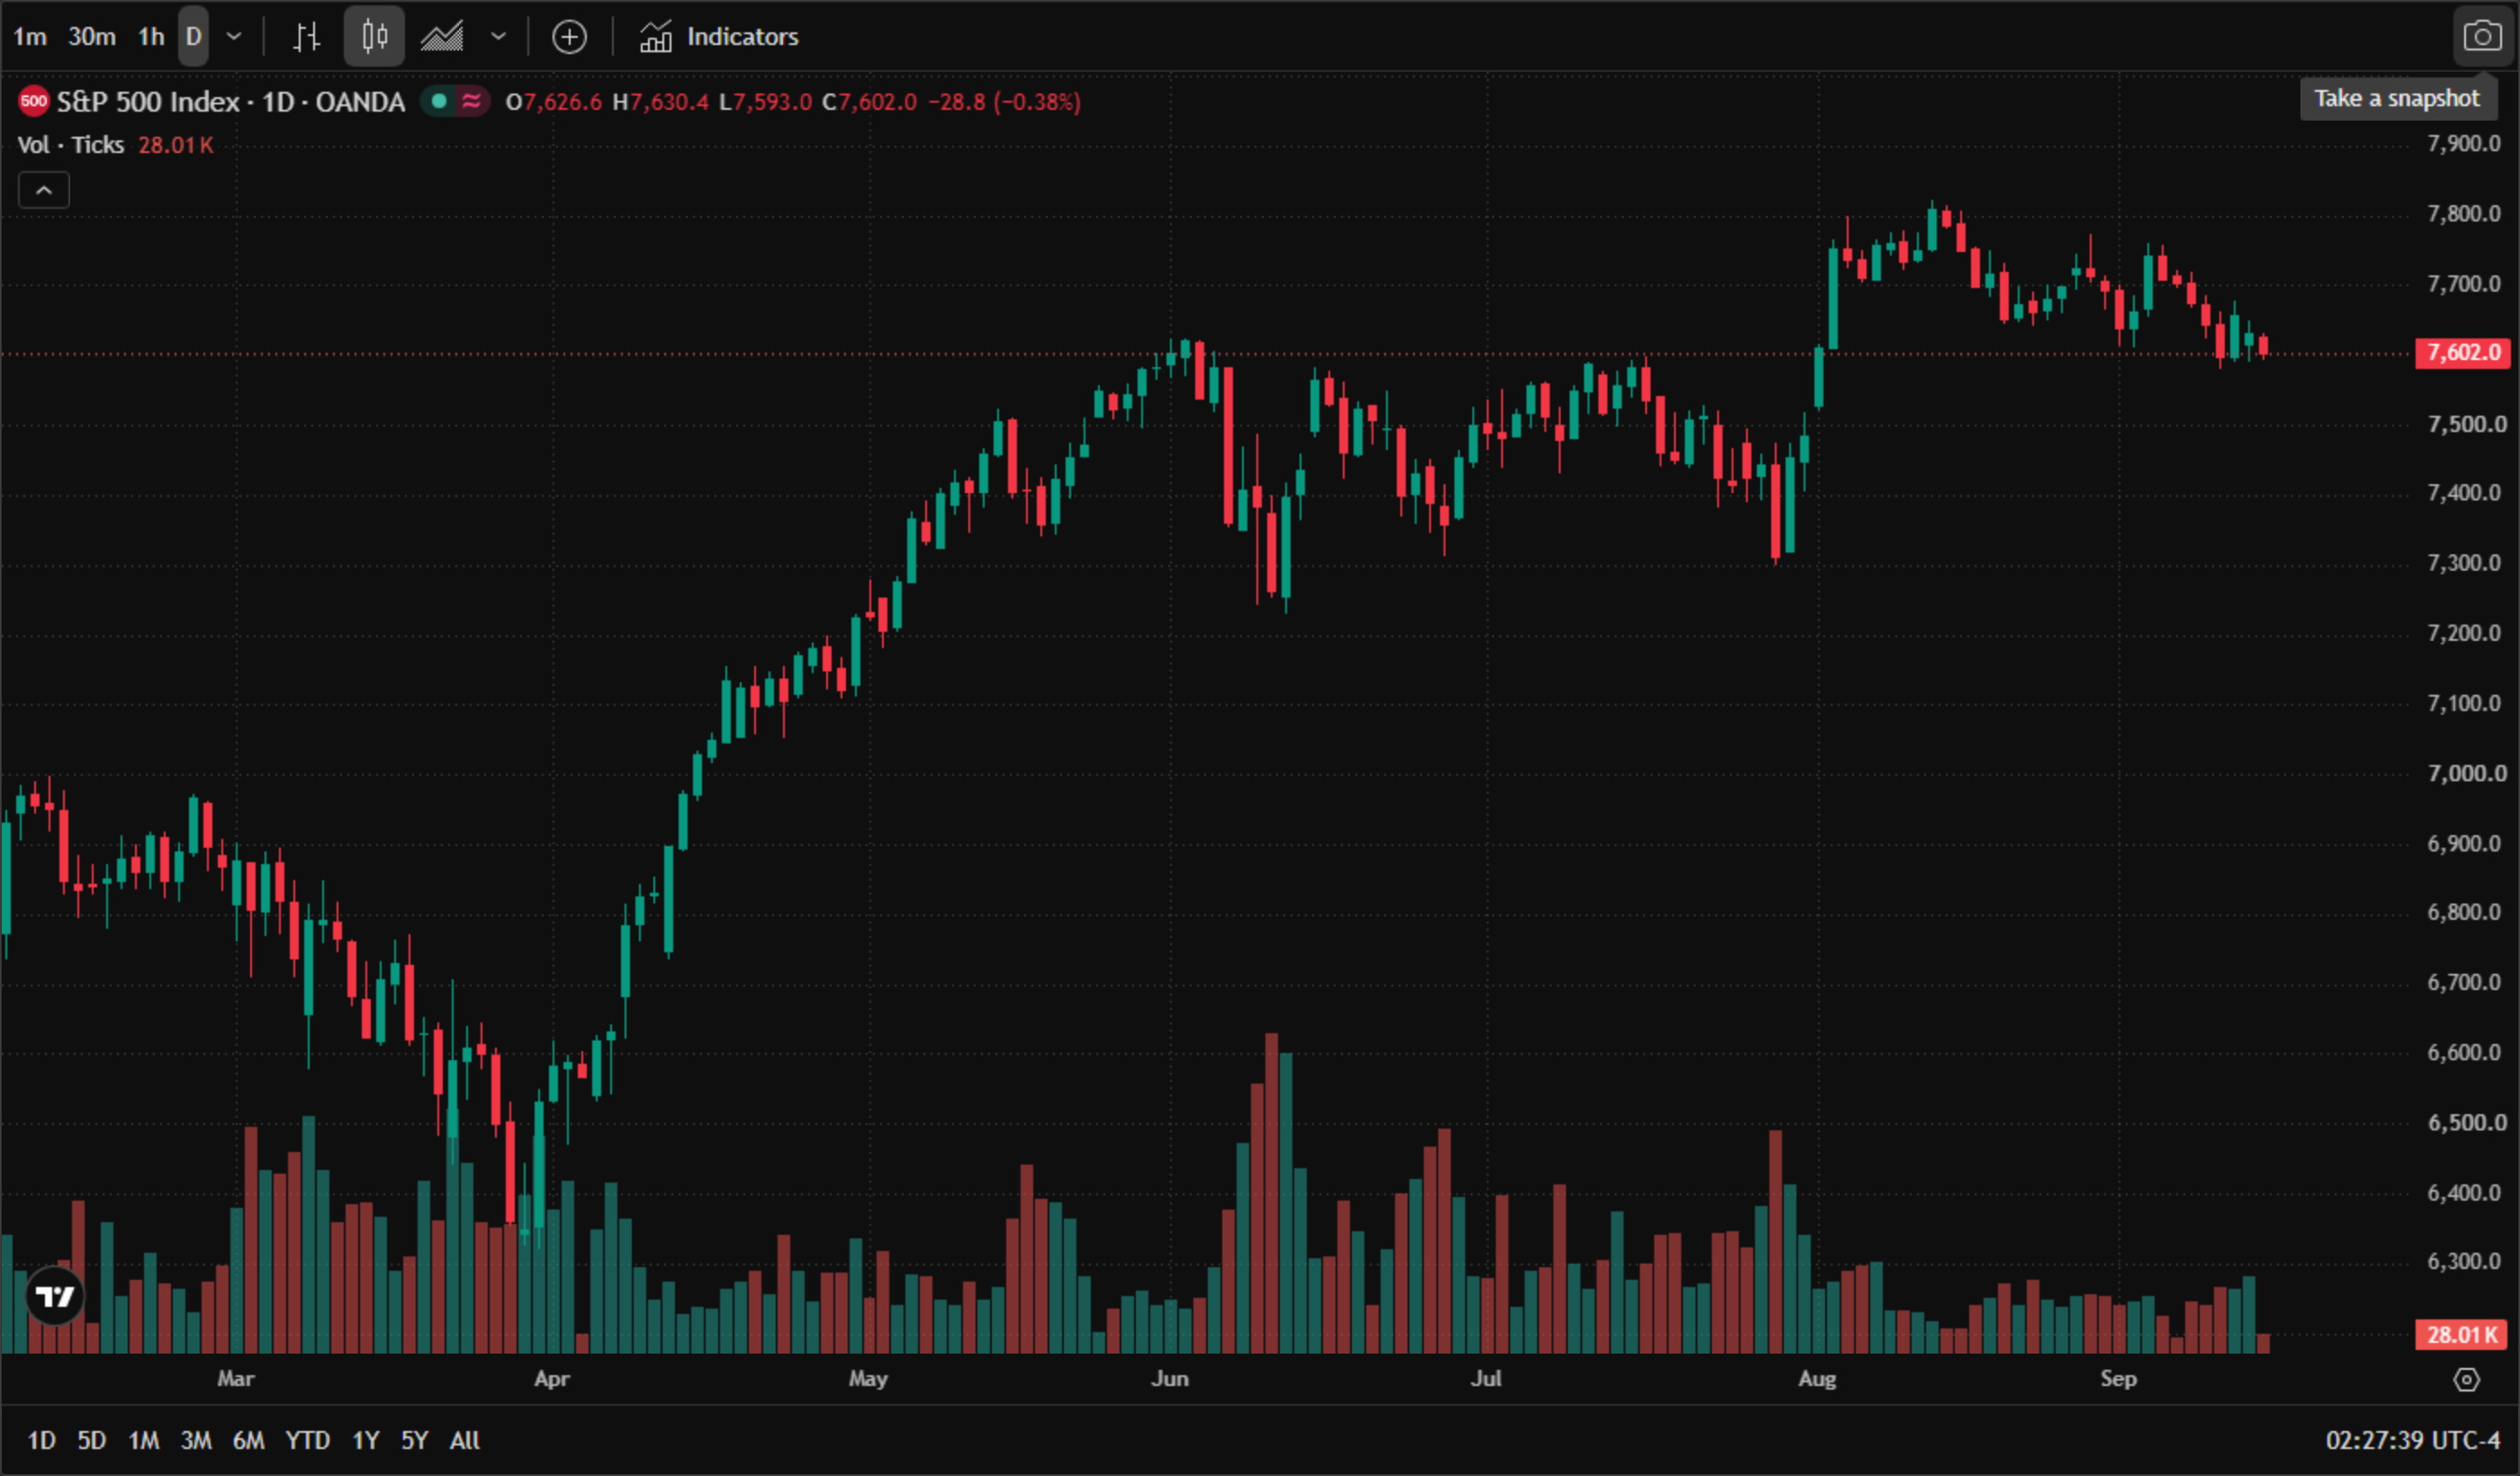
* Chart source: official TradingView chart screenshot, OANDA data feed (S&P 500 index CFD), as of 15 September 2026, 4:26 am ET.
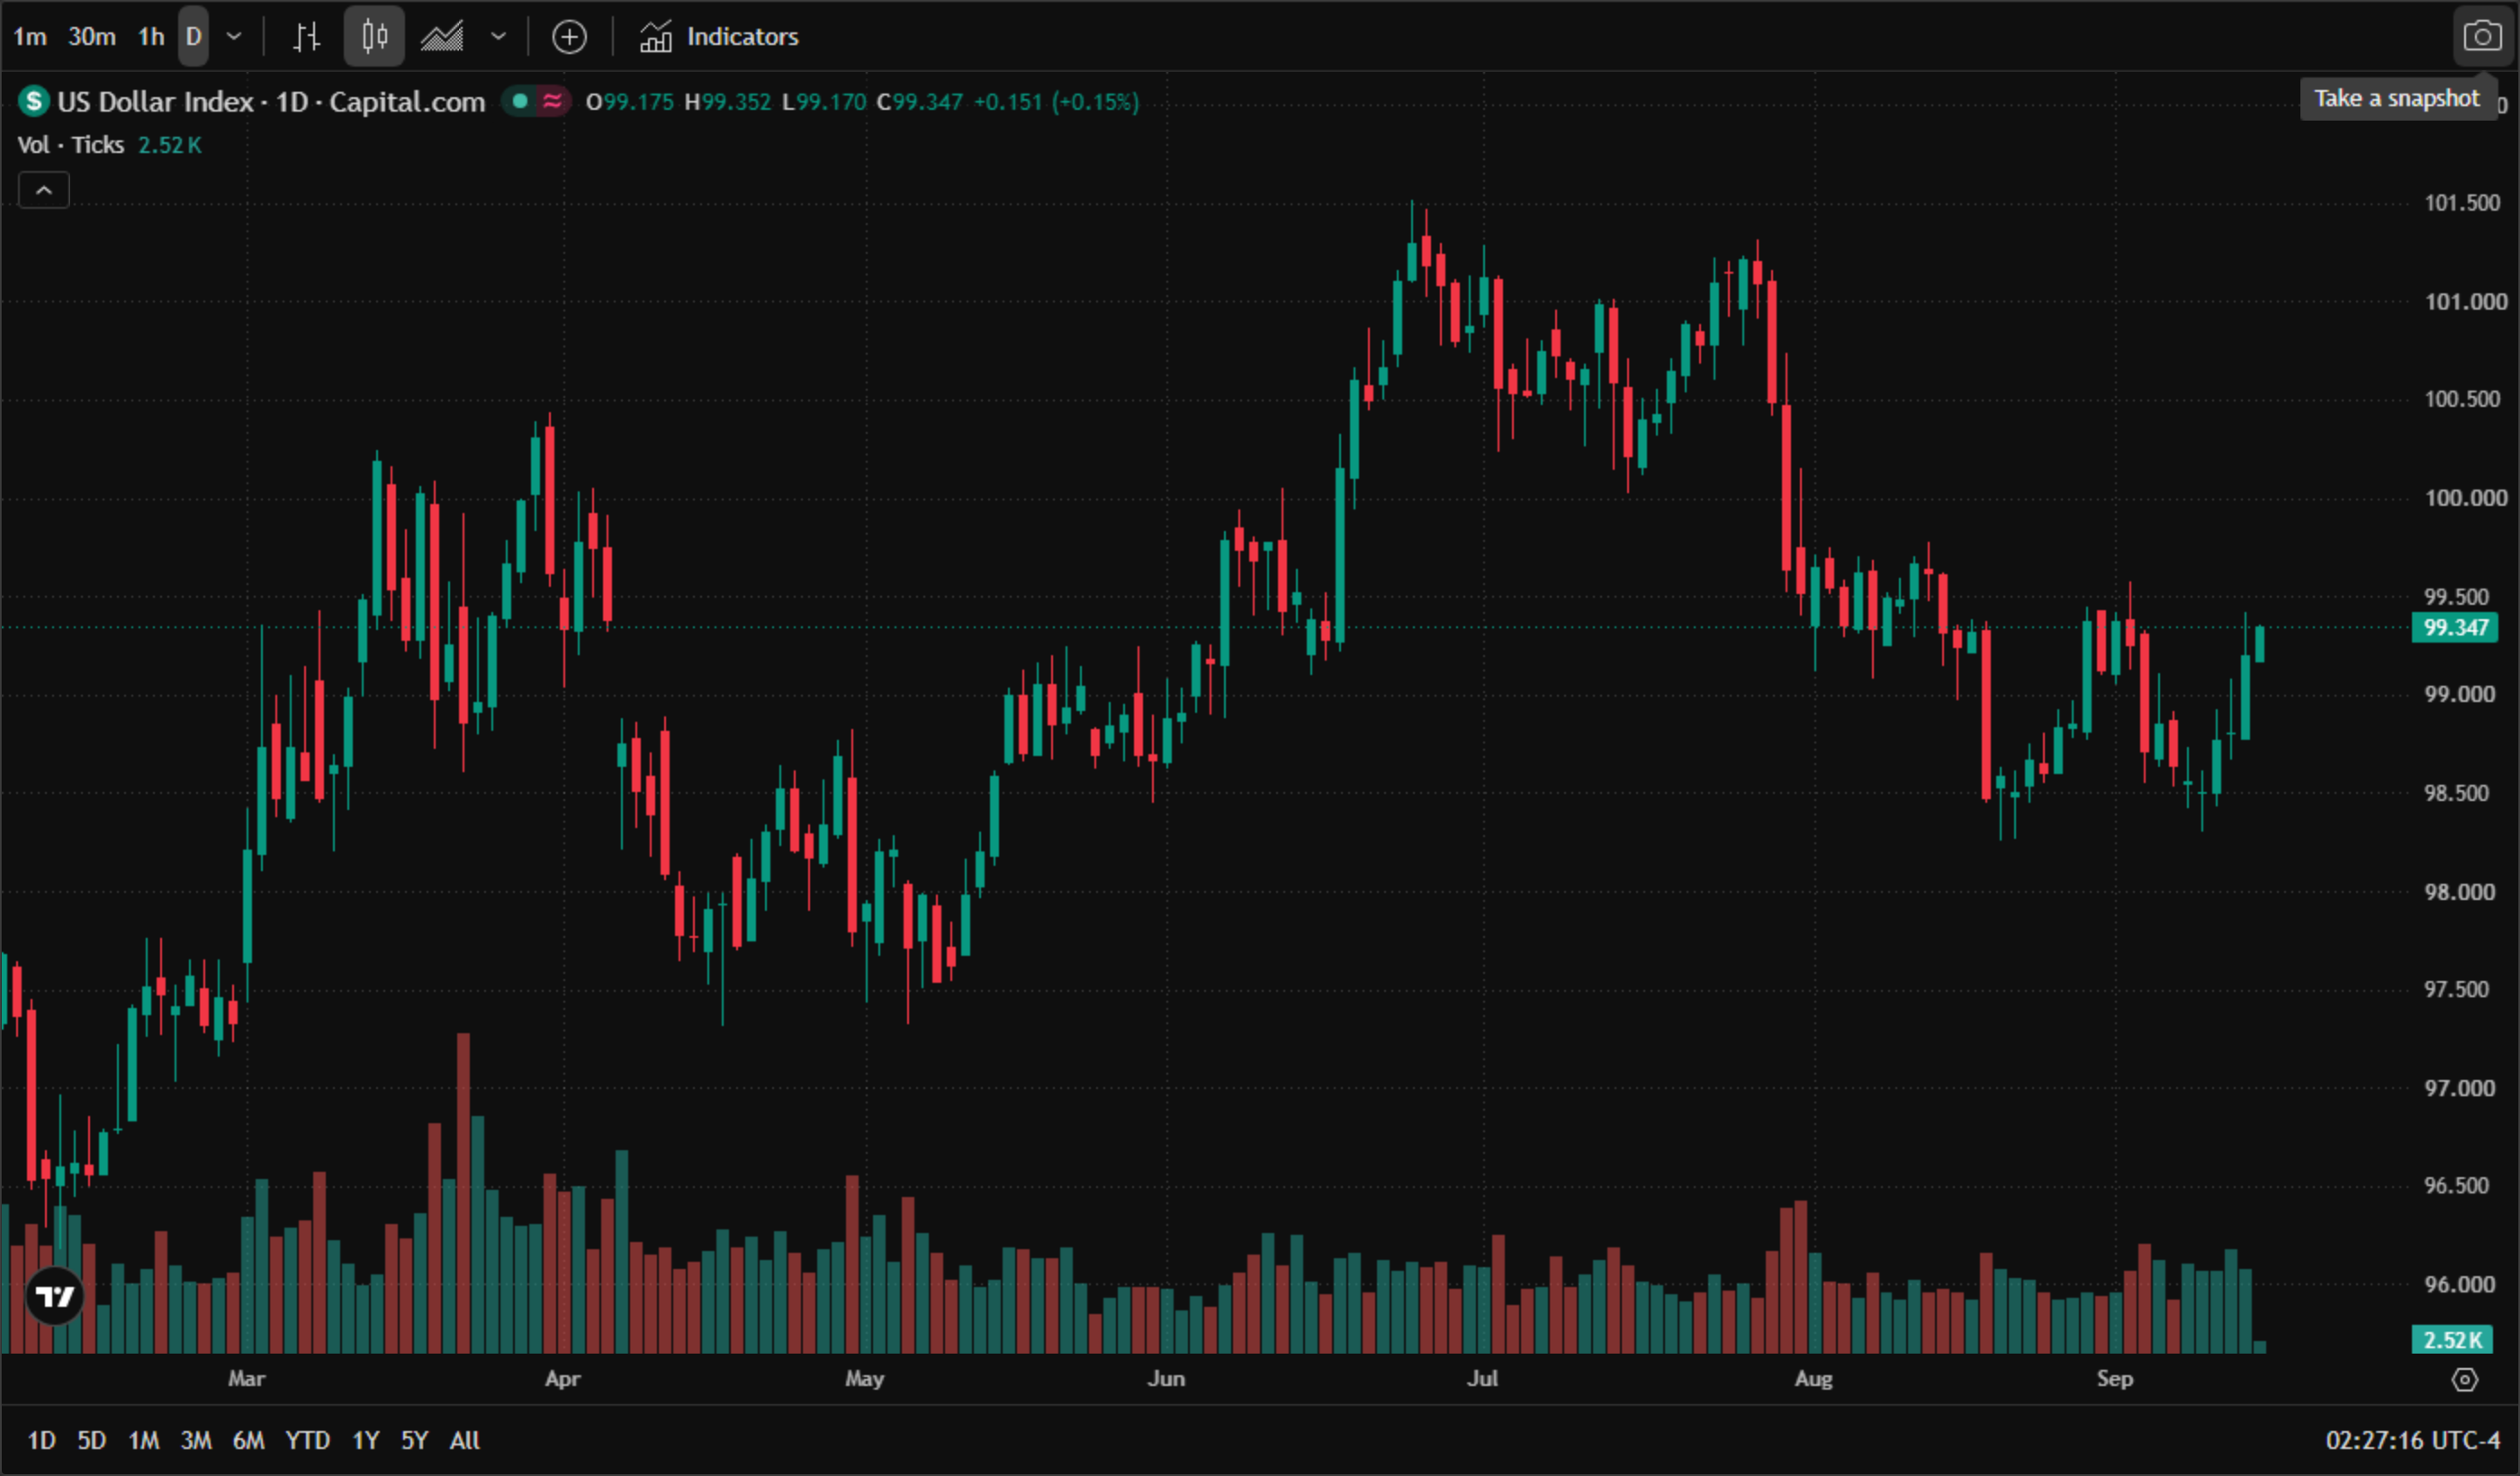
* Chart source: official TradingView chart screenshot, Capital.com data feed (US Dollar Index), as of 15 September 2026, 2:26 am ET.
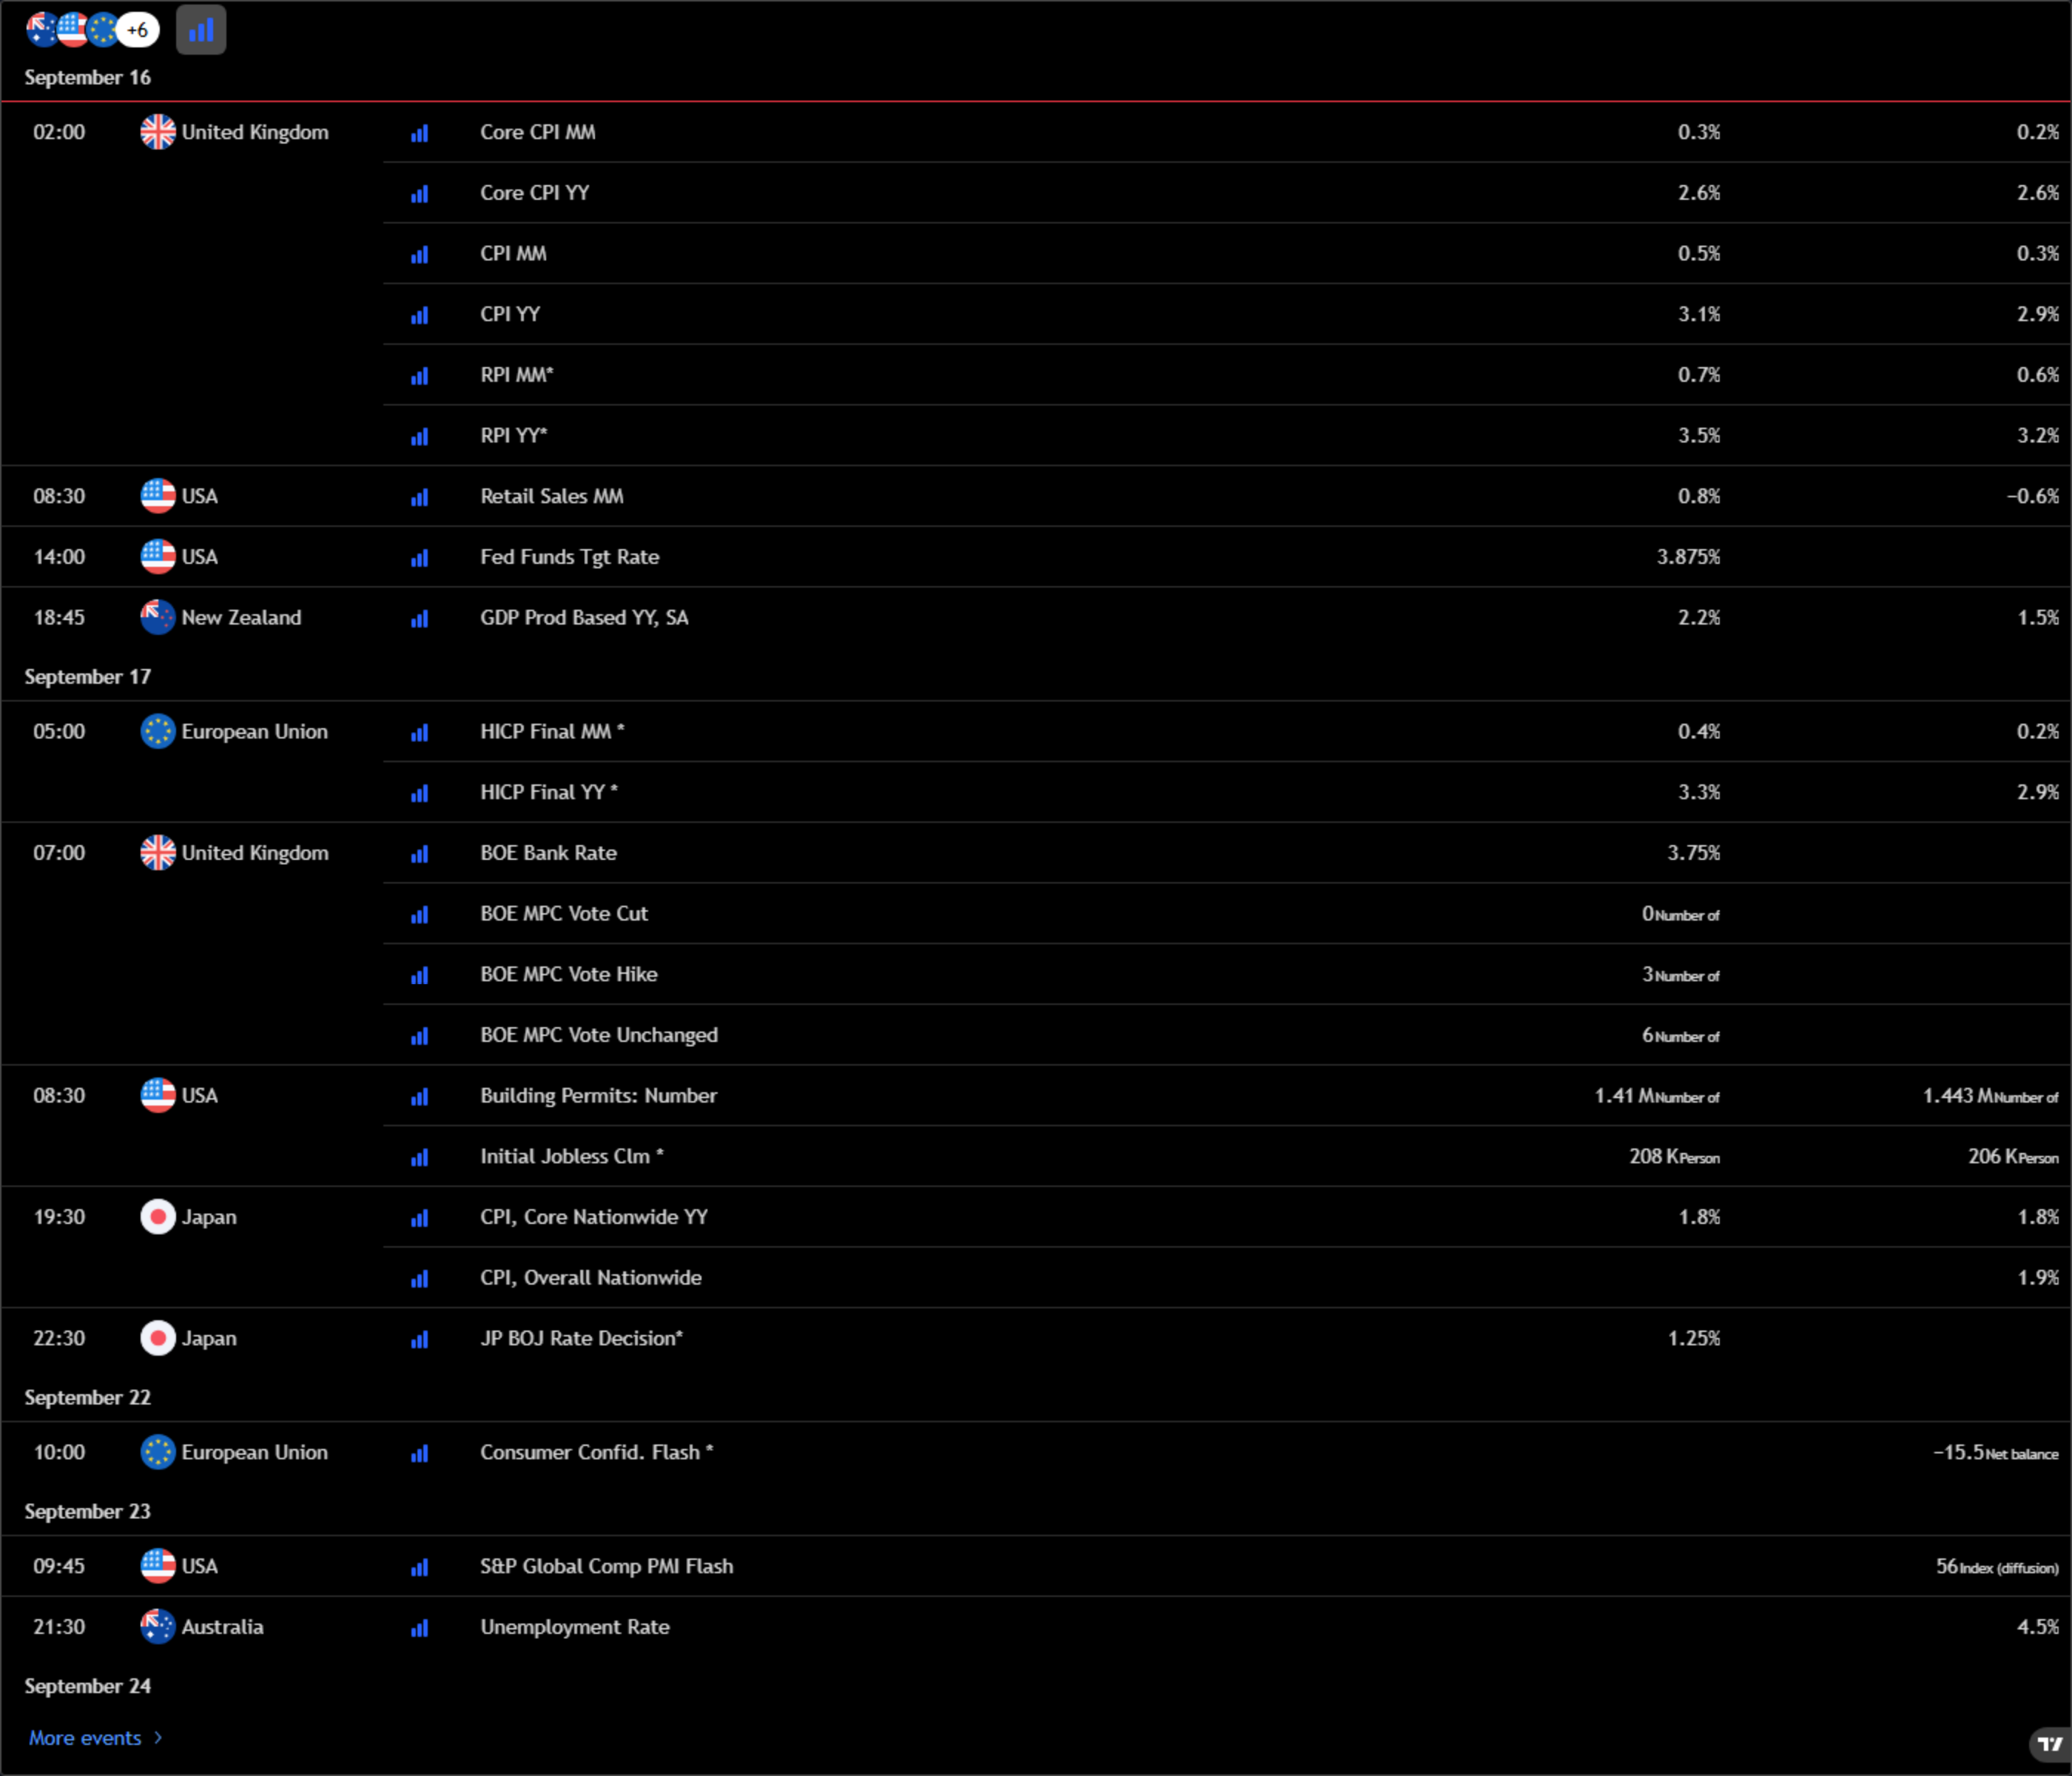
* Image source: TradingView official Economic Calendar screenshot, New York time (UTC-4), captured 15 September 2026.
Macro news
Fed decision eve. The meeting began today with no US data of consequence on the calendar — just the weekly ADP employment update at 8:15 am ET and the New York Fed's Empire State manufacturing index at 8:30 am ET, where consensus sits at 14.1 against 20.6 in August. Wednesday is the real test: August retail sales at 8:30 am ET, roughly five and a half hours before the decision, with consensus at +0.9% month on month after July's -0.6% drop. A strong print would reinforce the hike trade and support the dollar; a weak one would revive slowdown concerns. Thursday brings jobless claims and housing starts plus the Bank of England, and Friday brings industrial production and the leading indicators.
Bank of Japan on Friday. The BOJ concludes its two-day meeting on 18 September and a 25bp hike to 1.25% — a 31-year high — is now roughly 97% priced. MUFG describes the move as fully priced in, and the focus has shifted to guidance beyond September, with ING's house view at 1.75% by April 2027. Because the Fed is expected to hike the same week, the US-Japan rate gap stays near 2.6 percentage points, which caps yen gains; analysts put the base case at roughly 152 ~ 155.50, with a sustained break below 150 requiring a hawkish BOJ and a dovish Fed.
CLARITY Act vote today. The Senate is scheduled to hold a procedural cloture vote on the Digital Asset Market Clarity Act, needing 60 votes to advance against a 53-seat Republican majority. The final ~635-page text landed on Monday incorporating 126 Democratic amendments. Polymarket odds of the bill becoming law this year have risen from about 14% to roughly 33%.
Europe's gas squeeze. Dutch TTF held near €82.5/MWh after Monday's 5% surge. EU storage sits at 68%, roughly 16 percentage points below this time last year and about 17 points below the 15-year average, with unplanned Norwegian maintenance and reduced Algerian flows tightening the winter buffer.
Company news
A rotation, not a retreat. Monday's defining feature was money moving within technology rather than out of it. Over the weekend, Anthropic's chief executive called on AI companies to slow the pace of frontier model development, with OpenAI and xAI agreeing — a sentiment shock that hit chipmakers hard despite no confirmed cuts to orders, cloud capex or guidance. Capital rotated into AI security and software, where RBC, Raymond James and Wedbush raised price targets on CrowdStrike.
Oracle's "good but not good enough" quarter. Q1 earnings per share came in at $1.92, about $0.19 ahead of consensus, on revenue of roughly $19.3 billion (+30%), with cloud infrastructure up 121% and remaining performance obligations at a record $664 billion. But free cash flow was negative $5.4 billion and the company announced a $20 billion equity raise; the stock spiked as much as 8.5% intraday before reversing. Analysts are split, with BMO cutting its target to $195 from $220 while Guggenheim holds $400.
Analyst actions today. Wolfe Research upgraded Affirm to Outperform with a $90 target, roughly 26% above Friday's close, citing the post-earnings pullback, Affirm Card growth and AI agent commerce. Berenberg upgraded Eli Lilly to Buy and lifted its target from $1,220 to $1,400. Needham raised ServiceNow to $155, UBS lifted Schlumberger to $72 and Illumina to $260, and Baird raised Airbnb to $200, while Morgan Stanley cut AppLovin to $450.
Earnings this week. Micron, FedEx, Nike, Lennar, General Mills and Darden headline the calendar, with Wednesday and Thursday the busiest days. Micron matters most for the AI memory trade; FedEx is the global shipping barometer; Nike faces questions on product innovation against Adidas, Hoka and On Holding.
What to watch today
ADP weekly employment — 8:15 am ET.
Empire State manufacturing index — 8:30 am ET, consensus 14.1 (prior 20.6).
Senate CLARITY Act cloture vote — needs 60 votes to advance.
Dollar index at 99.34 — a clean break above 99.735 would open the 100 handle; 98.80 is first support.
S&P 500 at 7,602.6 — 7,585 is the week's key floor; 7,630 is first resistance.
Related reads: for why the dollar's resilience is squeezing the Aussie, see AUD/USD climbs for a fourth day to 0.7218; for the full FOMC preview and how to trade the decision, see Fed hike odds near 90% into Wednesday's decision; for the oil shock feeding this inflation loop, see Brent tests $108 as a key export pipeline stays shut.
Read more
Before making any trading decisions, it is important to equip yourself with sufficient fundamental knowledge, have a comprehensive understanding of market trends, be aware of risks and hidden costs, carefully consider investment targets, level of experience, risk appetite, and seek professional advice if necessary.
Furthermore, the content of this article is solely the author's personal opinion and does not necessarily constitute investment advice. The content of this article is for reference purposes only, and readers should not use this article as a basis for any investment decisions.
Investors should not rely on this information as a substitute for independent judgment or make decisions solely based on this information. It does not constitute any trading activity and does not guarantee any profits in trading.
If you have any inquiries regarding the data, information, or content related to Mitrade in this article, please contact us via email: insights@mitrade.com. The Mitrade team will carefully review the content to continue improving the quality of the article.


