


Gold ends three-week slide at the $4,400 line — eight straight days of ETF inflows vs a 5% 10-year and a 100 dollar


Spot gold closed Friday at $4,378.39 an ounce, up $36.55 or 0.84% on the day, after trading between $4,334.30 and $4,399.67 — a high that left it just 33 cents short of the $4,400 line. The move ended a three-week losing streak and delivered gold's first weekly gain since late August. But with the 10-year Treasury yield back above 5% and the dollar index back at the 100 handle, the question for the week ahead is simple: is this a reversal, or a bounce inside a downtrend?
The move: a three-week slide ends at the $4,400 line
Friday's session opened at $4,343.19, dipped to $4,334.30, then rallied to close at $4,378.39 — up 0.84% on the day and roughly 0.8% on the week. It was the first weekly gain since gold peaked in late August, and it retraced about 3% of the distance from Wednesday's post-Fed low near $4,235.
The move was broad across precious metals: spot silver rose 1.59% to $66.26, platinum gained 1.72% to $1,803 and palladium added 0.69% to $1,304. Gold now sits within about $21 of $4,400 — a round number that doubles as Friday's intraday high.
Why the hawkish hike failed to break gold
The Fed hiked 25bp to 3.75%–4.00% on September 16 — its first increase since July 2023, in a unanimous 12–0 vote — and the dot plot pointed to at least one more hike this year. Normally that is bearish for a non-yielding asset. Three forces blunted it:
Oil cooled. Brent posted its first weekly loss in three weeks, easing toward $102–103 (WTI near $100) after supply-route concerns had pushed it above $108. Lower energy prices took some heat out of inflation expectations.
Yields pulled back. The 10-year Treasury yield touched 5.041% — its highest since 2007 — before retreating, and the 2-year peaked intraday at 4.744%. Lower yields reduce the opportunity cost of holding gold.
Shorts covered. Positioning ahead of the Fed was geared for a sharp post-decision drop. When gold held above $4,235 on Wednesday, those short positions were squeezed out and the unwind itself became a bid.
The cleanest evidence sits in fund flows: gold ETFs have now recorded eight consecutive sessions of net inflows — the longest streak since October 2025 — with total holdings at a seven-month high.
The two ceilings: a 5% 10-year and a 100 dollar
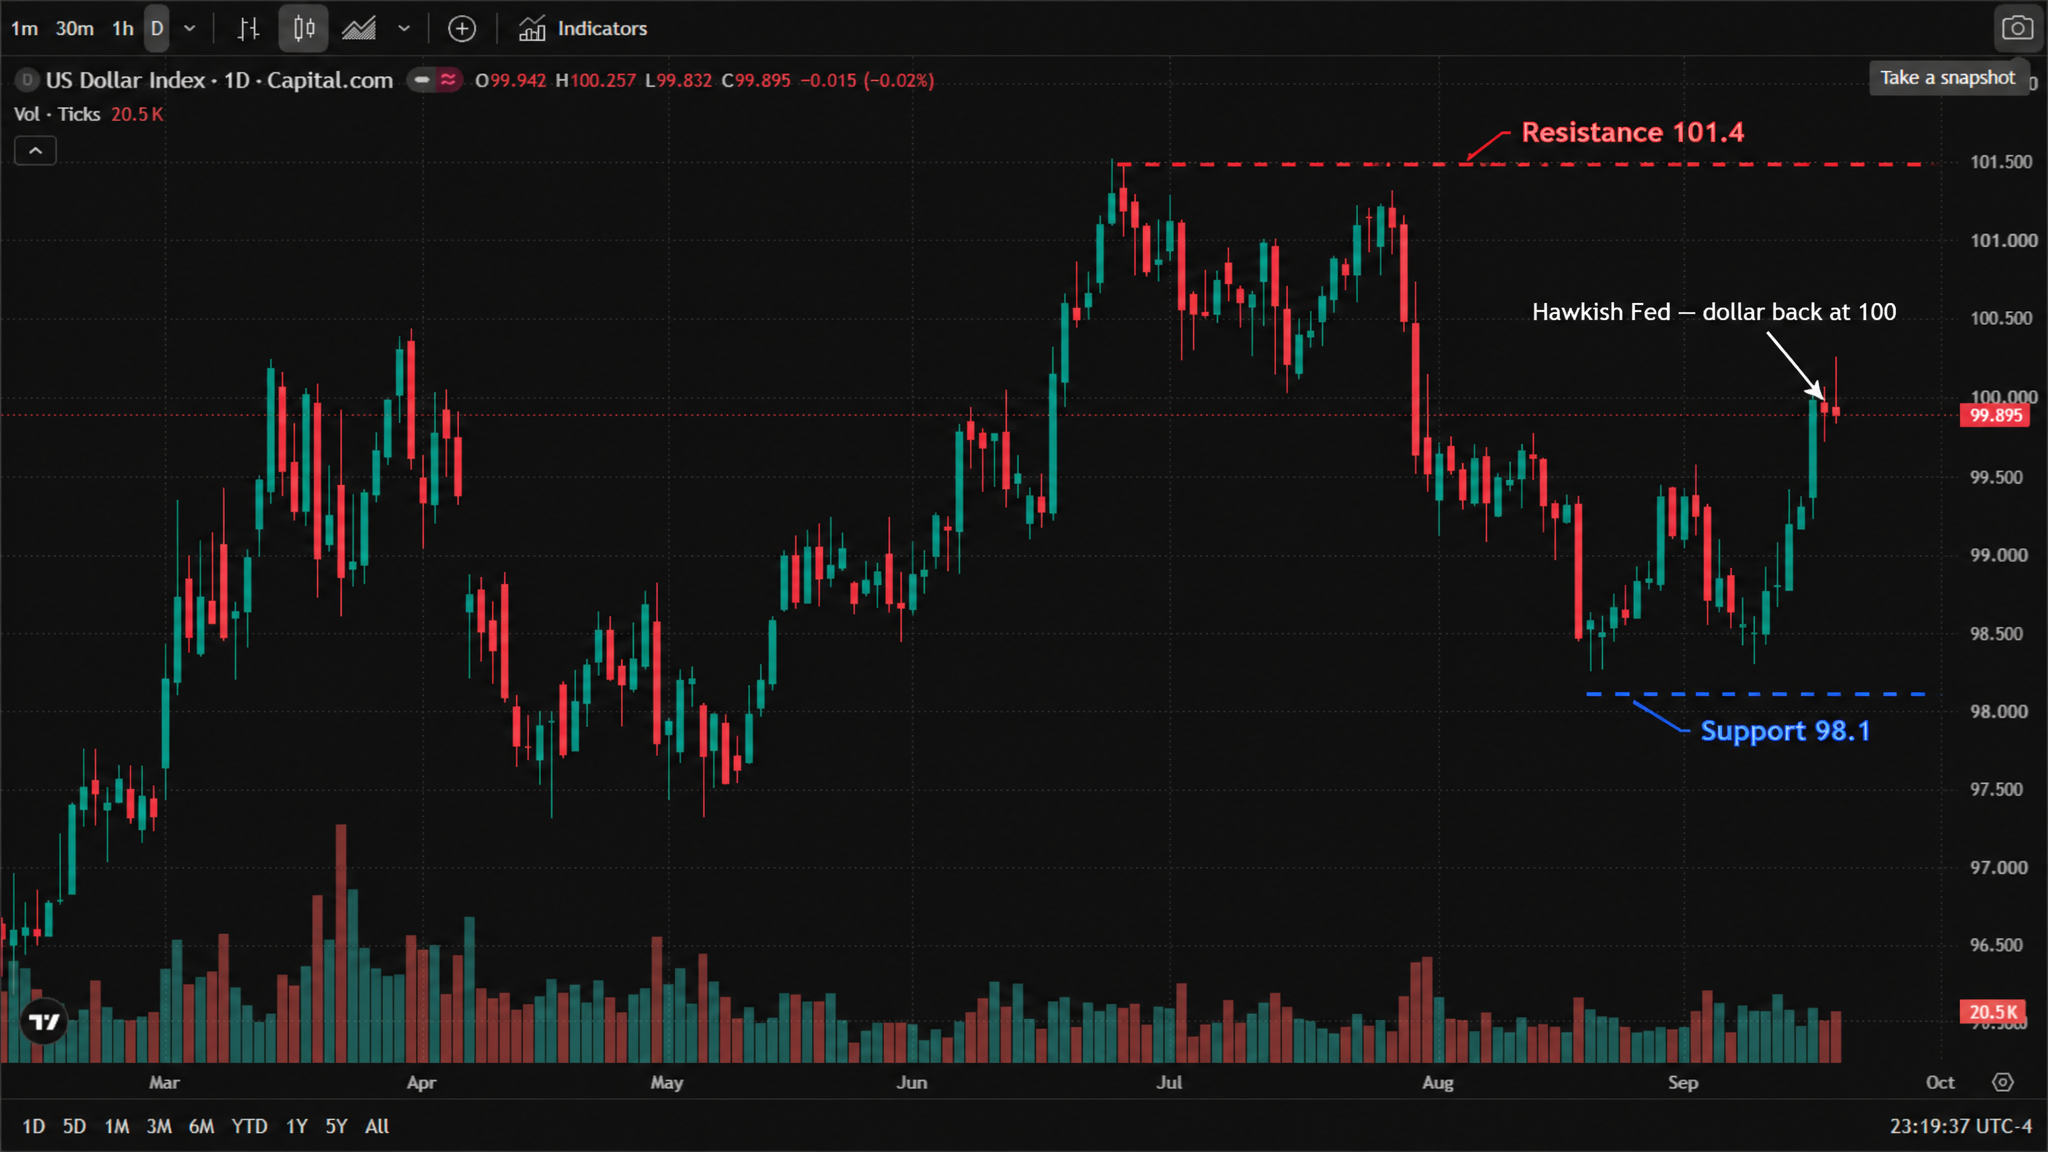
* Chart source: official TradingView chart screenshot, data by Capital.com (US Dollar Index), as of 20 September 2026, 03:19 UTC (23:19 ET, 19 September).
The dollar index traded as high as 100.257 on Friday — back at the 100 handle — with technical resistance at July's high of 101.4 and support at the late-August low of 98.1. The "5% 10-year plus a 100 dollar" combination is what strategists describe as the twin psychological barriers capping both equities and gold: until those two recede, every gold rally has to fight through them first.
Next week puts the rate path back in focus with a heavy Fed speaker schedule: Goolsbee (Monday), Williams and Jefferson (Tuesday), Barkin (Wednesday), and Hammack and Paulson (Thursday). With Chair Warsh declining to give forward guidance, their language on a possible October hike is the only signal markets get — pricing currently sits near 55%.
Institutions: near-term targets trimmed, long-term calls intact
Several banks updated their gold views last week, and the pattern is telling — the cuts are near-term, the long-term logic is unchanged.
| Institution | Latest view |
|---|---|
| Goldman Sachs | 2026 year-end target cut to $4,650 (from $4,900), but the 2027 year-end target is kept at $5,400 — tightening slows the climb, it does not derail it |
| UBS | Constructive over 12 months: $4,600 by December 2026 and $5,000 by March 2027 |
| Bank of America | Strategist Hartnett calls long gold "the best trade right now" |
| Deutsche Bank | Year-end range of $4,700–5,100 |
| Citi | $5,000–6,000 over the next 12 months |
Read the table closely: the near-term trims track the "possible October hike" rate path, while the unchanged-to-higher long-term targets track central-bank buying, fiscal deficits and de-dollarisation. Short-term noise, unchanged structural bid.
Technicals: $4,400 is the line to reclaim
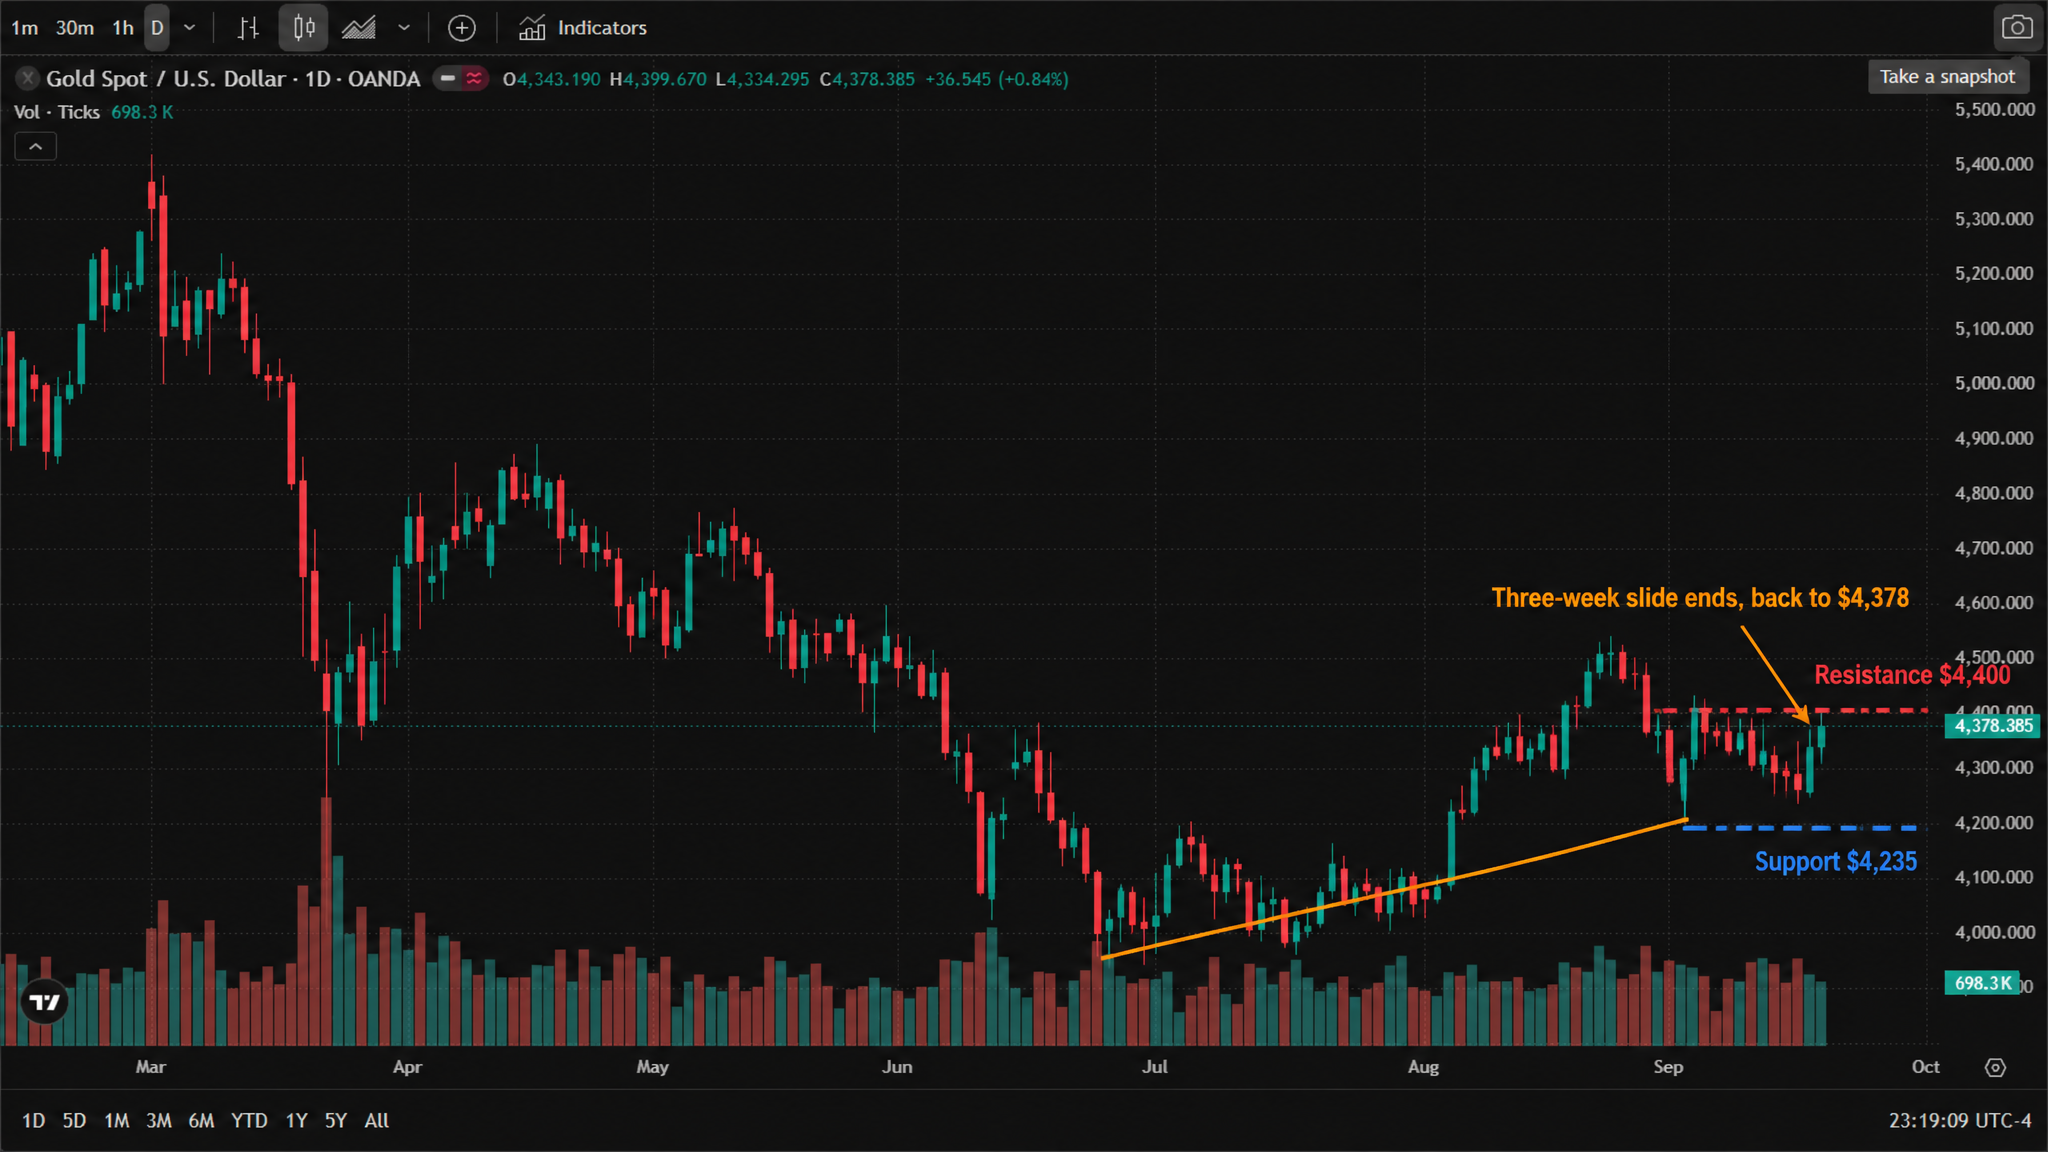
* Chart source: official TradingView chart screenshot, data by OANDA (XAU/USD CFD), as of 20 September 2026, 03:19 UTC (23:19 ET, 19 September).
The technical picture is improving: lows have risen consistently since July ($4,000 → $4,100 → $4,235), forming an uptrend line that acts as the bull case's line in the sand. Resistance: $4,400 (round number, matching Friday's $4,399.67 high), then $4,433, then the 200-day moving average near $4,540. Support: $4,334 (Friday's low), $4,283 (around the 50-day MA) and $4,235 (last week's low). Reclaiming $4,400 on volume is the first real test of this rebound. If you want to see how the metals complex got here, see how silver and platinum led the earlier rebound.
What to watch next week
The rate path stays front and centre: US September flash PMIs on Wednesday (manufacturing 53.6, services 56 forecast), jobless claims and new home sales on Thursday, and durable goods plus the final Michigan sentiment print on Friday — with Fed speakers threaded through the whole week.
Scenario A — dollar softens, data cools. Hike expectations ease, gold clears $4,400 and targets $4,433, with the 200-day average near $4,540 beyond that.
Scenario B — dollar firms, data runs hot. October hike pricing rebuilds, gold retests $4,334, then the 50-day area at $4,283 and last week's low at $4,235.
One calendar note: Mid-Autumn Festival closes mainland China, Hong Kong, Taiwan and South Korea markets on Friday, September 25 — expect thinner Asian flows around the weekly close.
Related reads: for how the Fed's first hike in three years repriced the dollar, see Dollar index tops 100 for the first time since July; for the equities side of that same decision, see Dow drops 631 points as the Fed hikes.
Read more
Before making any trading decisions, it is important to equip yourself with sufficient fundamental knowledge, have a comprehensive understanding of market trends, be aware of risks and hidden costs, carefully consider investment targets, level of experience, risk appetite, and seek professional advice if necessary.
Furthermore, the content of this article is solely the author's personal opinion and does not necessarily constitute investment advice. The content of this article is for reference purposes only, and readers should not use this article as a basis for any investment decisions.
Investors should not rely on this information as a substitute for independent judgment or make decisions solely based on this information. It does not constitute any trading activity and does not guarantee any profits in trading.
If you have any inquiries regarding the data, information, or content related to Mitrade in this article, please contact us via email: insights@mitrade.com. The Mitrade team will carefully review the content to continue improving the quality of the article.


