Bitcoin holds above $86,000 as four of five majors hit 3-month highs — why XRP is the odd one out

Mitrade
coverImg
Source: DepositPhotos

Bitcoin broke above $86,000 on Tuesday, touching an intraday high of $86,602 — its first return to that level since late January and a 33-week high — before easing back toward $85,700. The move was not a Bitcoin story alone: four of the five largest cryptocurrencies are now trading above every level they have seen in the past three months. XRP is the exception — and that gap is where this rally gets interesting. Roughly $905 ~ 995 million of leveraged positions were liquidated across crypto in 24 hours, with shorts accounting for 86 ~ 90% of them, according to CoinGlass data.

The move: breadth, not a single coin

This is the first rally of the cycle where the gains are distributed rather than concentrated. Bitcoin leads, but the second tier has done more work.

AssetLevel (approx.)24h moveThree-month high?
Bitcoin (BTC)~$85,700 (high $86,602)+6.4% ~ 8%✅
Ethereum (ETH)$2,759 ~ 2,777+4.6% ~ 6.4%✅
Solana (SOL)$115 ~ 119+6.7% ~ 9.6%✅
BNB~$799+3.87%✅
XRP$1.49 ~ 1.55+5.6% ~ 10.4%❌ not confirmed
Dogecoin (DOGE)~$0.093 ~ 0.099+14% ~ 15.4%—
NEAR~$4.25 ~ 4.33+20% ~ 23%—
Sui (SUI)above $1+23%—

Bitcoin's previous daily close was $81,120, the highest weekly close since early May. The breakout has now run roughly +50% over the past two months and about +35% over three months.
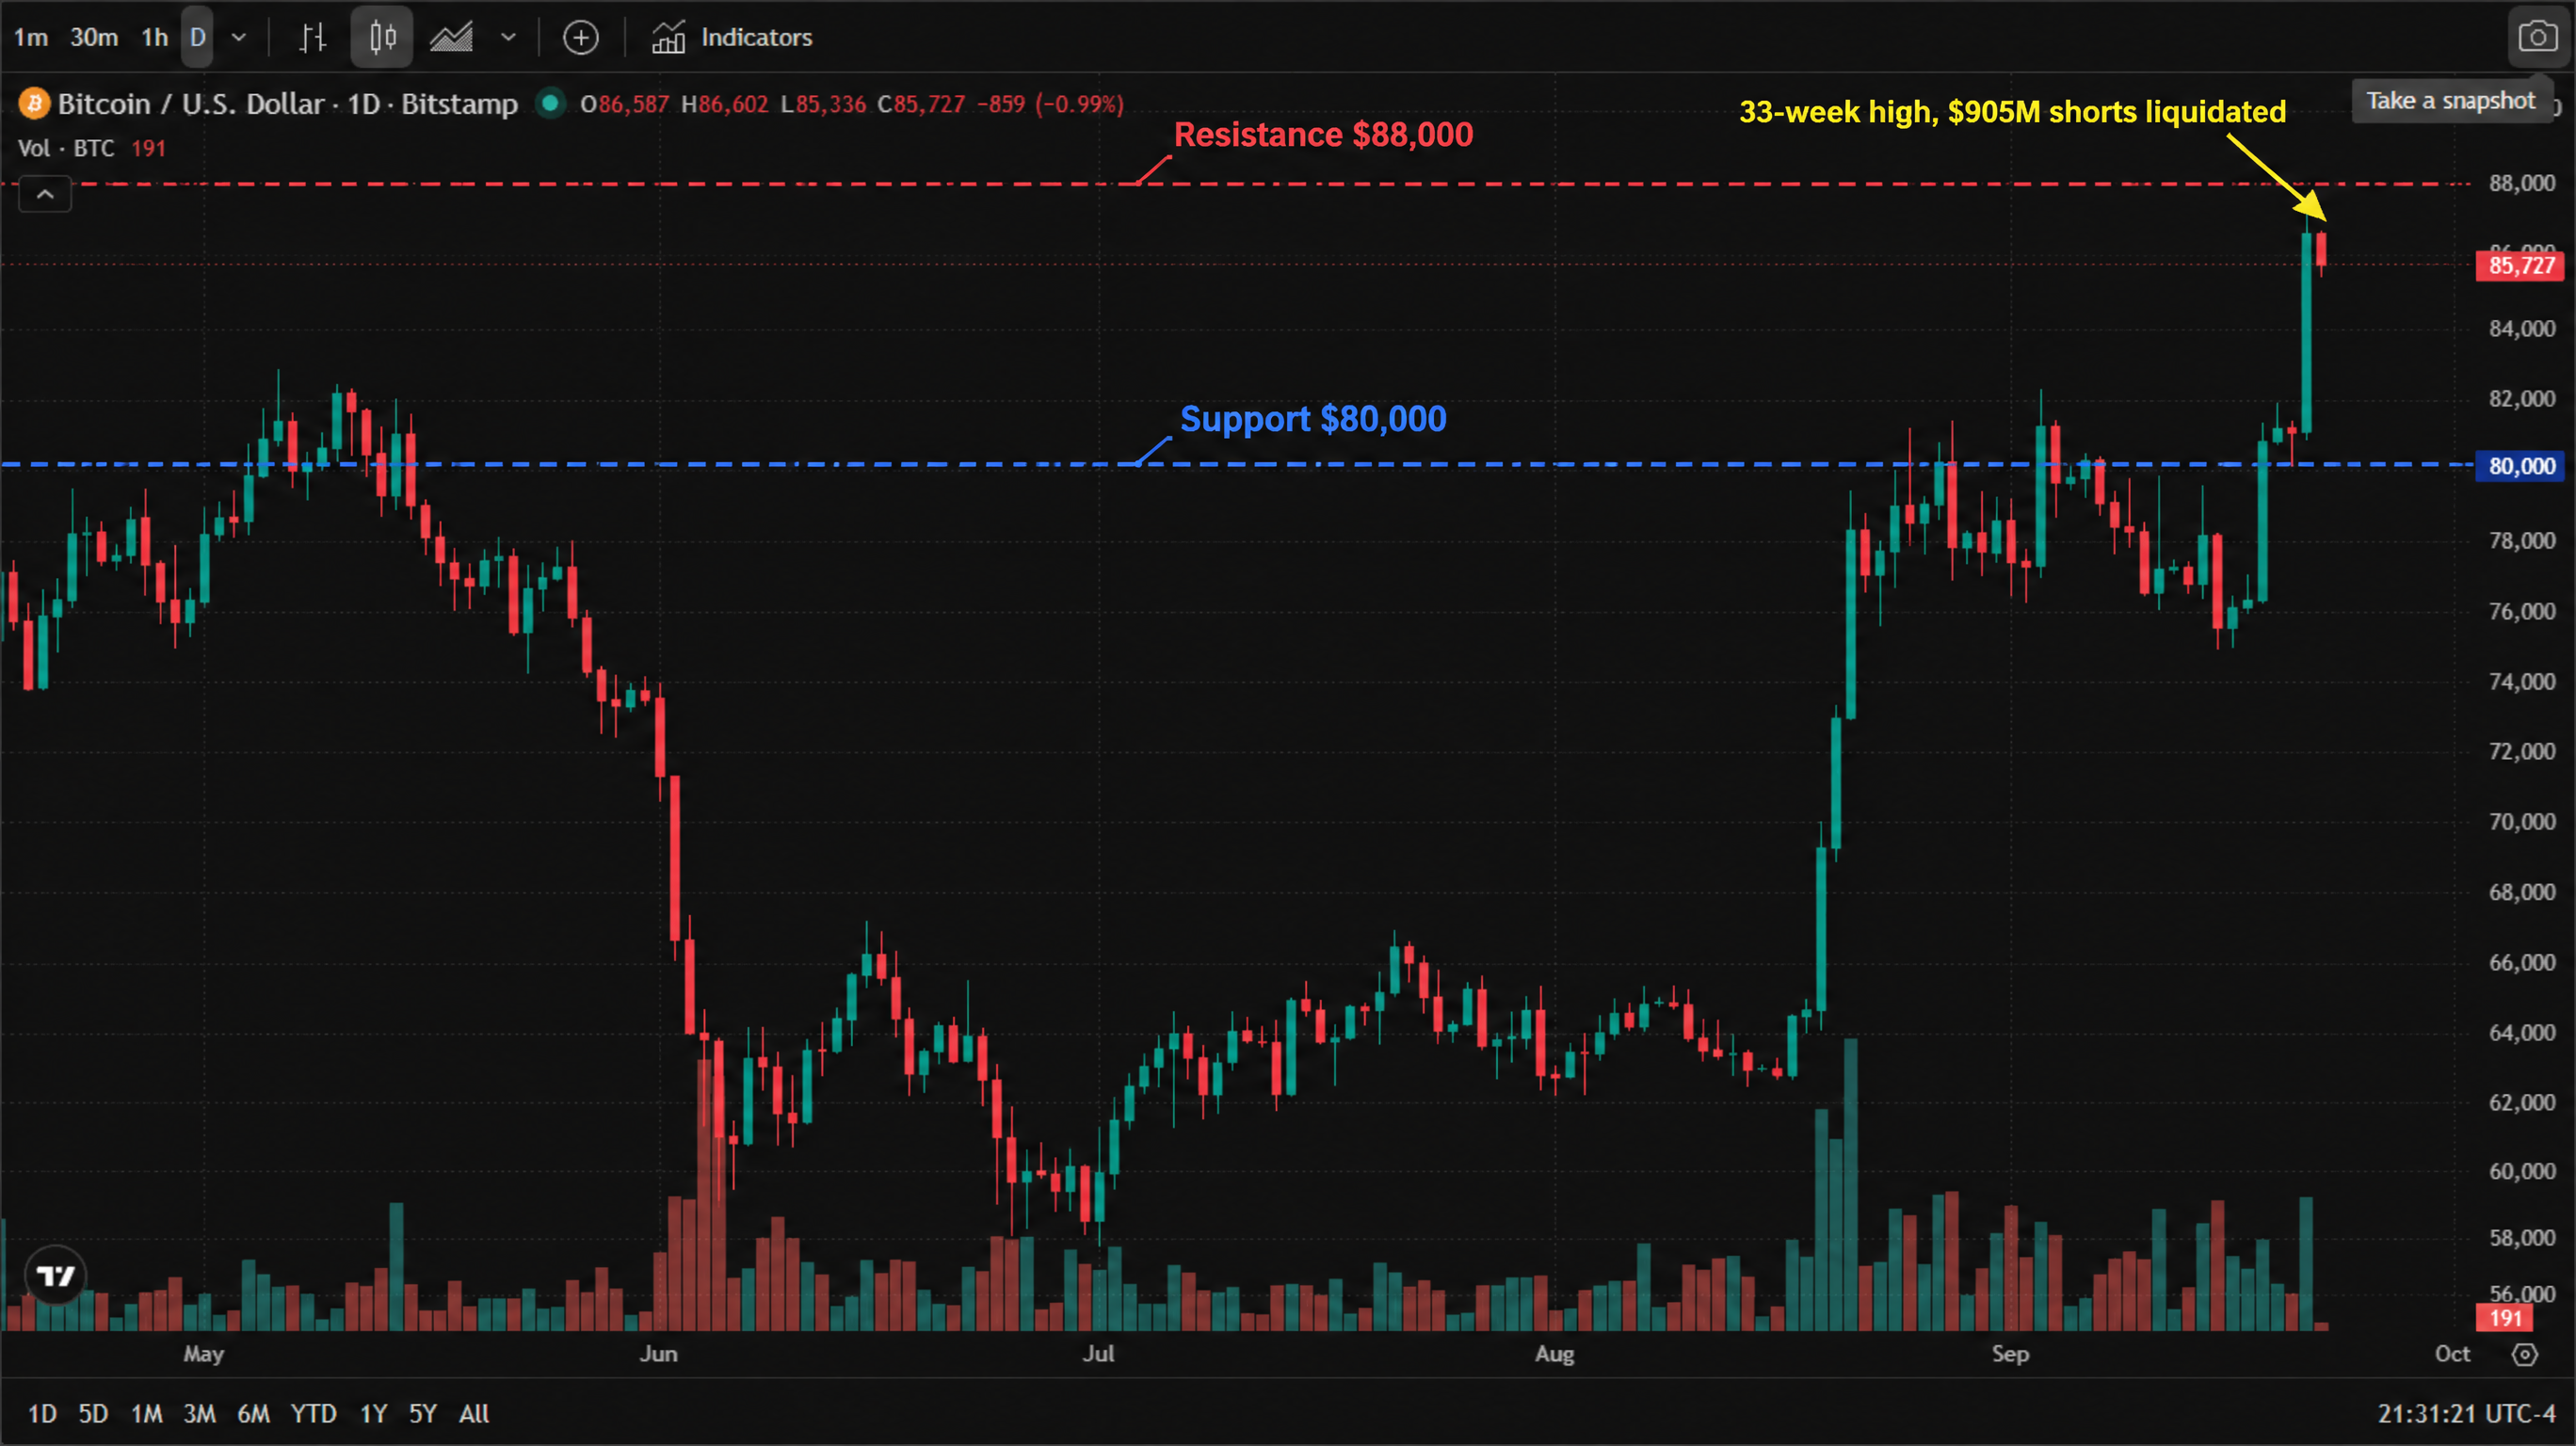
Bitcoin (BTC/USD) daily chart (official TradingView chart screenshot, data by Bitstamp, real 2026 candlesticks and volume, English interface, New York time) — Bitcoin bottomed near $58,000 in July, rebuilt through August, and broke out in September; as of 22 September 2026 it has pushed to an intraday high of $86,602 (its highest since late January) and trades around $85,727, with a session range of $85,336 ~ $86,602. The chart marks support at $80,000 (blue dashed line) and resistance at $88,000 (red dashed line), with an arrow pointing at the rightmost candle.

* Chart source: official TradingView chart screenshot (BITSTAMP:BTCUSD).

Why: three forces lining up

Oil's collapse did the heavy lifting. Brent fell 3.4% to $100.34 and WTI dropped 4.5% to $95.78 on Monday as traders positioned for a diplomatic opening in the Middle East. Lower crude drains the inflation premium that has kept the Fed hawkish — and the 10-year Treasury yield slipped back below 5% to about 4.955%, which is the single most supportive macro input for non-yielding assets.

Trade optimism added to it. Reports that Washington and Beijing are discussing tariff relief on roughly $30 billion of "noncritical" goods each way, ahead of this week's state visit, pushed risk appetite higher across the board.

Regulation turned friendlier. The SEC has approved a five-year exemption allowing qualified exchanges to offer tokenised US equity trading — a structural expansion of what crypto venues can list.

Flows: ETF holders are back in profit

The money has followed. Spot Bitcoin ETFs drew roughly $593 million of net inflows over two days, taking total assets under management to about $98.8 billion. More tellingly, the average cost basis of spot-ETF holders sits at roughly $80,172 ~ 81,700 — which means this week's move has pushed the average ETF investor back into profit for the first time since January.

Corporate treasuries are still buying. Strategy added $75.7 million of Bitcoin at an average price of $79,670, and crypto-linked equities rallied alongside: Strategy +9.4%, Coinbase +3.5%, Robinhood +2.9%. Total crypto market capitalisation has climbed to about $2.8 trillion, the highest since late January.
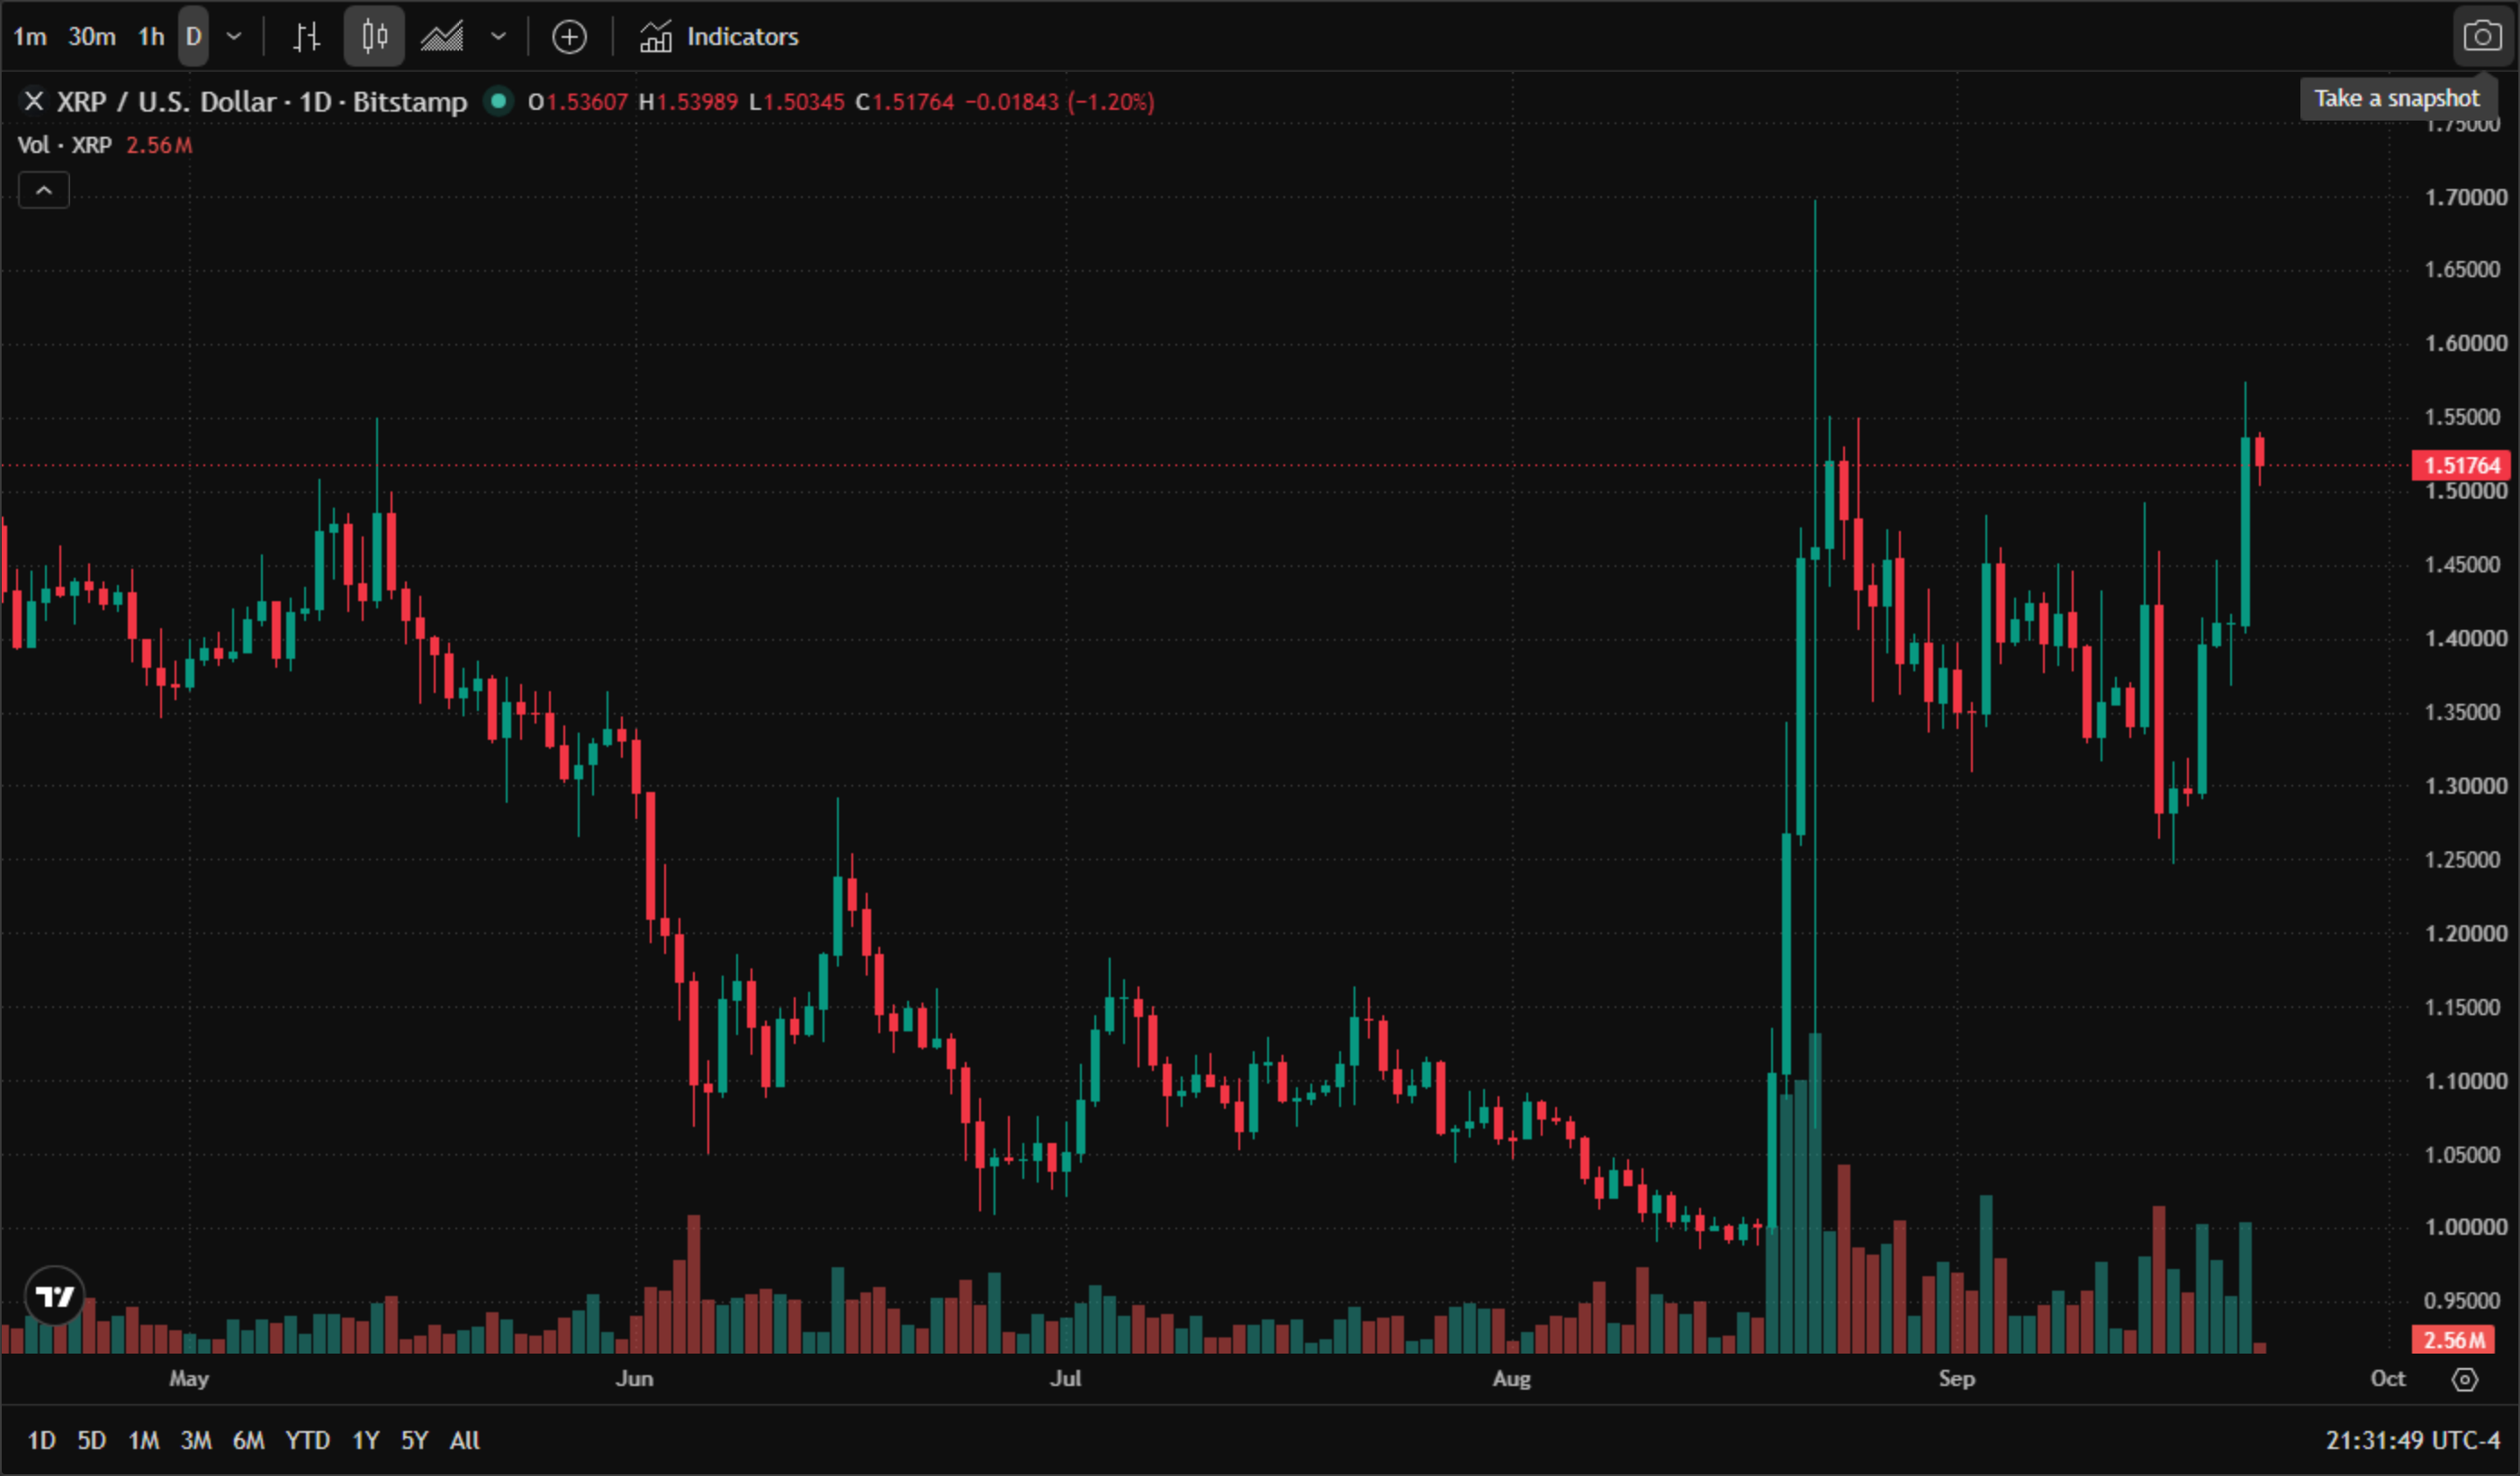
XRP (XRP/USD) daily chart (official TradingView chart screenshot, data by Bitstamp, real 2026 candlesticks and volume, English interface, New York time) — XRP spiked to about $1.70 in mid-August, fell back to the $1.30 area later that month, and has clawed back through September; as of 22 September 2026 it trades around $1.518, an intraday range of $1.503 ~ 1.540. Unlike Bitcoin, Ethereum, Solana and BNB, it has not confirmed a three-month high despite leading the 24-hour gains among the largest cryptocurrencies.

* Chart source: official TradingView chart screenshot (BITSTAMP:XRPUSD).

Levels and what to watch

  • Bitcoin: the $80,000 shelf — where the average ETF holder's cost basis sits — is the structural support, and it lines up with the July breakout zone. The nearest resistance on the chart is $88,000, with $90,000 the round-number target beyond it.

  • XRP: it needs to clear its August peak to rejoin the breadth story. Until it does, it remains the proof that this is a rotation, not a uniform melt-up.

  • Sentiment check: Bitcoin's RSI has pushed to 72.7, into overbought territory, while the Crypto Fear & Greed Index reads 80 ("greed"). Funding rates are neutral-to-slightly-negative on perpetuals — a sign that speculative leverage, so far, has not run ahead of spot demand.

Scenario A — breadth broadens. XRP confirms and closes its gap; ETF inflows continue at the recent pace. Positioning is not yet stretched (funding is not hot), so the path of least resistance stays higher, with $88,000 the first level to clear and $90,000 the magnet beyond it.

Scenario B — rotation stalls. XRP stays capped and Bitcoin's overbought RSI resolves lower. A slide back through the $80,000 shelf — where the average ETF holder is anchored — would turn the liquidation wave in the other direction.

One caveat worth keeping in view: even after this run, Bitcoin remains more than 30% below its October 2025 record of $126,080.

Related reads: for the short-squeeze chapter that set up this week's move, see Bitcoin squeezes back above $80,000 — 110,000 traders liquidated; for how cooling oil prices feed through to inflation and rate expectations, see Gold ends its three-week slide at the $4,400 line.

Read more

  • Gold hit a one-year low while central banks bought 321 tonnes — the sellers were never the ones you think
  • Note: If you want to share the article 《Bitcoin holds above $86,000 as four of five majors hit 3-month highs — why XRP is the odd one out》, make sure you retain the original link. For more information, please visit Insights or browse www.mitrade.com.

    * The content presented above, whether from a third party or not, is considered as general advice only.  This article should not be construed as containing investment advice, investment recommendations, an offer of or solicitation for any transactions in financial instruments.

    goTop
    quote
    Related Articles
    placeholder
    Ethereum Drops Below $2,000 After Plunging Over 20% in a Month as Odds of $1,500 Retest SurgeEthereum Plunges Over 20% in a Month, Risking a Retest of $1,500 After Losing the $2,000 Defense Line.On November 13, Ethereum (ETH) plunged more than 5%, officially falling below the key
    Author  TradingKey
    Nov 13, Fri
    Ethereum Plunges Over 20% in a Month, Risking a Retest of $1,500 After Losing the $2,000 Defense Line.On November 13, Ethereum (ETH) plunged more than 5%, officially falling below the key
    placeholder
    Bitcoin lost its 200-day average — but the exit started three sessions before the CPIBitcoin fell 2.5% to about $73,400 on 11 November, an 11-week low, breaking its 200-day moving average near $73,100. The 24-hour liquidation tally reached $632 to $705 million, roughly 82% of it longs. But spot ETF outflows began three sessions earlier and USDT's market cap has shrunk $6.6 billion in 60 days — the leveraged length left before the inflation print did. A double top at 81,890 and 81,080 leaves a measured target of 69,366.
    Author  Suzie
    Nov 11, Wed
    Bitcoin fell 2.5% to about $73,400 on 11 November, an 11-week low, breaking its 200-day moving average near $73,100. The 24-hour liquidation tally reached $632 to $705 million, roughly 82% of it longs. But spot ETF outflows began three sessions earlier and USDT's market cap has shrunk $6.6 billion in 60 days — the leveraged length left before the inflation print did. A double top at 81,890 and 81,080 leaves a measured target of 69,366.
    placeholder
    Bitcoin Price Forecast: BTC faces pressure as weekly ETF outflows hit $1.28 billionBitcoin (BTC) remains under pressure on Monday, trading below the 50-week Simple Moving Average (SMA) at $75,222 after extending its losing streak to five consecutive weeks.
    Author  FXStreet
    Nov 09, Mon
    Bitcoin (BTC) remains under pressure on Monday, trading below the 50-week Simple Moving Average (SMA) at $75,222 after extending its losing streak to five consecutive weeks.
    placeholder
    Bitcoin ETFs sold $1.28 billion in a week — and BTC is still above 75,000US spot Bitcoin ETFs logged $1.28 billion of net outflows in the week to Nov 6, the largest since late June, with BlackRock's IBIT accounting for $1.21 billion. Yet BTC only fell from $80,405 to $74,940, a 6.8% move. The gap between the fund flow and the price is the story: leveraged longs were flushed, but spot holders did not follow the ETFs out — and $75,000 is the line that decides whether that reading holds.
    Author  Suzie
    Nov 09, Mon
    US spot Bitcoin ETFs logged $1.28 billion of net outflows in the week to Nov 6, the largest since late June, with BlackRock's IBIT accounting for $1.21 billion. Yet BTC only fell from $80,405 to $74,940, a 6.8% move. The gap between the fund flow and the price is the story: leveraged longs were flushed, but spot holders did not follow the ETFs out — and $75,000 is the line that decides whether that reading holds.
    placeholder
    Binance replaced 95% of a $6.3bn hole — Bitcoin is trading the plumbing, not the coinBinance resumed withdrawals on November 1 after a record $6.3bn theft. In the first 9.5 hours, users withdrew $4.64bn and deposited $1.01bn, a net outflow of $3.64bn, or 2.1% of assets. Bitcoin fell to 76,173 and is now 78,473. The market is pricing the exchange, not the supply.
    Author  Suzie
    Nov 02, Mon
    Binance resumed withdrawals on November 1 after a record $6.3bn theft. In the first 9.5 hours, users withdrew $4.64bn and deposited $1.01bn, a net outflow of $3.64bn, or 2.1% of assets. Bitcoin fell to 76,173 and is now 78,473. The market is pricing the exchange, not the supply.
    Live Quotes
    Name / SymbolChart% Change / Price
    BTCUSD
    BTCUSD
    0.00%0.00
    ETHUSD
    ETHUSD
    0.00%0.00

    cryptocurrency Related Articles

    • Top 3 Price Prediction: Bitcoin, Ethereum, Ripple — Bulls take the reins, with $100K BTC, $3,500 ETH and $2.35 XRP in focus
    • Best Strategies When BTC Price Drops: From Hedging to Accumulating
    • How to Day Trade Crypto? Simplest Day Trading Strategy Ever
    • Trading Chart Patterns:Ultimate Guide to Price Action
    • Places that Provide Cheapest Ways to Buy Bitcoin In 2025
    • 10 Best Crypto With Most Potential to Buy and invest in 2025 - Top Picks from Expert Traders

    Click to view more